
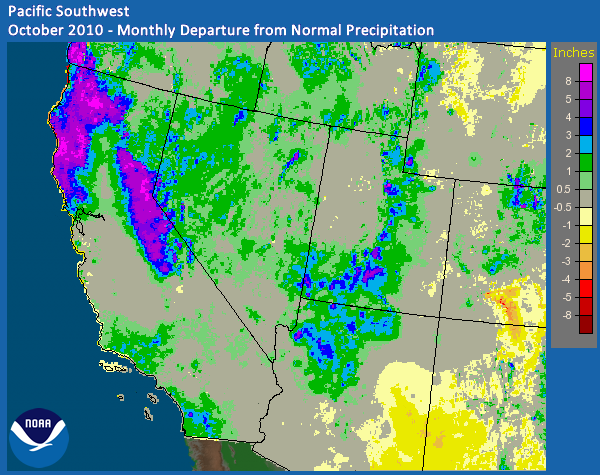
Early-Season Heavy Precipitation Event Navigation: General Summary | Precipitation | Weather Synopsis | Hydrologic Impacts For the second year in a row, a powerful early-season storm with copious amounts of tropical moisture brought well above normal precipitation to northern and central California before shifting east across the northern half of Nevada. As was the case in the October 2009 storm, this heavy precipitation event was energized by a strong zonal upper jet stretching across the entire Pacific Ocean. The abundant moisture associated with this storm arrived in two waves. The initial pool of moisture originated just north of Hawaii, while the second and more significant tropical moisture plume was fueled by super typhoon Megi, which developed southwest of Guam on October 13th and struck the northern Philippines on October 18th, bringing torrential rains, flooding, and landslides. During this timeframe, tropical moisture from Megi sheared toward the northeast before being picked up by the strong westerlies aimed at the west coast near the California/Oregon border. By October 23rd into the early parts of the 25th, widespread heavy precipitation was being recorded across northern and central California before spilling over northern Nevada. Although much of the precipitation fell in a 36- to 48-hour window, amounts in excess of 10 inches were recorded across the northern Sierra between the Feather and American River basins. Southerly winds also impacted the region at the height of the storm as pressure gradients increased. Sustained winds from the immediate coast to inland locations were in the 20- to 40-mph range. However, peak wind gusts approached 50 mph. Overall, hydrologic responses were muted due to the early-season timing of the storm along with dry antecedent soil conditions. However, two eastern Sierra Nevada river basins did experience sharp rises to a critical stage. Given the intense precipitation and extremely high snow levels, the West Fork of the Carson River at Woodfords rose to its monitor stage, while the West Walker River at US Highway 395 Below Little Walker reached just above its flood stage. Along the West Walker River, anticipated higher flows downstream across extreme western Nevada in Lyon county were much less than the initial concern due to the diversion of some of the water into Topaz Lake. On the west slope of the Sierra Nevada, the most impressive rise was on the Merced River at Pohono Bridge in Yosemite National Park, where the crest was 0.5 foot from flood stage. [ Click here for an interactve map of precipitation from this event ] The widespread precipitation observed with this early-season powerful storm pushed monthly totals well above normal for the month of October. Figure 1 indicates the higher terrain of northern California saw in excess of generally 4 to 8 inches of precipitation when compared with a normal October. Over central California, the coastal mountains actually finished the month near normal (with exception of a few locales in the Santa Cruz and Santa Lucia Mountains), but the adjacent southern Sierra Nevada was primarily 2 to 6 inches above normal. Farther inland across northern Nevada, totals were for the most part 1 to 3 inches above normal with a few stations in the Ruby Mountains reflecting an almost 5 inch departure from normal. As a result of this wet early-season storm, percent of normal values for October across northern and central California along with northern Nevada generally ranged from 150 to 400.
Figure 1. October 2010 - Monthly Departure from Normal Precipitation. The table below shows links to the daily precipitation totals in gridded, gage, and KML format. While the majority of the precipitation was recorded from the evening of October 23rd (24/0000 UTC) through the morning of October 25th (25/1200 UTC), the day prior to the 24th was included to encompass the entire precipitation event.
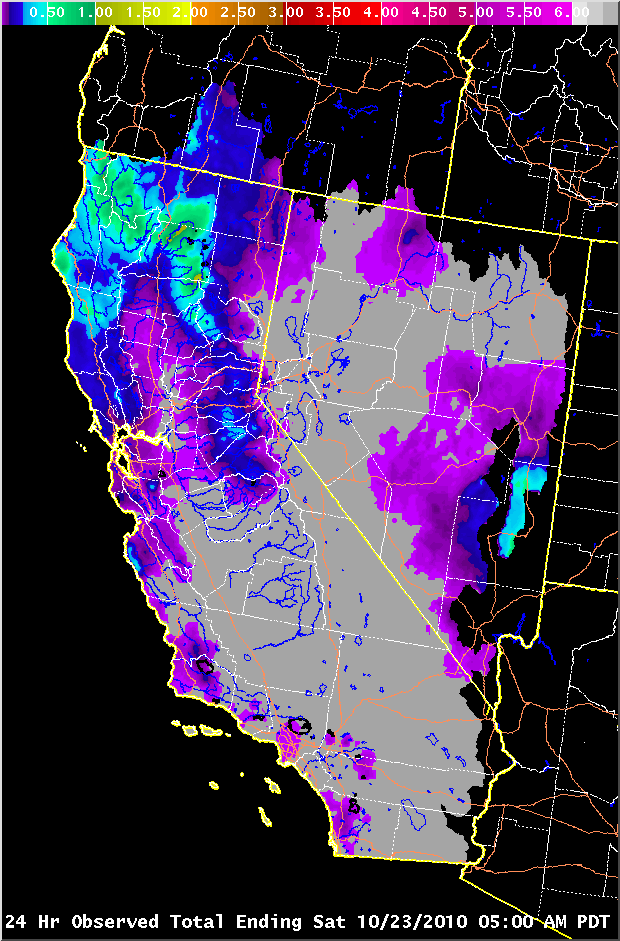
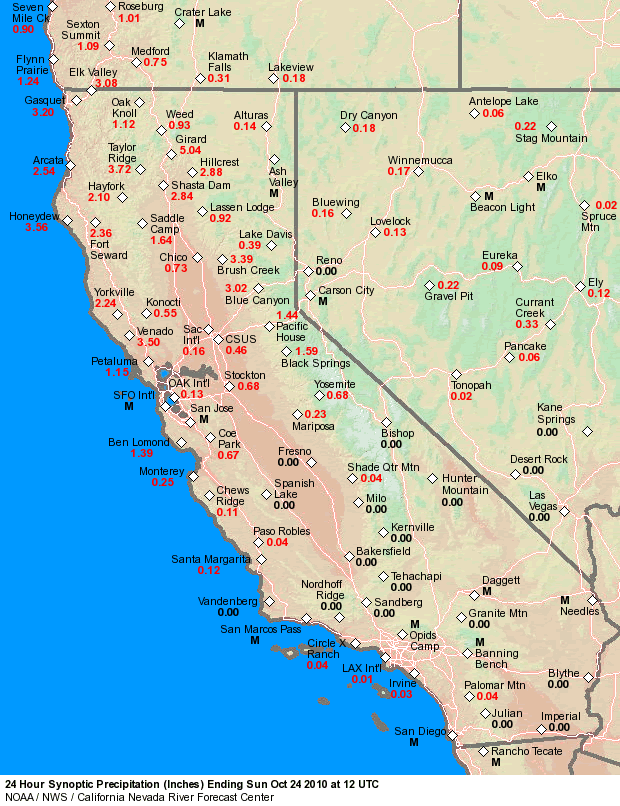
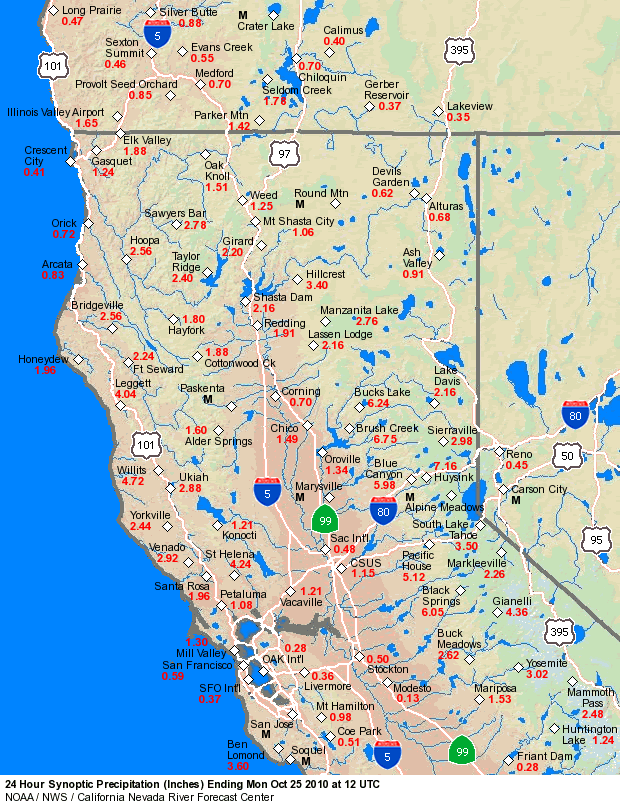
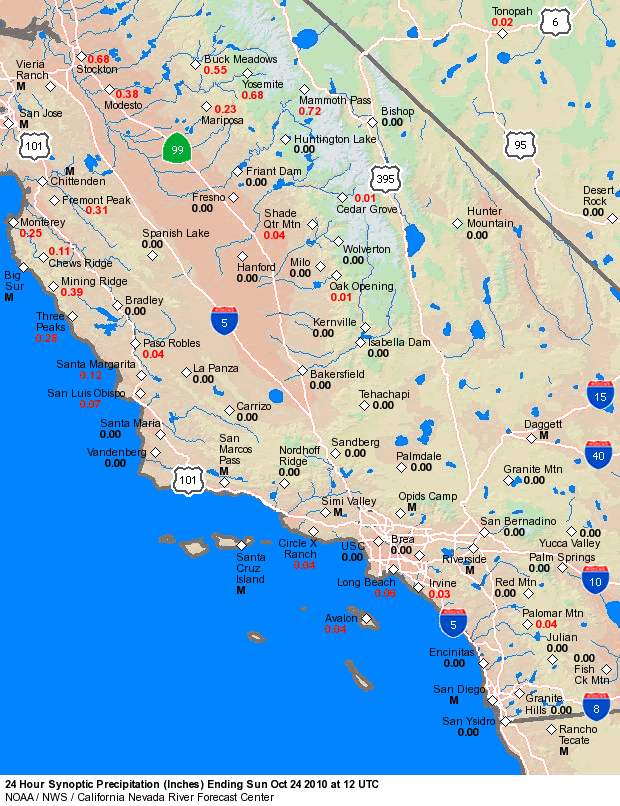
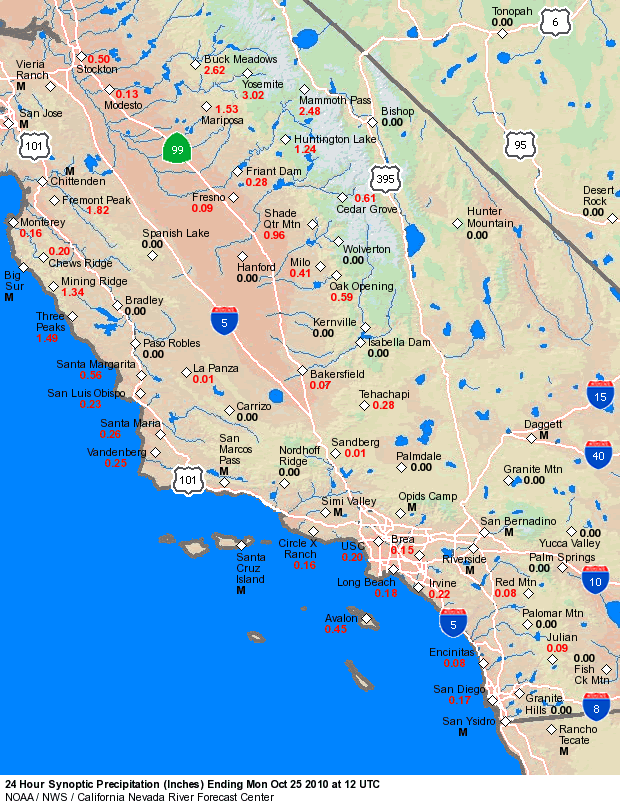
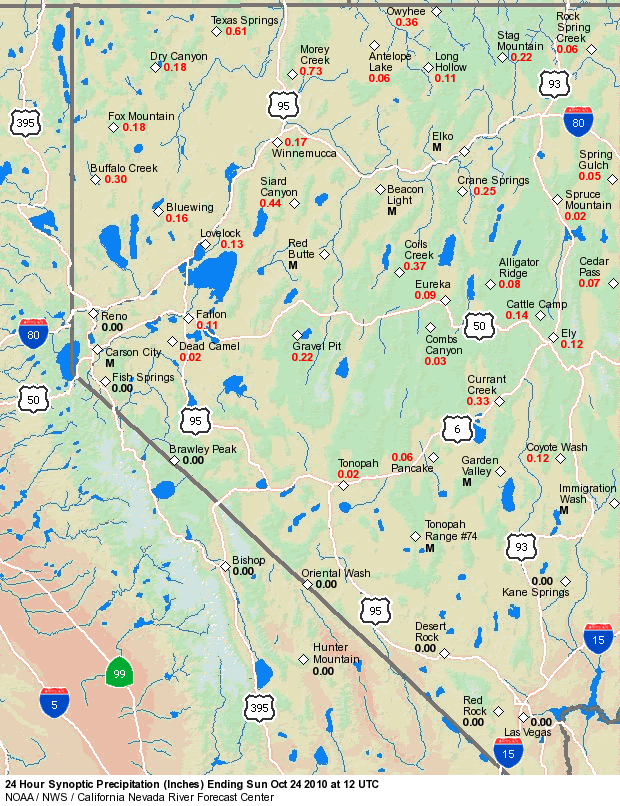
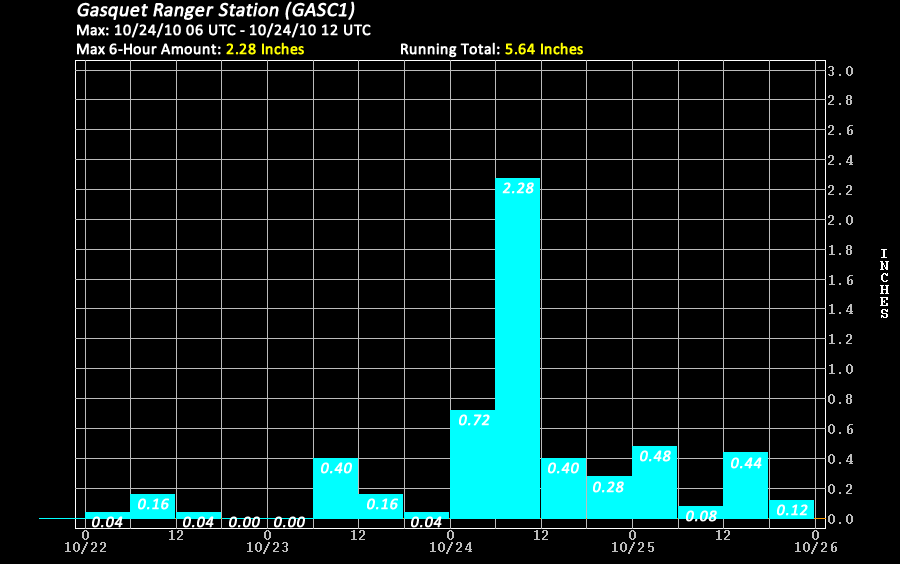
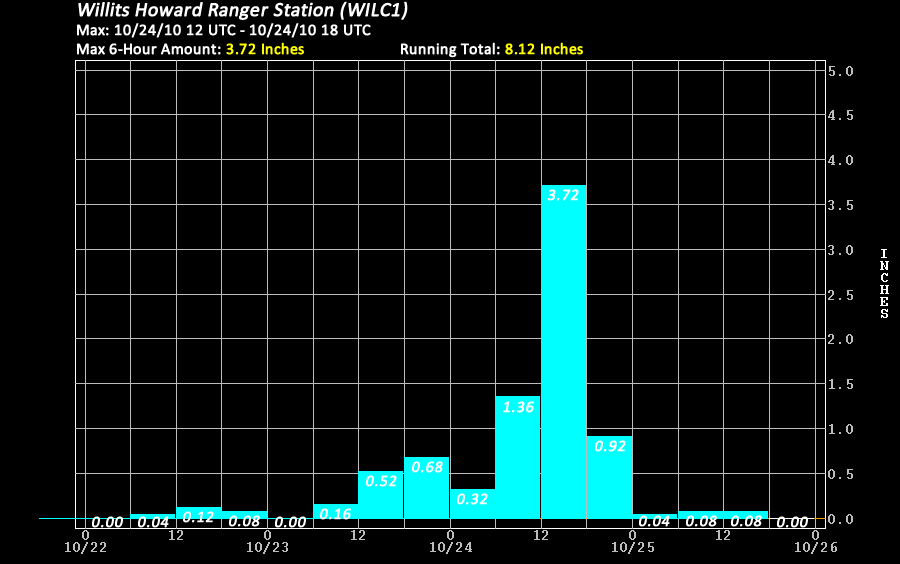
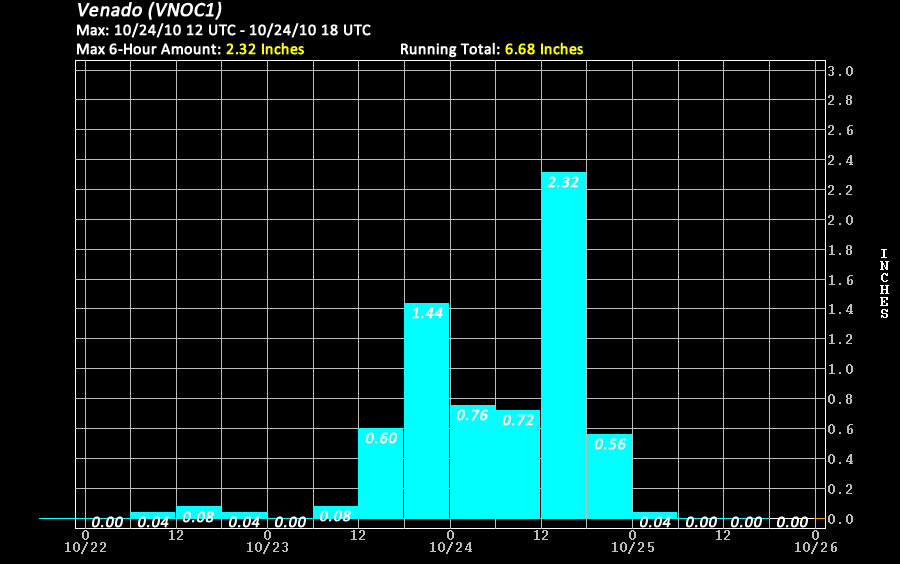
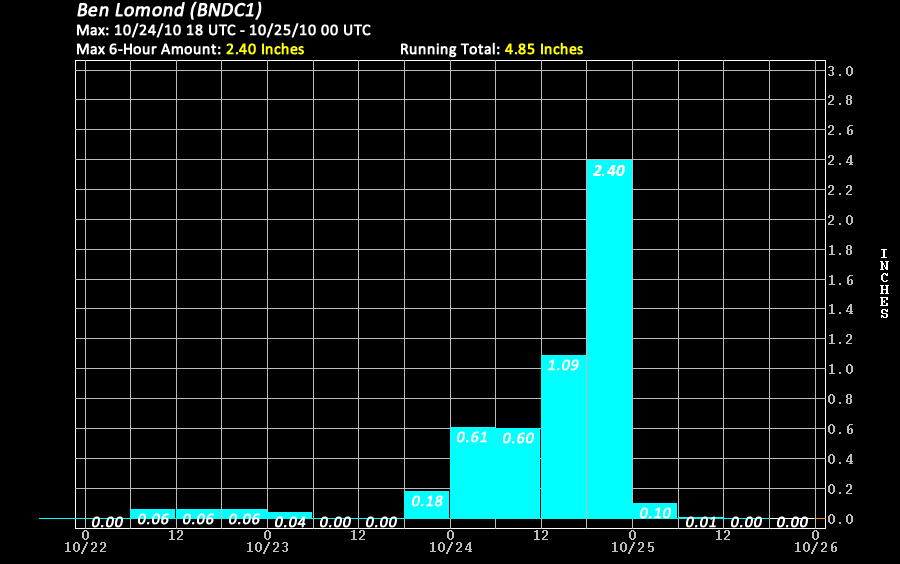
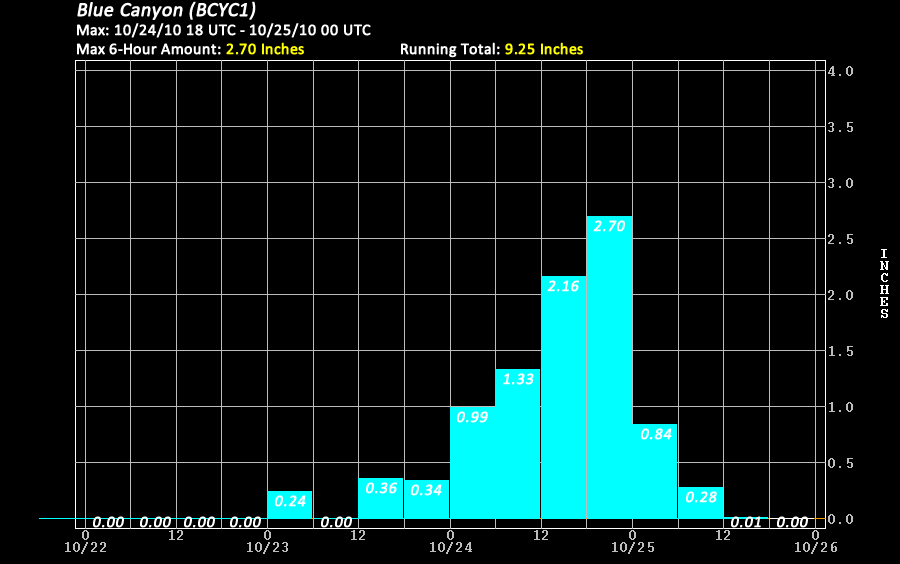
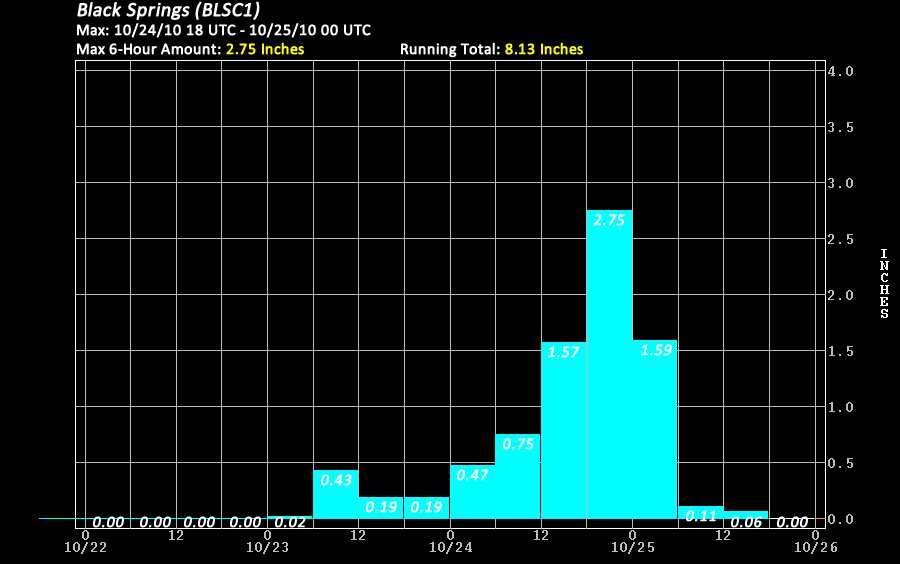
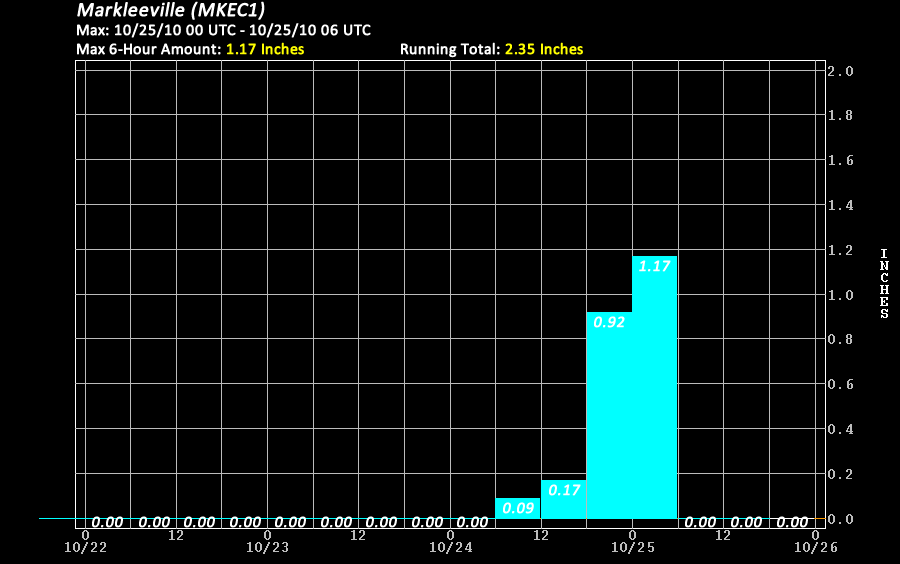
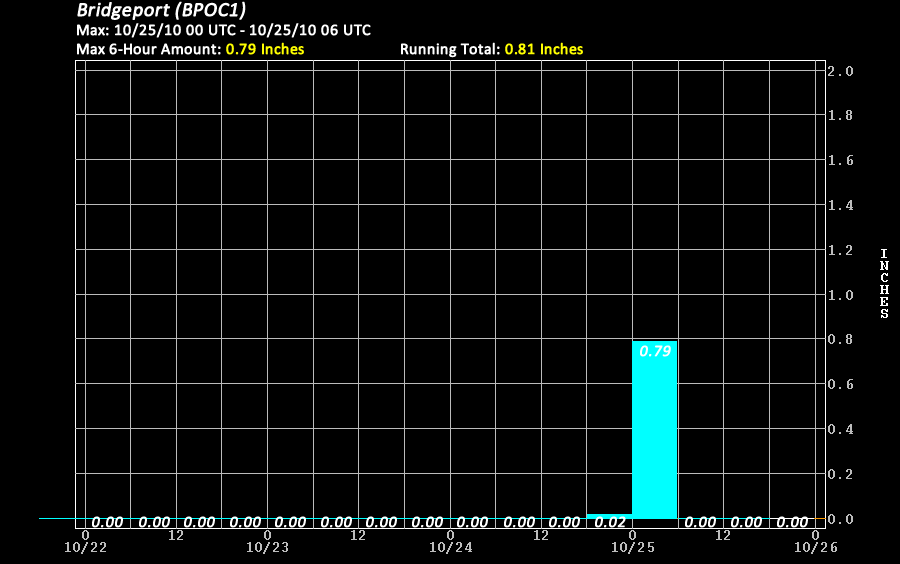
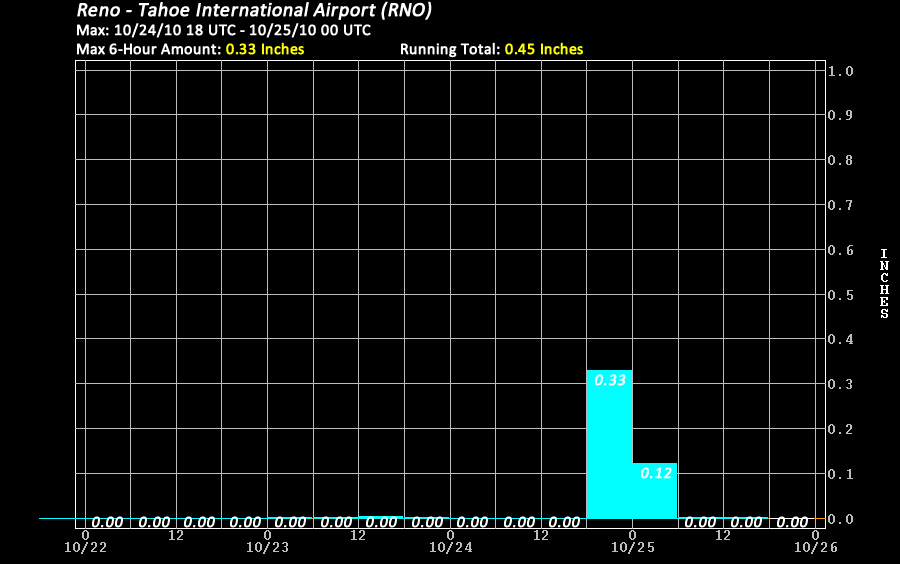
The most intense precipitation associated with this storm system primarily fell in a 24-hour window on Sunday, October 24th (24/0600 UTC to 25/0600 UTC). Initially on Sunday, heavy precipitation was being observed on the California North Coast. Throughout the day, the highest precipitation rates shifted south toward the San Francisco Bay Area and inland over the Sierra Nevada and much of northern Nevada. Heaviest 6-hour amounts peaked just shy of 4 inches over the higher terrain of northern California, while just east of the Sierra Nevada crest totals ranged from 1 to 2 inches. Northern Nevada 6-hour amounts were also quite impressive, generally between 1/4 and 3/4 inch. The table below shows select precipitation gage reports across northern and central California along with northern Nevada, indicating the maximum 6-hour synoptic precipitation amount, time period of heaviest precipitation, and a link to a plot displaying 6-hour precipitation amounts from 22/0000 UTC to 26/0000 UTC.
Since 1920, the California Department of Water Resources has tracked precipitation data at eight precipitation gages located over the mountainous terrain from Shasta Lake in the north to the American River basin in the south. The 8-Station Index* for October 2010 saw 7.5 inches of liquid equivalent precipitation with the majority being contributed from the October 23rd through 25th storm. This ranked October 2010 as the 6th wettest October on record. Also, with an average of 3.0 inches during the month of October, this placed October 2010 at 250 percent of normal. The California Department of Water Resources has a similar index for the San Joaquin basin, referred to as the 5-Station Index**. With data back to 1904, October 2010 ranked as the wettest on record at 7.4 inches. With the average October at 2.0 inches, October 2010 was an amazing 370 percent of average. The October 23rd through 25th event contributed approximately two-thrids of the October total, while an early month storm contributed the other third.
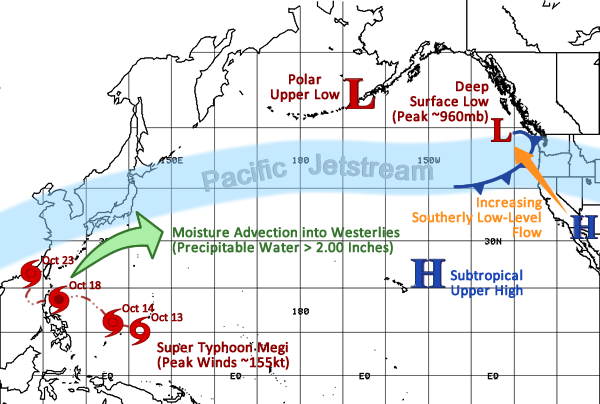
* Note 1: The 8-Station Index consists of the following locations: Mount Shasta City, Shasta Dam, Mineral, Quincy, Brush Creek, Sierraville RS, Blue Canyon, and Pacific House. ** Note 2: The 5-Station Index consists of the following locations: Calaveras Big Trees, Hetch Hetchy, Yosemite National Park Headquarters, North Fork RS, and Huntington Lake. Similar to the powerful storm of October 2009, another early-season heavy precipitation event (October 23rd through early October 25th) took aim at northern and central California before shifting inland to affect much of the northern half of Nevada. In the week leading up to the heavy precipitation, the east Asian jetstream (EAJS) strengthened and extended toward the west coast of the United States just north of 40N. This zonal flow was enhanced by a deep polar upper low situated over the Aleutian Islands and a subtropical upper high located just east of Hawaii, resulting in a tightened thermal gradient. Powerful westerly winds approached 200 knots in the core of this jetstream over the eastern Pacific between 140W and 170W at the height of the event. Like the October 2009 event, an abundant moisture feed was provided by a super typhoon affecting the western Pacific. Super typhoon Megi made landfall over the northern Philippines on October 18th, 2010 with peak winds near 155 knots. This occurred just 5 days after initially developing into a tropical system southwest of Guam. Moisture from this system sheared toward the northeast and became entrained into the strong westerly flow across the Pacific aimed at the west coast of the United States. Satellite estimates indicated peak precipitable water values within this tropical moisture plume surpassing 2 inches. The schematic below (Figure 2) depicts the setup of the key ingredients across the entire Pacific Ocean as the early-season signficiant precipitation event took shape and affected northern/central California inland toward northern Nevada from October 23rd through the 25th.
Figure 2. General weather pattern across Pacific Ocean and West Coast for mid-October. With a moisture feed back to the tropical western Pacific, available moisture was well above seasonal normals. The upper air sounding at Oakland (KOAK) showed precipitable water values peaking at 1.60 inches on October 24th at 5 PM after hovering around 1.50 inches for the previous 24 hours. A tremendous amount of this tropical moisture advected inland across the crest of the Sierra Nevada under deep west-southwest flow. At both Reno (KREV) and Elko (KLKN), PW values topped out at 0.91 and 0.85 inch respectively. Overall, these precipitable water values recorded along the I-80 corridor from the coast inland toward northeast Nevada represented approximately 275 to 325 percent of seaonal normals. A more detailed analysis using hourly data from NOAA/GSD Ground-Based GPS-MET Water Vapor Sensors indicate peak integrated precipitable water estimates ranging from just shy of 1.0 inch at Reno and Elko to approximately 2.0 inches along the coast at Bodega Bay. Given the tropical nature of this heavy precipitation event, freezing levels remained quite high through the duration of the storm. At the peak of the precipitation on October 24th, freezing levels jumped to nearly 9,500 feet across southern Oregon, while farther south these levels peaked just shy of 13,000 feet along the I-80 corridor. Not until much of the precipitation tapered off did freezing levels drop to more seasonable levels. The ESRL PSD Chico Vertical Profiler showed a trace of snow levels starting out around 8,000 feet early on Saturday the 23rd before rising steadily under a warm advection pattern to a peak near 12,000 feet by early Sunday the 24th. As already mentioned, these high snow levels persisted through the duration of the heaviest precipitation on Sunday. Southerly winds in the low levels veered to a west-southwest direction in the mid levels ahead of the baroclinic zone, indicative of strong warm air advection. At 700 mb, winds peaked in the range of 50 to 65 knots from the west-southwest. This allowed for favorable orographics on the west-facing slopes of the northern/central California coastal mountains as well as the northern and central Sierra Nevada. At the surface, a maturing surface low west of Vancouver Island peaked near 960 mb on the 24th. A tightening MSLP gradient across the region resulted in southerly winds through the Sacramento Valley to increase and generate confluent conditions over the Shasta Lake drainage. The MSLP gradient from Sacramento (KSAC) to Medford (KMFR) topped out around 12 mb with winds between Redding and Oroville ranging from 25 to 30 knots (30 to 35 mph) sustained. Higher wind gusts approaching 45 knots (50 mph) were recorded. As a result, enhanced precipitation totals were observed above Shasta Dam. The table below contains links to upper air soundings from across the region from just prior to the onset of the precipitation and continuing through the duration of the event. Some items of note in these soundings are as follows:
The following link displays National Weather Service 88-D radar imagery for the period of heaviest precipitation across the region. An initial cold front dropping south across northern California dissipated along the I-80 corridor later on October 22nd into the early morning hours on October 23rd. This boundary resulted in light precipitation. This stalled front was reinvigorated around the I-80 corridor later on October 23rd with the initial surge of moisture with an origin north of Hawaii. Finally on October 24th, the most intense precipitation was recorded across northern/central California inland toward northern Nevada as the primary surge of deep tropical moisture reached the coast and advected inland.
The following links display the evolution of the heavy precipitation event from a satellite perspective. The infrared imagery depicts the coldest cloud tops (below minus 60 degrees C) across northern California and northern Nevada on October 24th. Also, this loop shows the deep surface low maturing just west of Vancouver Island during the same time period. The primary feature on the water vapor imagery is the moisture feed advecting east along 40N toward the west coast as well as the rapidly developing circulation west of Vancouver Island. Finally, the AMSU TPW imagery shows the initial moisture source from north of Hawaii reaching the west coast on October 23rd with the primary deep tropical moisture feed advecting across the Pacific Ocean and reaching the northern CA coast on October 24th. Peak values within this main moisture source surpassed 2 inches.
The following table provides links to 6-Hourly NCEP/NCAR Reanalysis Data Composites for the period of October 21, 2010 (5 PM PDT) until October 25, 2010 (5 PM PDT). This time range encompasses the several days leading up to the event, and the duration of the heavy precipitation.
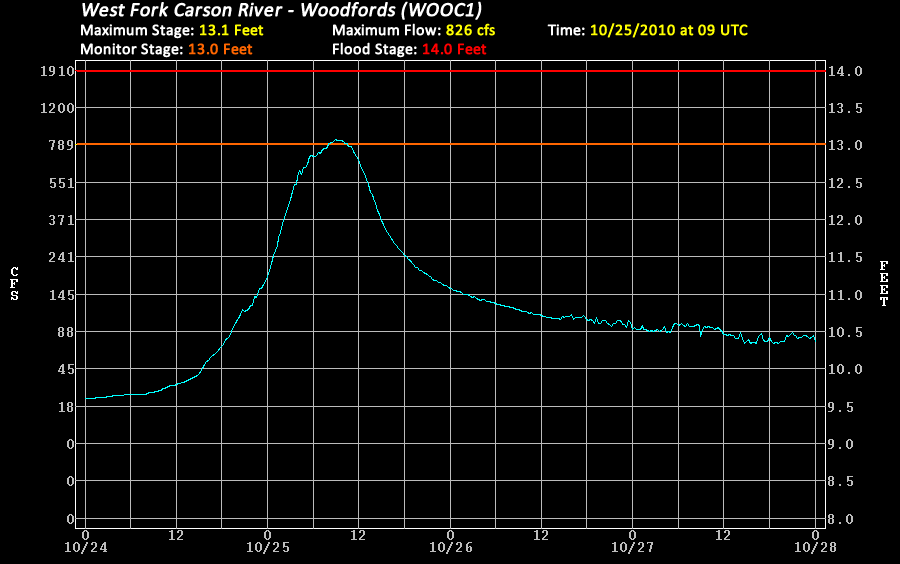
Although early-season dry antecedent soil conditions muted many responses on rivers across the area, a period of intense precipitation coupled with extremely high snow levels brought two smaller basins on the east slopes of the Sierra Nevada just south of Lake Tahoe to critical stages. The West Fork of the Carson River at Woodfords reached its monitor stage early on October 25th, peaking just above this level at 13.1 feet. No impacts from this rise were reported. The West Walker River at Highway 395 Below Little Walker rose above its flood stage early on October 25th and peaked 0.2 feet above its flood stage of 6.0 feet. Anticipated higher flows downstream increased concerns of flooding across Lyon county in Nevada. However, these flows were less than expected due to some of the water being diverted into Topaz Lake. Also, the Merced River flowing through Yosemite National Park experienced a dramatic rise to just shy of its flood stage as a result of the majority of the basin receiving rain. The links below show the hydrographs for these three locations from base flow before the event, the rise to their peaks during the event, and the recession of the river once the precipitation dissipated. West Fork Carson River - Woodfords (WOOC1) The largest reservoirs across northern California saw minimal impacts from the early-season heavy precipitation. The table below indicates estimated peak inflows, timing of the peak inflow, and the change in storage/elevation from before until after the heaviest precipitation at each individual reservoir.
|
||||||||||||||||||||||||||||||||||||||||||||||||||||||||||||||||||||||||||||||||||||||||||||||||||||||||||||||||||||||||||||||||||||||||||||||||||||||||||||||||||||||||||||||||||||||||||||||||||||||||||||||||||||||||||||||||||||||||||||||||||||||||||||||||||||||||||||||||||||||||||||||||||||||||||||||||||||||||||||||||||||||||||||||||||||||||||||||||||||||||||||||||||||||||||||||||||||||||||||||||||||||||||||