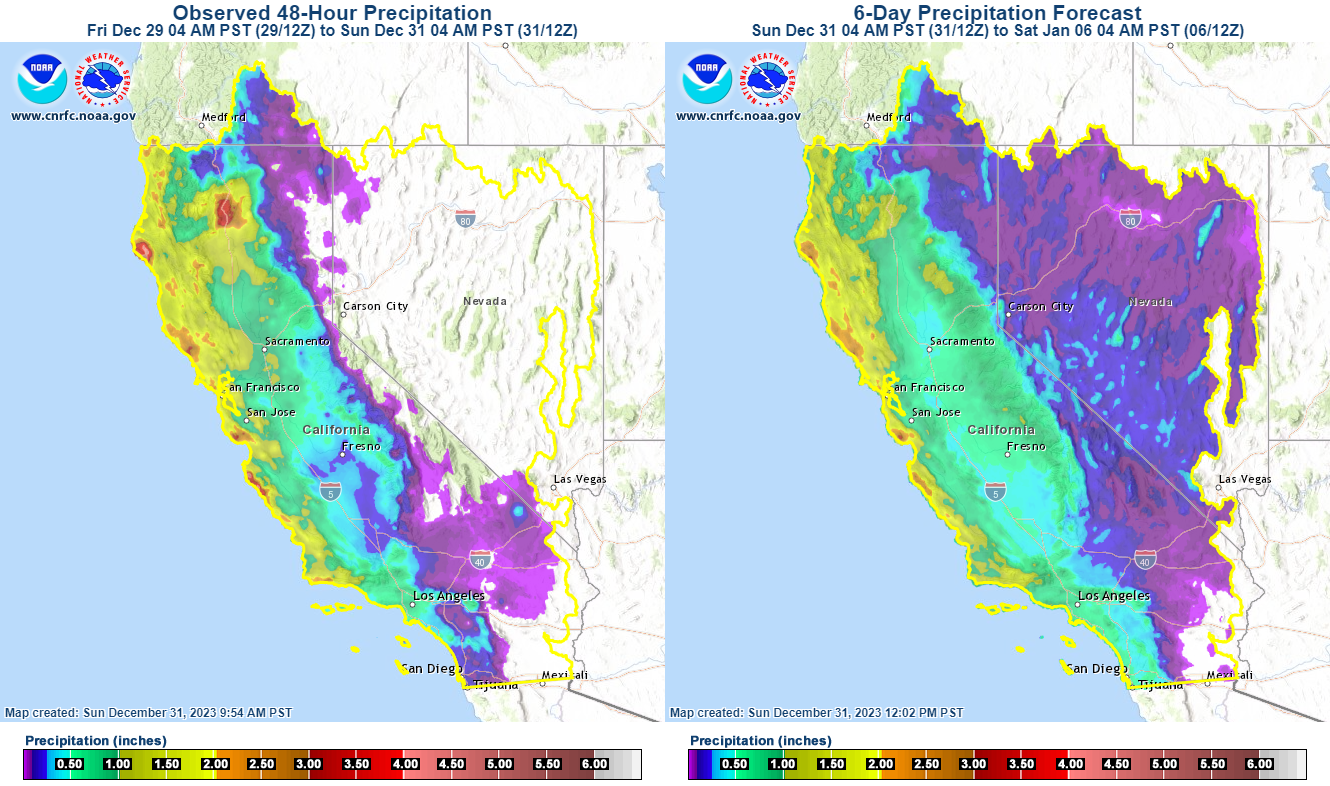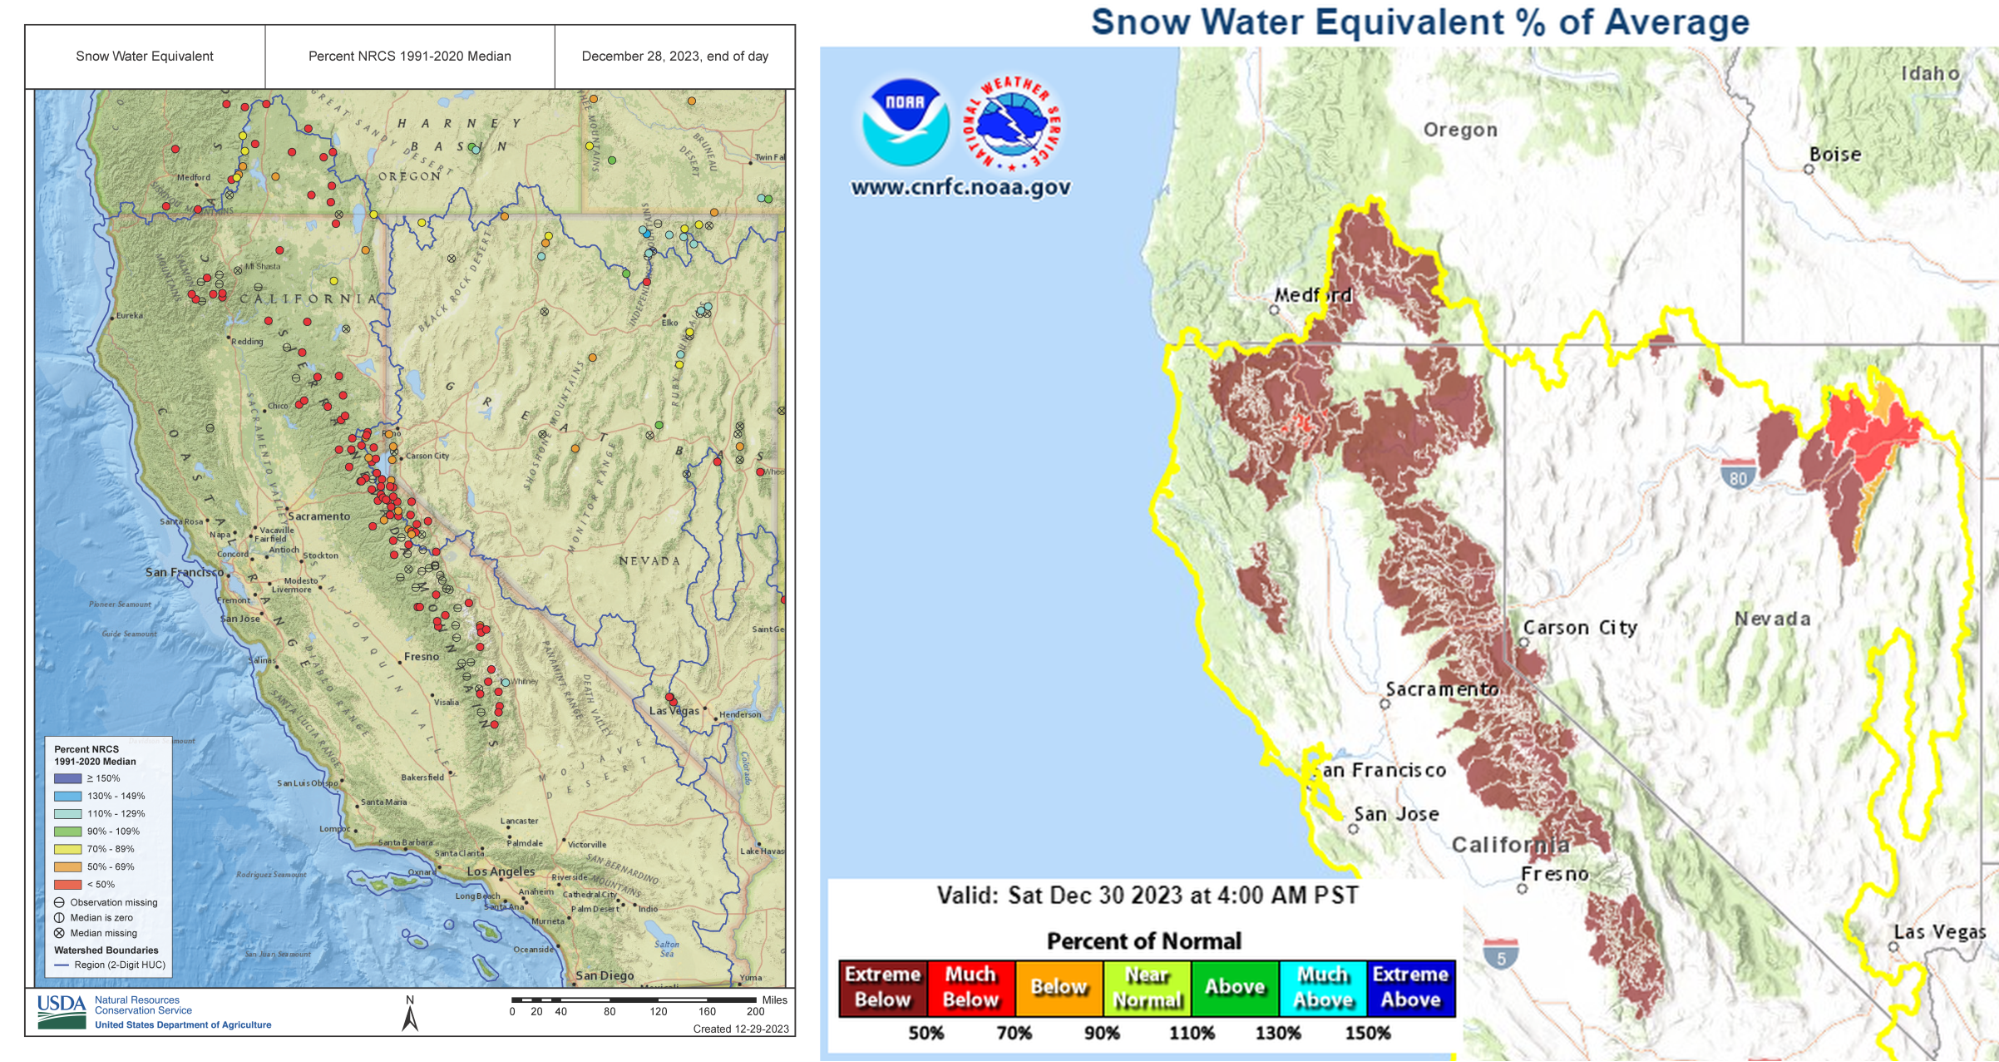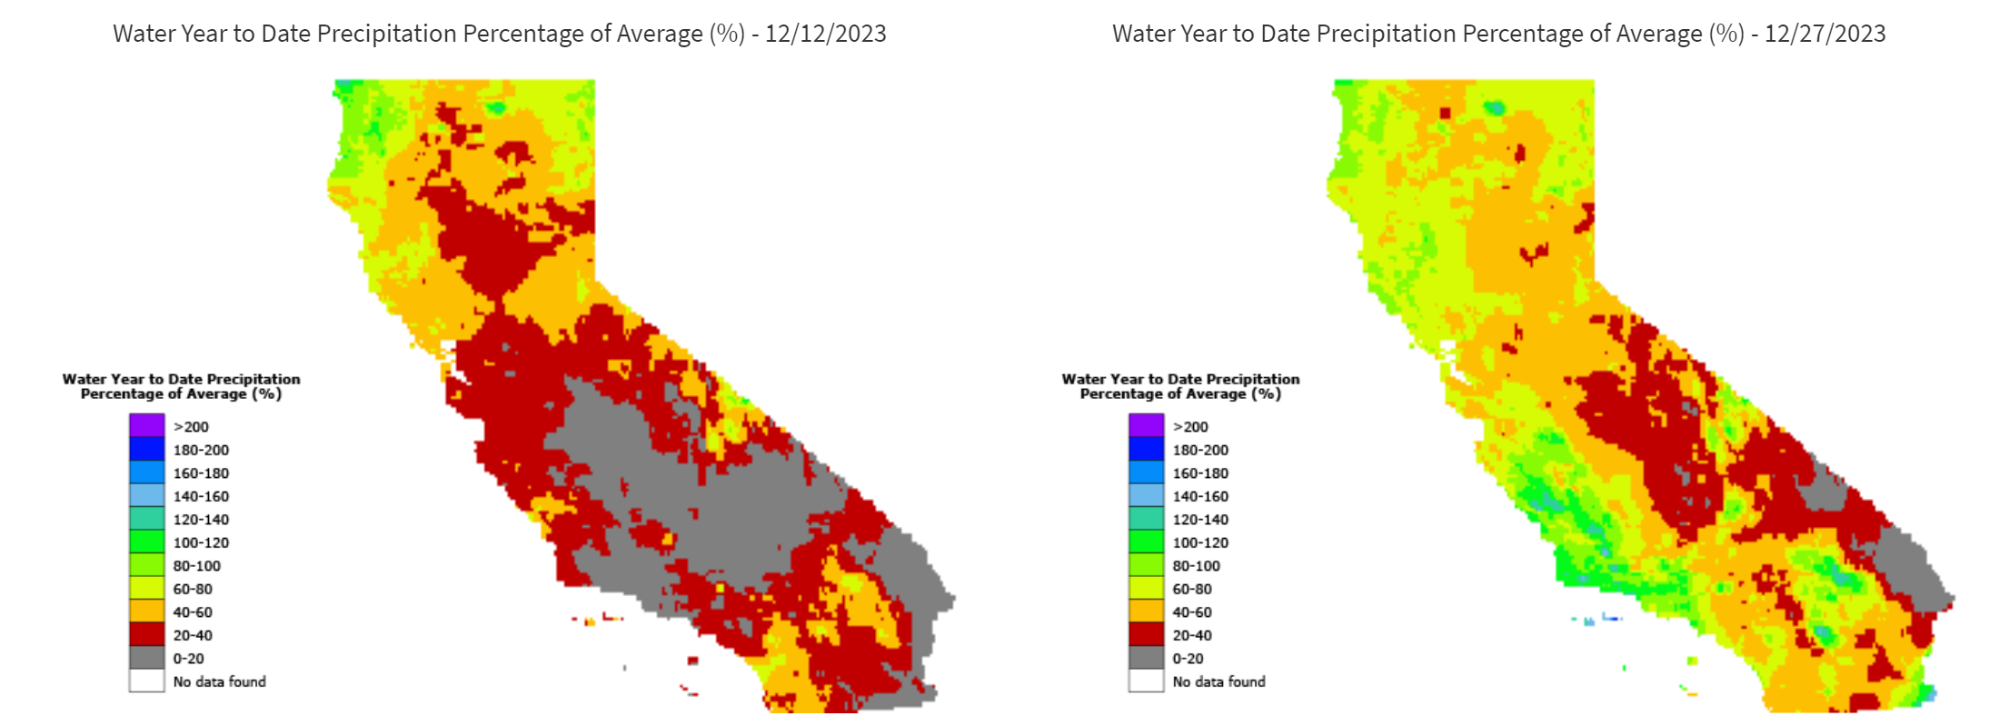
Recent warm weather systems improved statewide WY to date precipitation averages compared to the previous update. The largest improvement occurred along the Central Coast into Southern California. Despite the beneficial precipitation, the Sierra and foothills remain well below average (Figure 1). Unfortunately, portions of the Central and Southern Sierra received little precipitation over the last 48 hours and today’s 6 day precipitation forecast is somewhat limited (Figure 2). Snow water equivalent, measured at NRCS Snotel locations, continues to indicate a significant deficit compared to the 1991-2020 median, with most Sierra locations below 50% of the to date median. Likewise, nearly all CNRFC modeled basins have simulated SWE below 30% of normal (Figure 3). Currently, CNRFC non-zero simulated SWE is limited to upper elevation basin zones, with middle and lower elevation basins having no snowpack.
Figure 1: Precipitation across California. Source: CA Department of Water Resources
Figure 2: 48hr Observed Precipitation (12/29 -12/31) and 6 Day Forecast Precipitation (12/31 – 1/6). Source:
Figure 3: SWE Percent NRCS 1991-2020 Median. Source, CNRFC Modeled SWE. Source
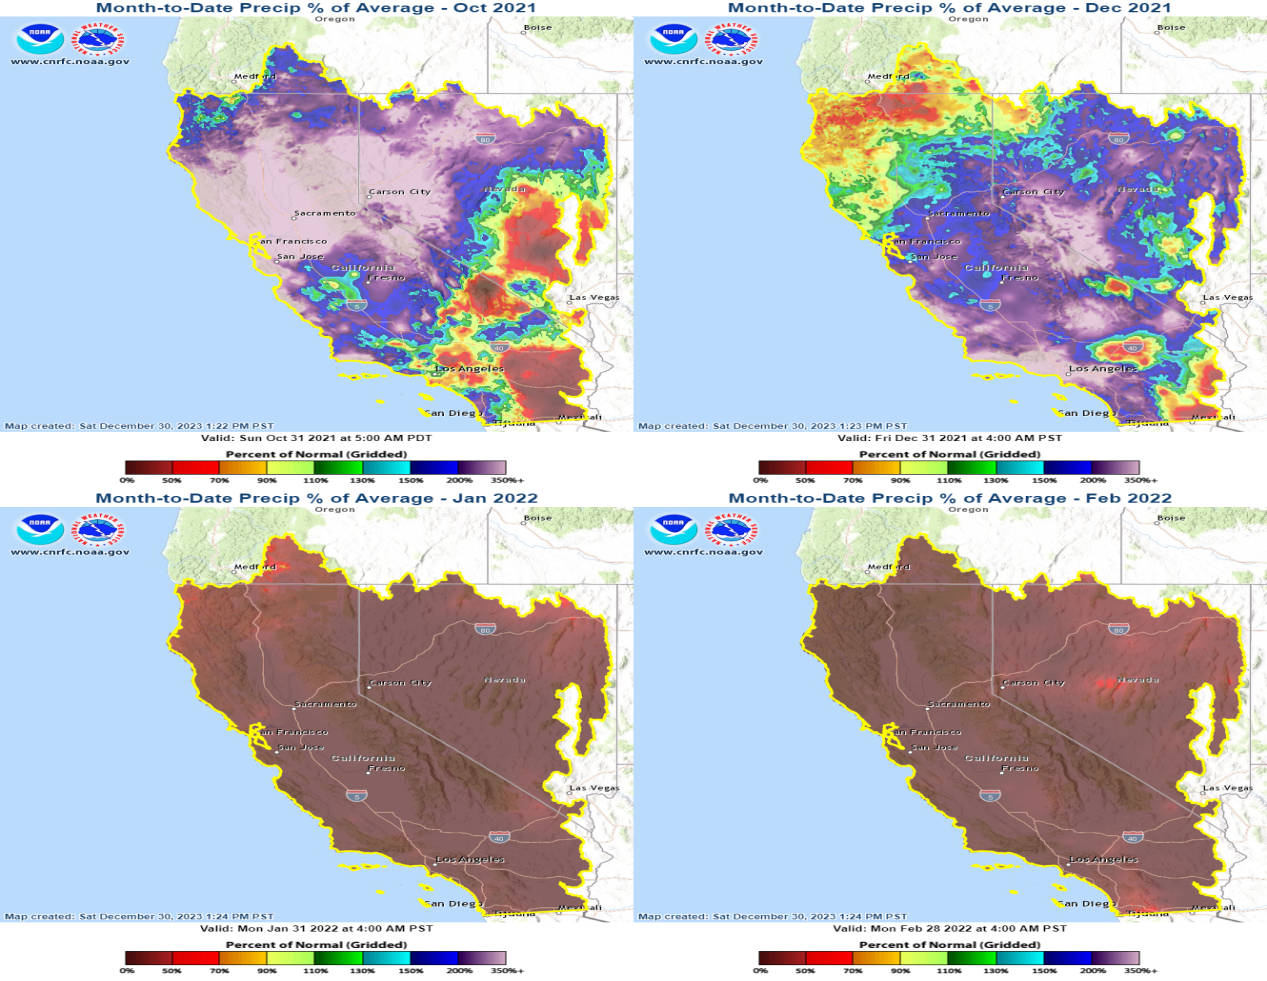
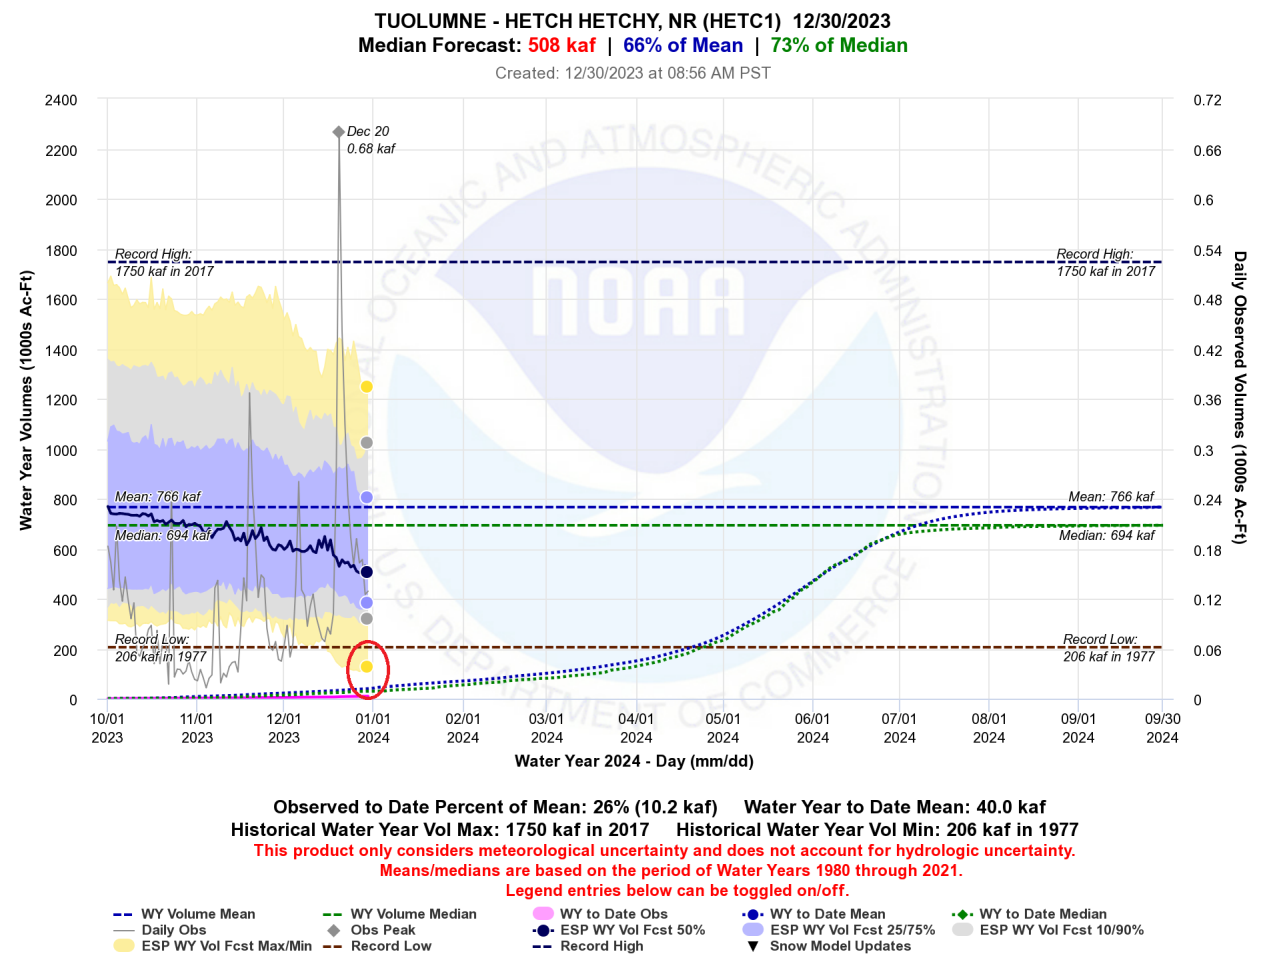
We’ve recently received a question about why some of our WY24 ensemble (HEFS) volume forecasts are indicating a minimum volume forecast dipping below the historical record low observed volume, for example at Hetch Hetchy Reservoir. After having a historical snowy winter last year, it would seem illogical a record low WY volume could immediately follow a wet year. For many locations a simplified answer is we have added an additional trace year (WY22) in our HEFS dataset. This is the first time WY22 has been included in our HEFS products. If you recall, WY22 was a record dry winter with very little precipitation, essentially none in January and February. However, October 2021 and December 2021 had widespread above average precipitation so WY22 started off promising (Figure 4). So by combining the remaining months of the WY22 trace (record dry) with the observed dry start to WY24 allows for a record low volume which is what is depicted in the Hetch Hetchy plot (Figure 5). The quick take-away is the recent record setting years should continue to build robustness into CNRFC ensemble products. By adding these extreme years, additional spread will be incorporated into the probabilistic products. It is important to stress that while record low WY volumes could occur, it is not the most probable scenario. Unfortunately, WY23 is not yet included in our HEFS dataset.
Figure 4: WY22 Monthly Percent of Normal Precipitation. Source:
Figure 5: Hetch Hetchy WY24 Volume Forecast. Source:
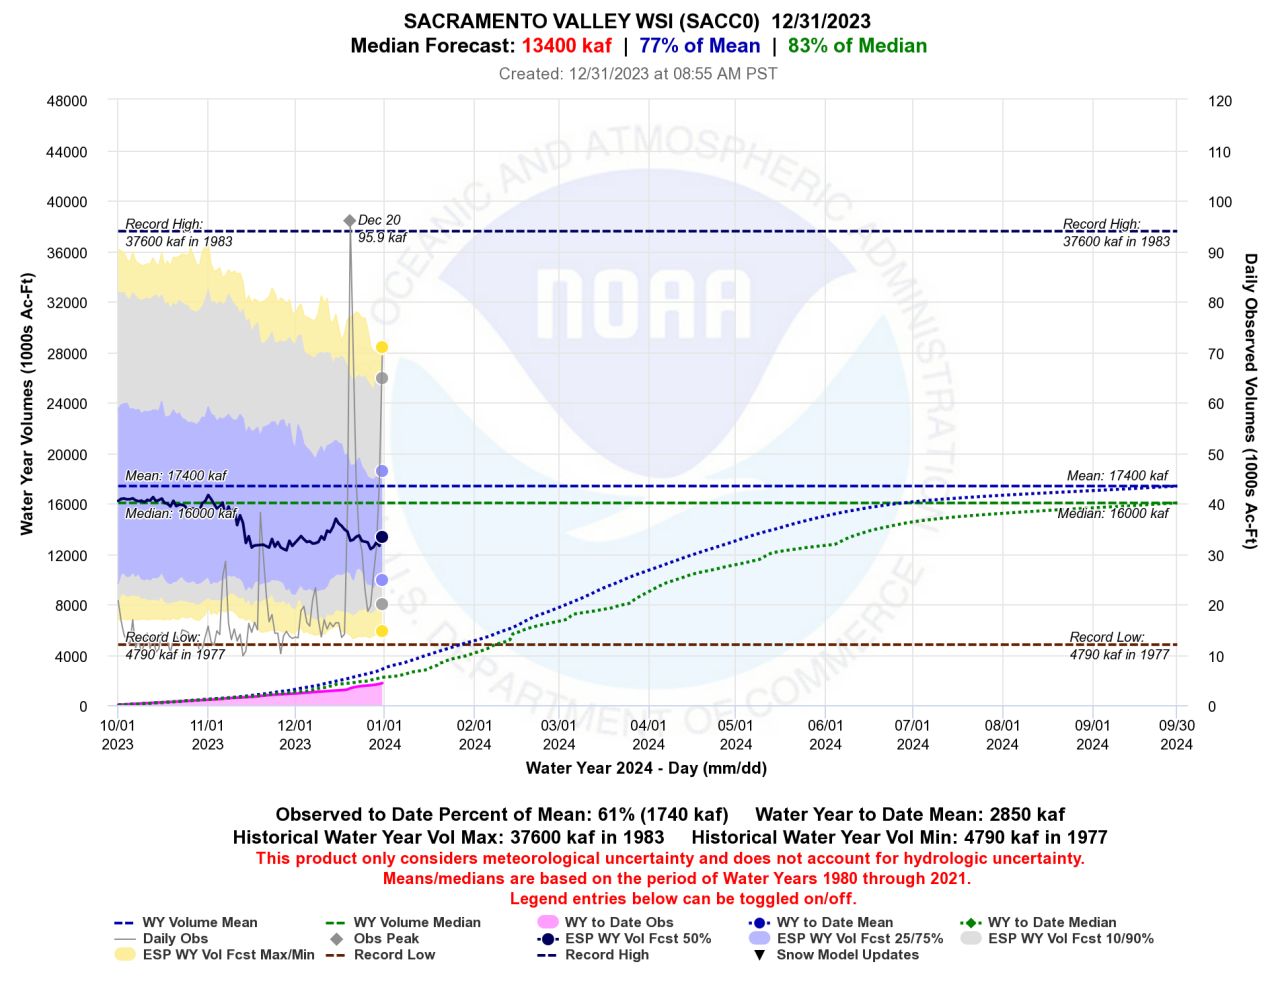
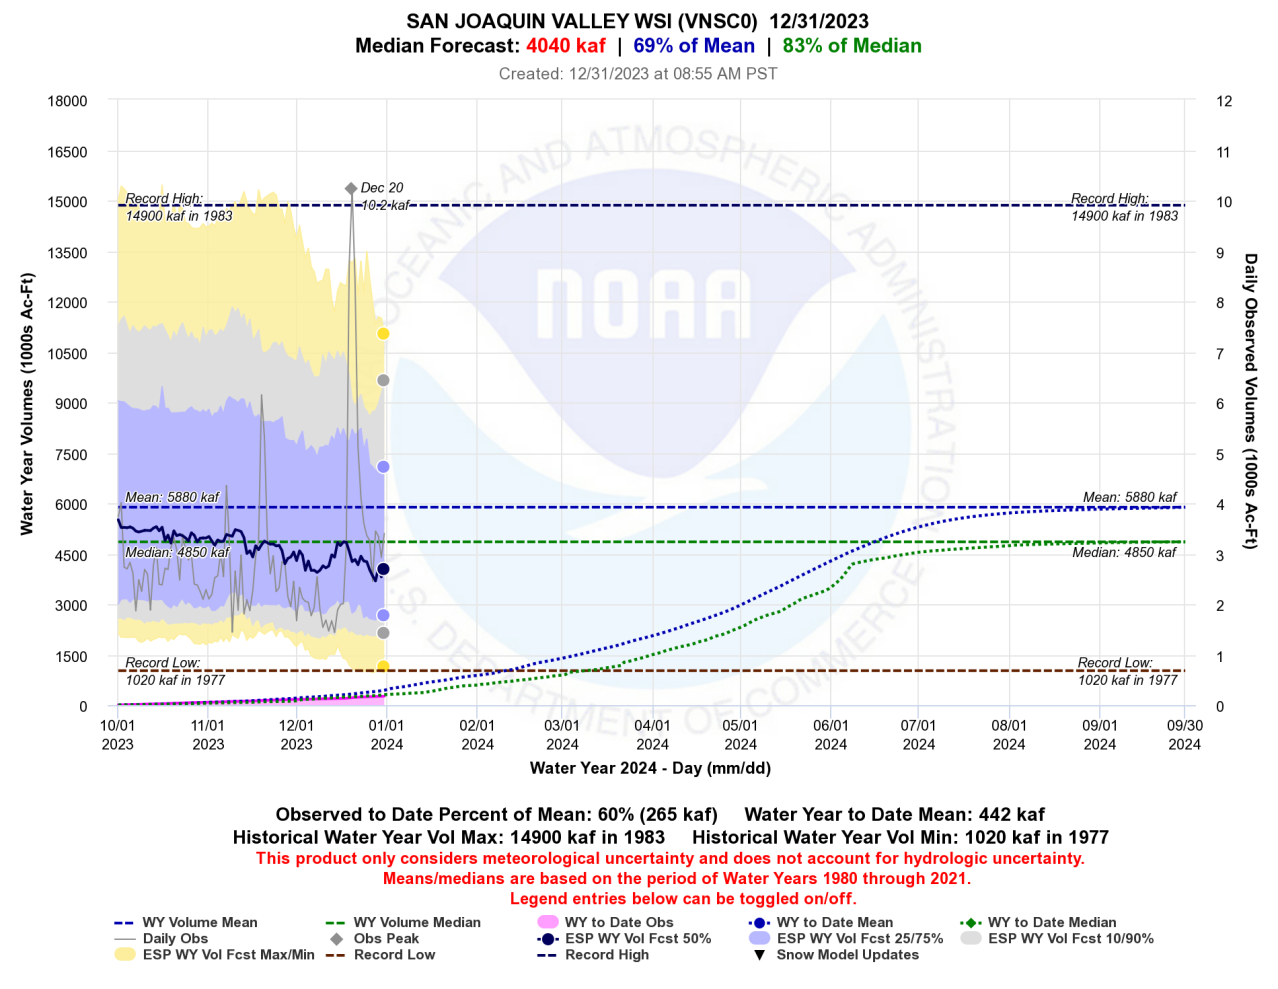
CNRFC WY24 water supply forecasts (Figures 6 and 7) continue to indicate unimpaired WY24 volume forecasts have stagnated and continue to trend below the ~ 40 year mean and median for both the Sacramento and San Joaquin systems. Some positive news is this weekend’s observed precipitation and upcoming forecasted precipitation has allowed the black trend lines (50% WY forecast) to tick upward. Hopefully, many more storms will arrive this winter and the forecast will continue to climb. It is important to note, at this early point in winter, there is a lot of uncertainty in our water supply forecasts. The size and range of the shaded bands (yellow, gray, purple) which correspond to different probabilities will eventually shrink as we move towards spring.
Figure 6: Sacramento Valley Water Supply Index. Source:
Figure 7: San Joaquin Valley Water Supply Index. Source:
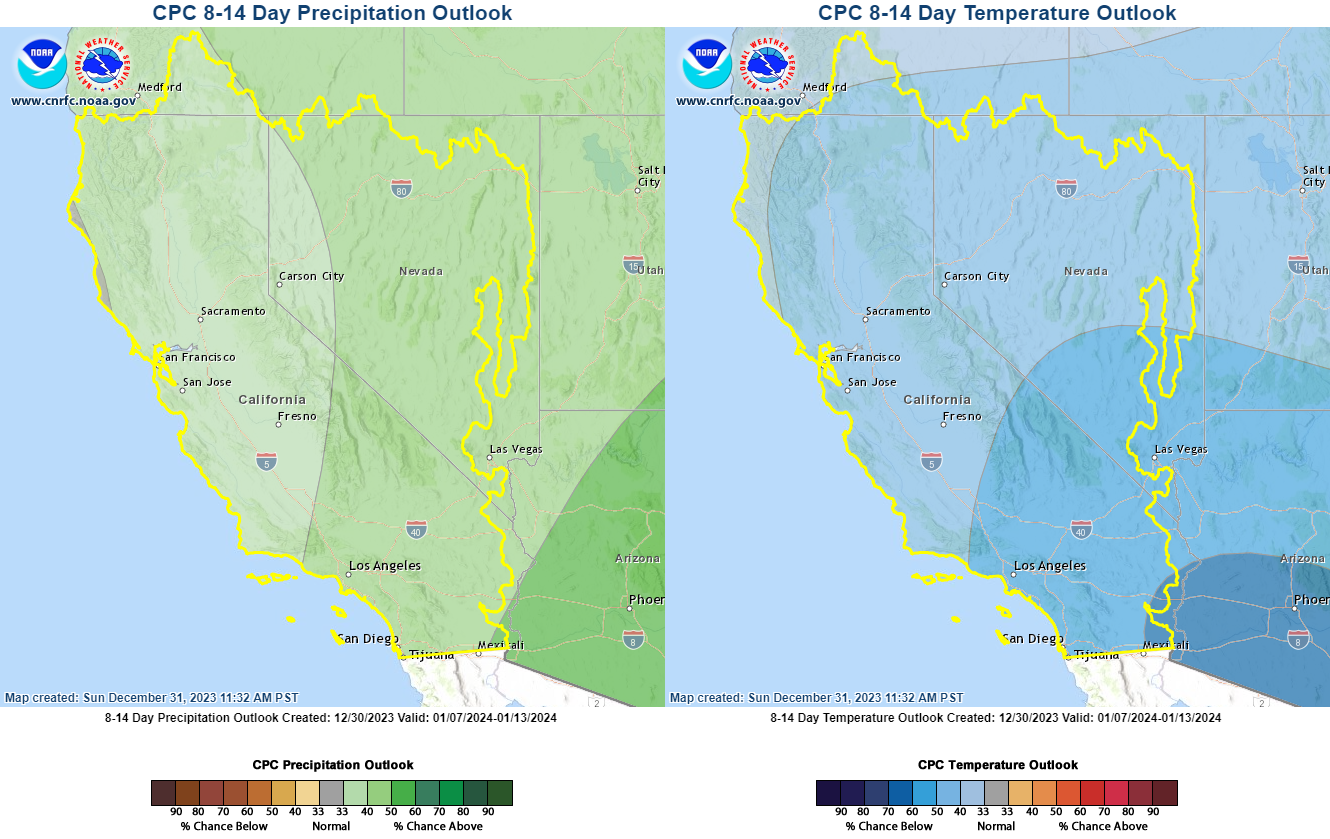
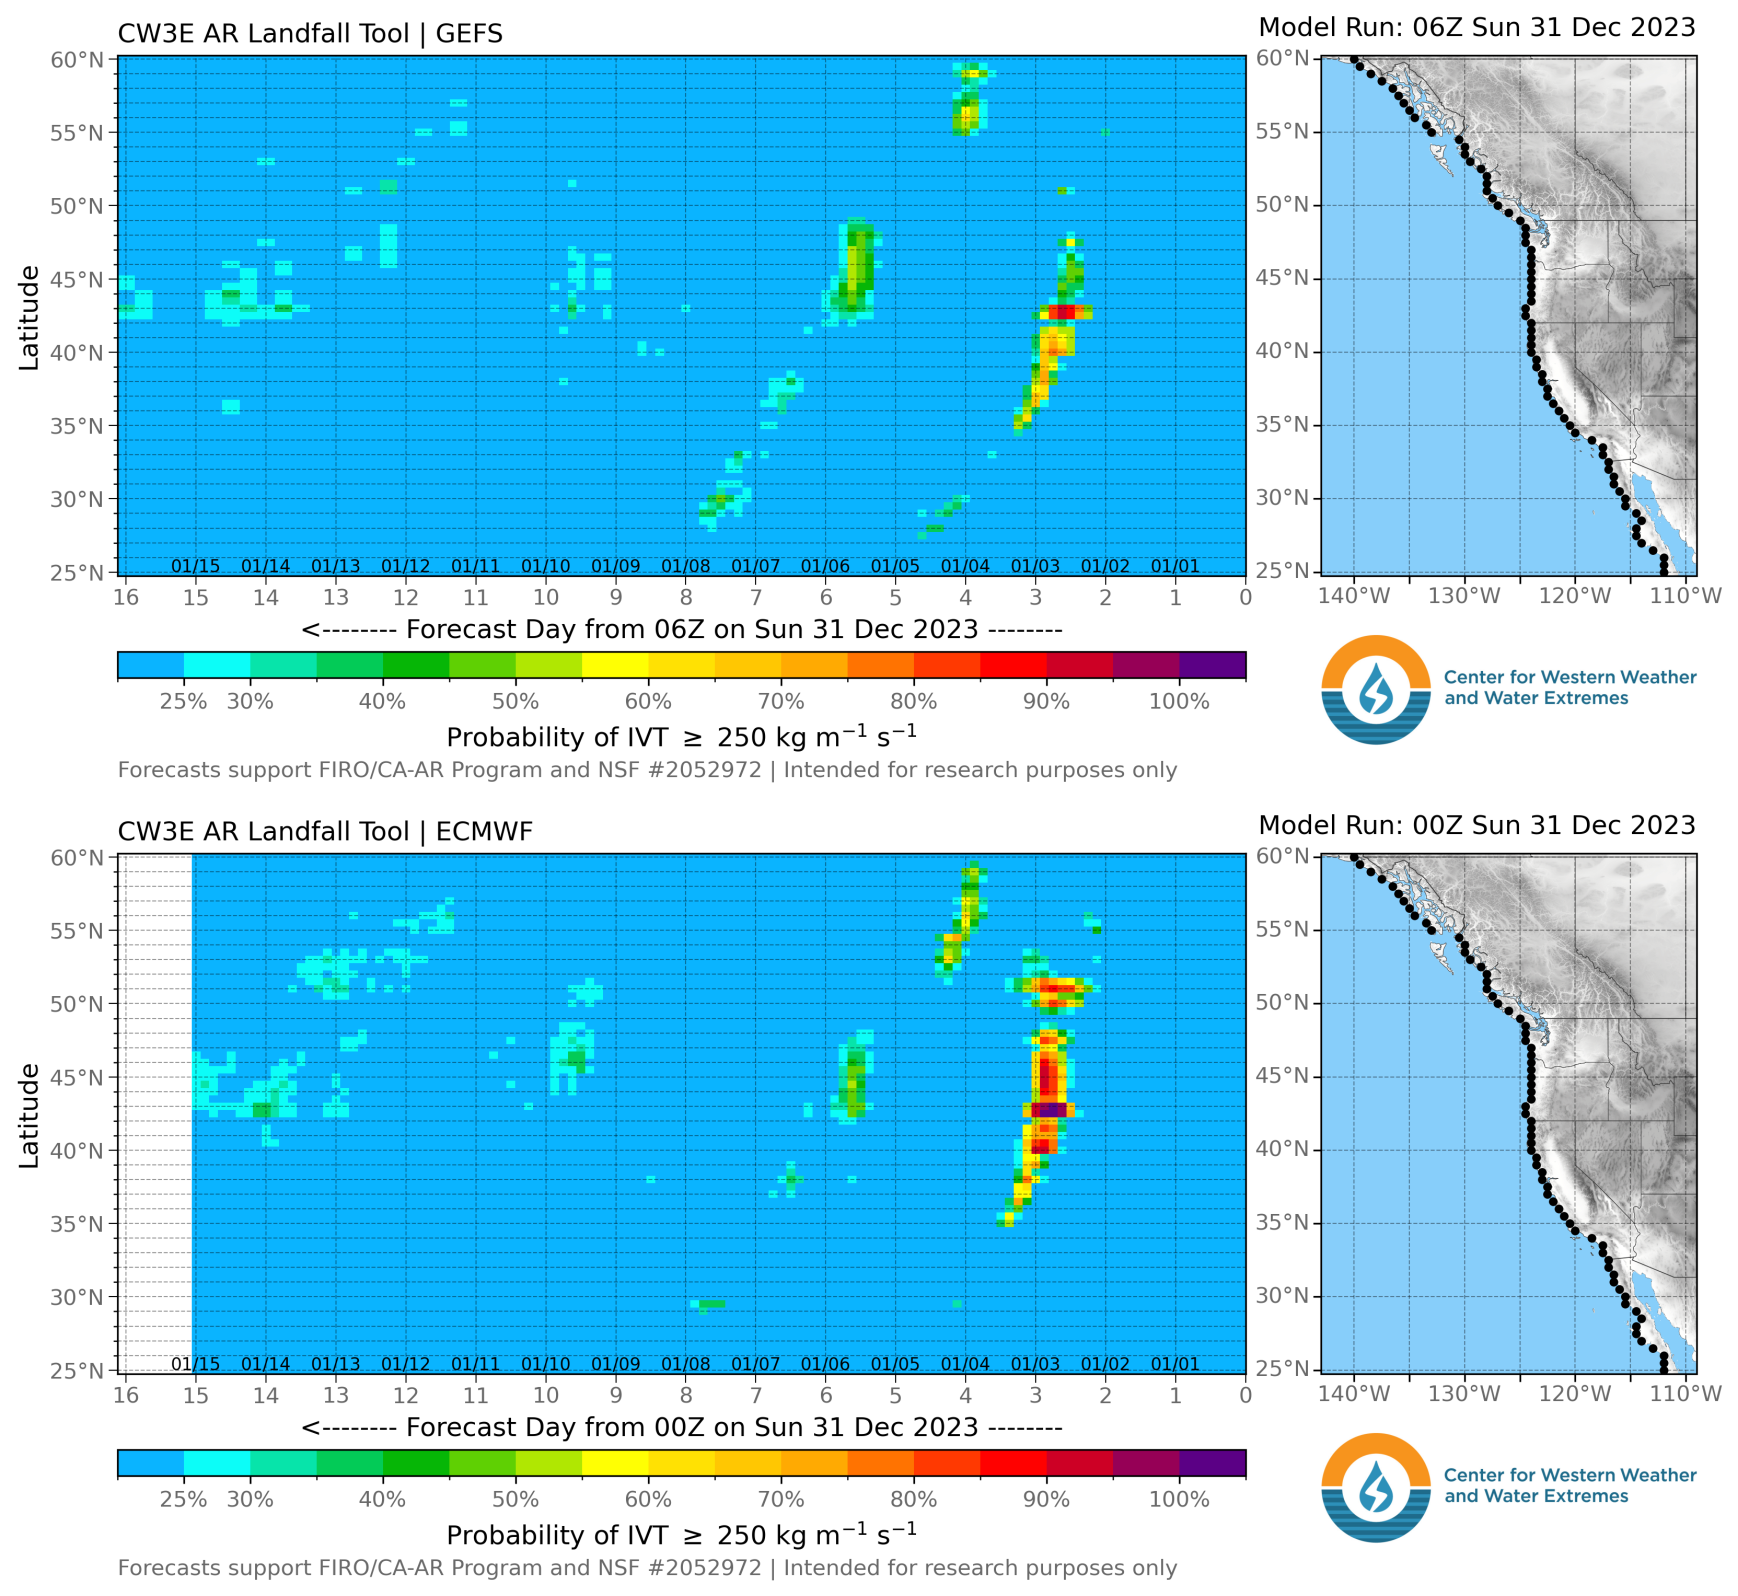
Looking ahead, NOAA Climate Prediction Center’s 8 to 14 day forecast is favoring above normal precipitation with cooler than normal temperatures for our region heading into mid-January (Figure 8). Somewhat less optimistic is the Center for Western Weather and Water Extremes’ (CW3E) AR Landfall Tool (Figure 9) which suggests limited atmospheric river activity for our region through mid-January based on American (top) and European (bottom) ensemble forecast products. CW3E uses integrated water vapor transport values greater than 250 kg/m/s to highlight probabilities of AR conditions. The plots are read right to left with the current day on the right and future forecast days advancing right to left. Beyond January 3rd, the higher probabilities are located across far northern California into the Pacific Northwest or across Baja California.
Figure 8: NOAA Climate Prediction Center Outlooks. Source and Source:
Figure 9: CW3E AR Landfall Tool. Source: