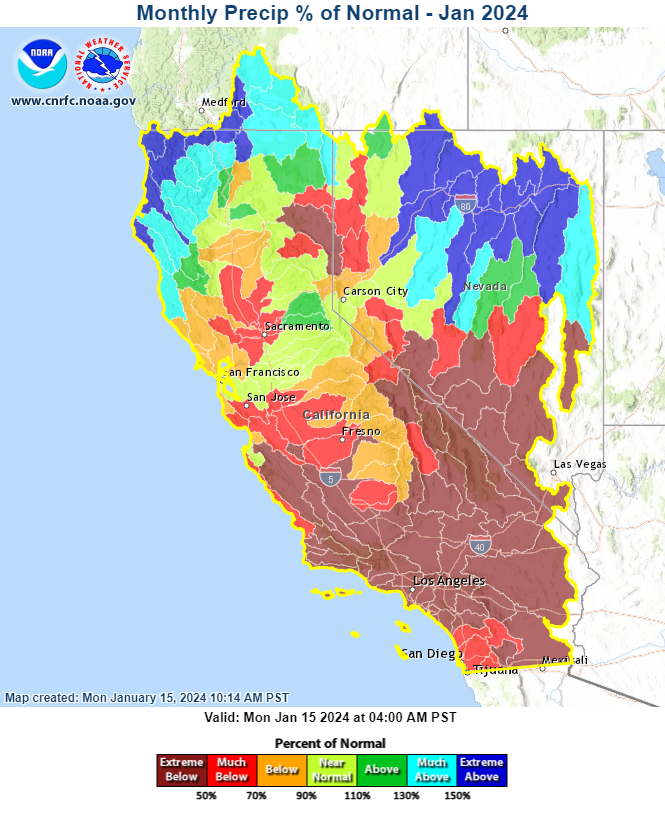
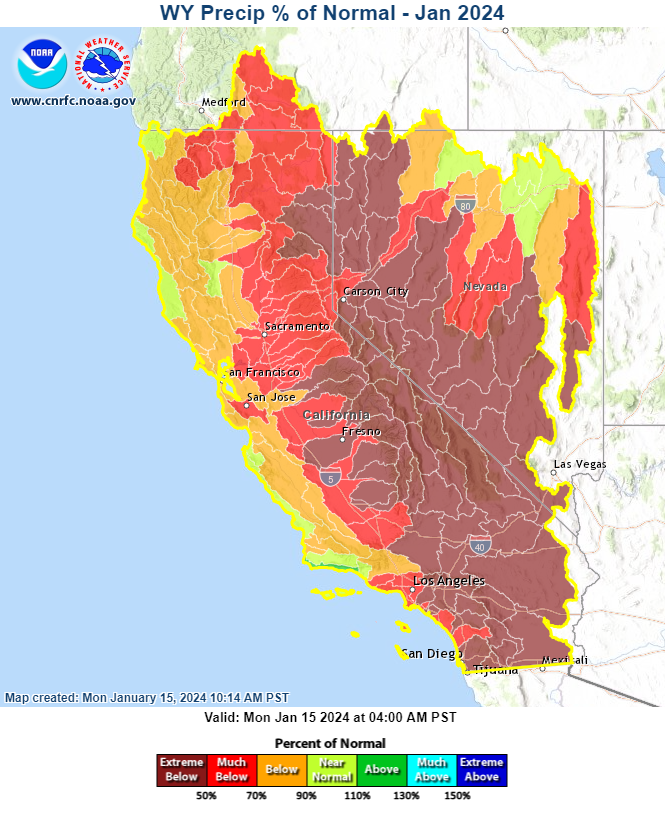
The first half of January has featured several mainly weak systems that brought rounds of generally light to moderate precipitation to the region. The exception was a stronger system that brought heavy precipitation to NW CA and lighter amounts to northern and central CA/NV January 13-14. As a result, month-to-date precipitation for January is well above average for NW CA and the Klamath basin as well as northern NV, near average for the northern half of the Sierra, and generally below normal elsewhere (Figure 1a). Looking at the percent of average precipitation for the water year to date (Figure 1b), however, near-normal conditions are generally confined to coastal basins, below-average precipitation elsewhere, most notably in the southern Sierra, southern CA, and western and southern NV.
Figure 1a (left) Month-to-date precipitation through January 15, 2024 at 4 AM PST. Source: CNRFC
Figure 1b (right) Water year-to-date precipitation through January 15, 2024 at 4 AM PST. Source: CNRFC
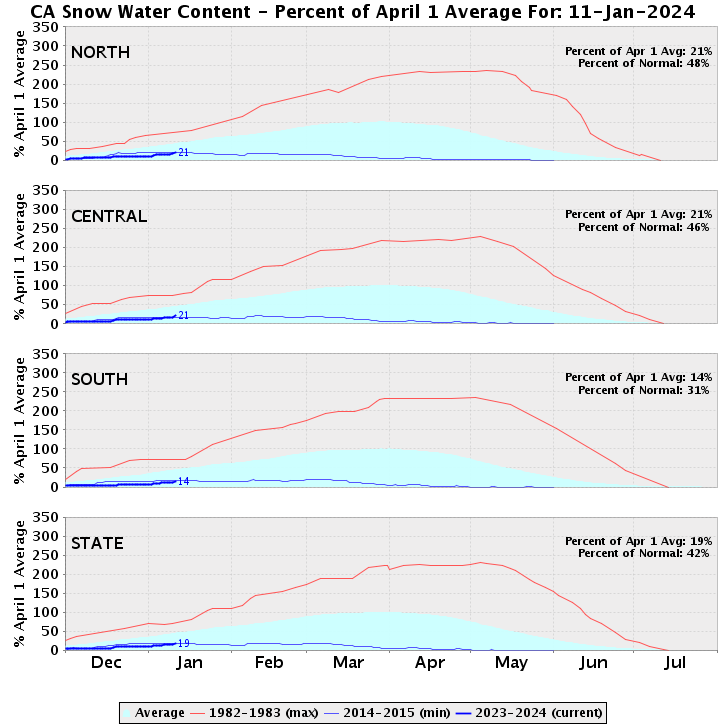
Similar to precipitation trends mentioned above, snow water content through January 11 shows lowest conditions (around 30% of average) in the southern Sierra, with closer to 50% of average in the central and northern portions of the Sierra. This graphic does not include changes from the January 13-14 storm.
Figure 2 CA snow water content by region. Source: CA Department of Water Resources
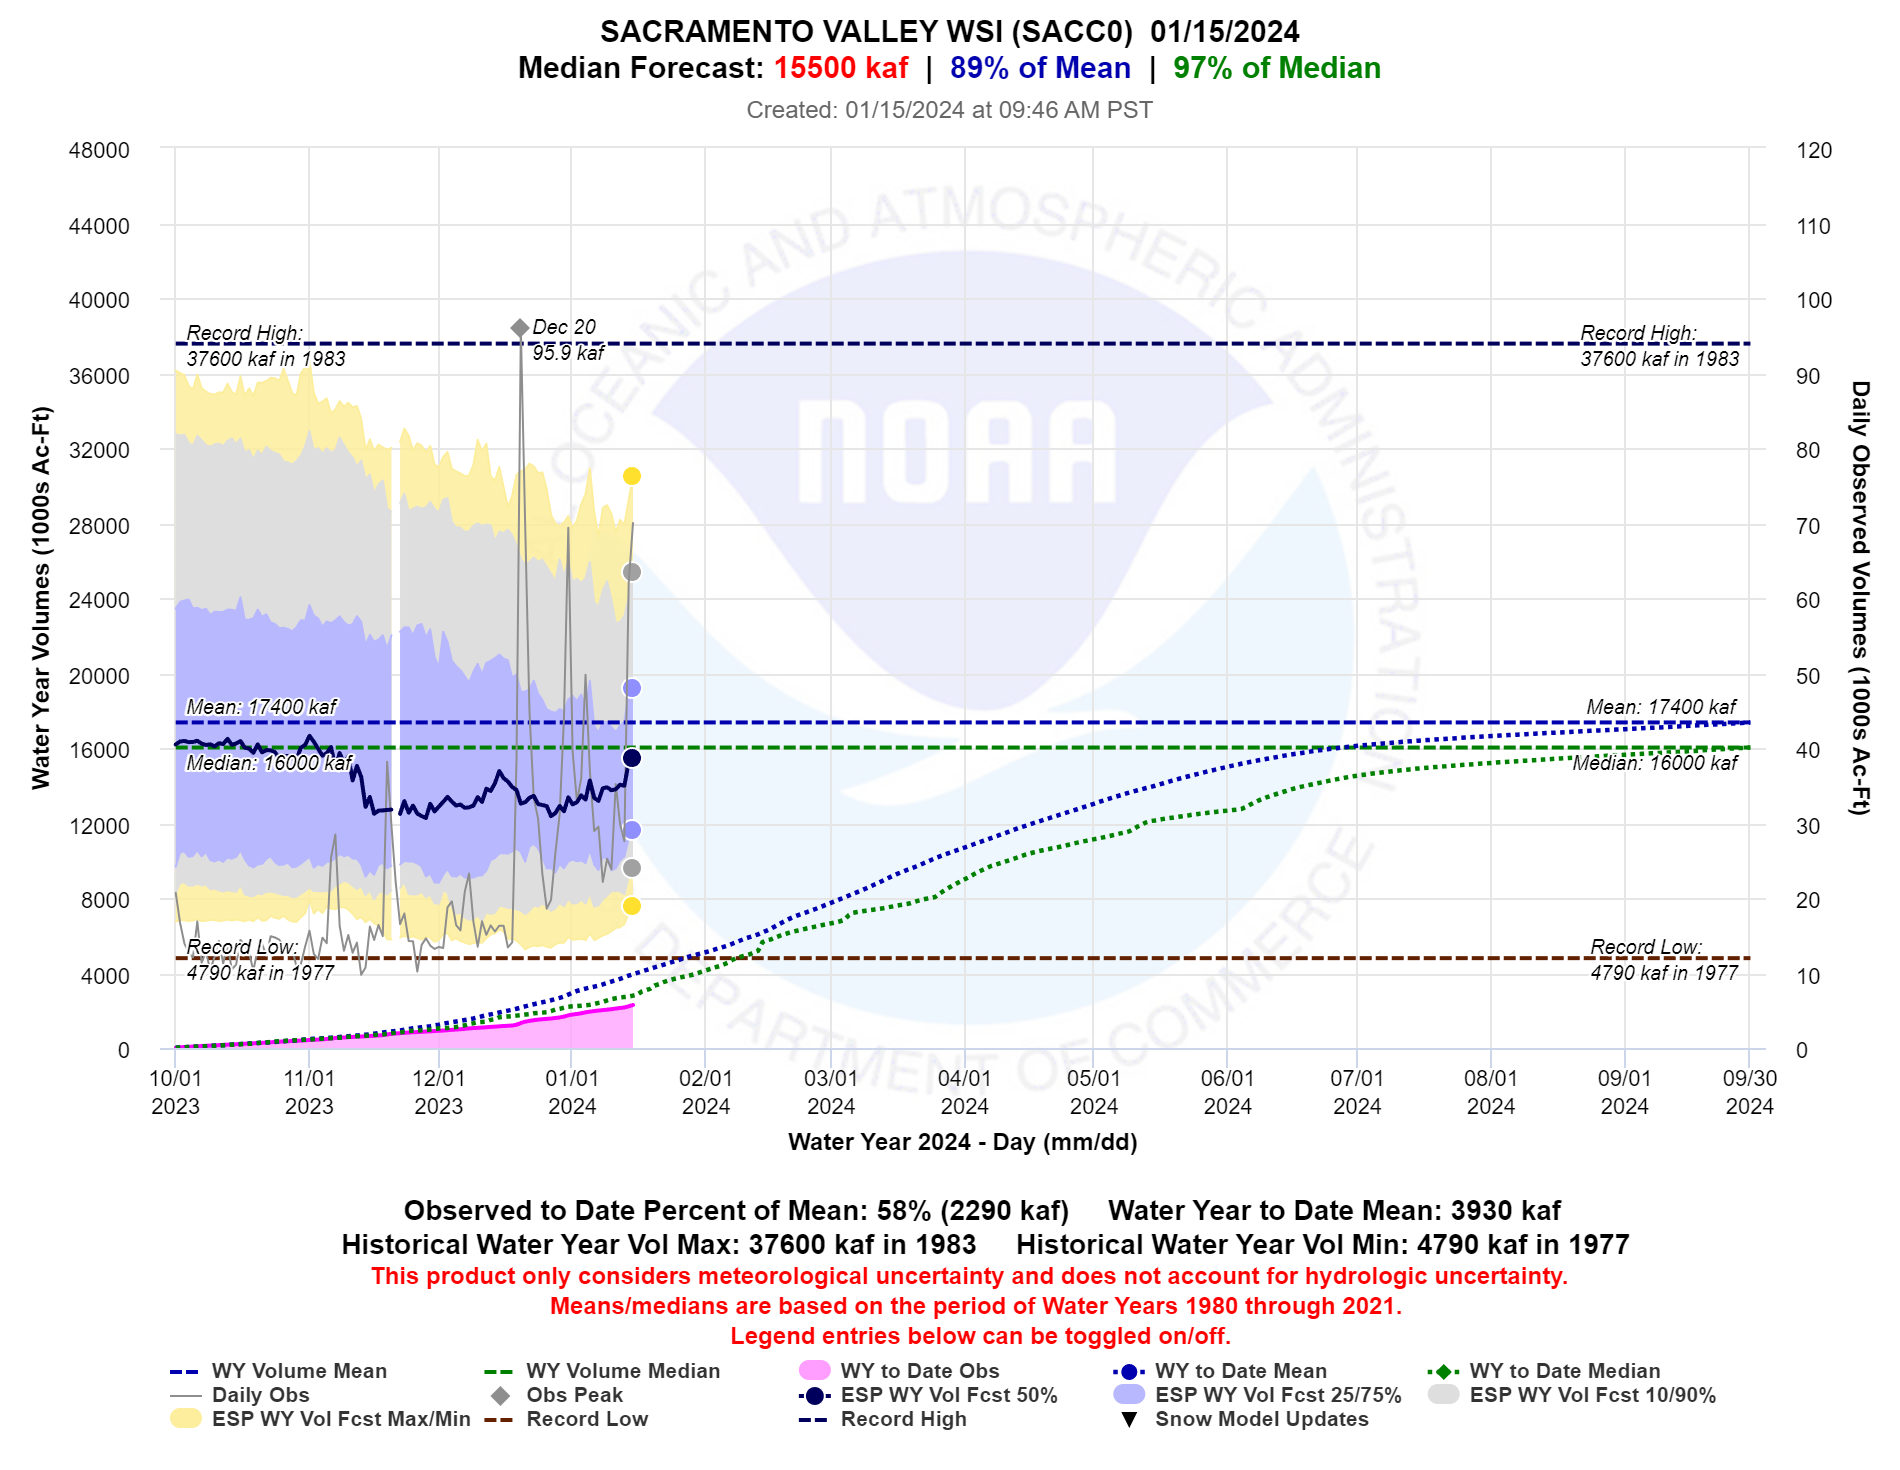
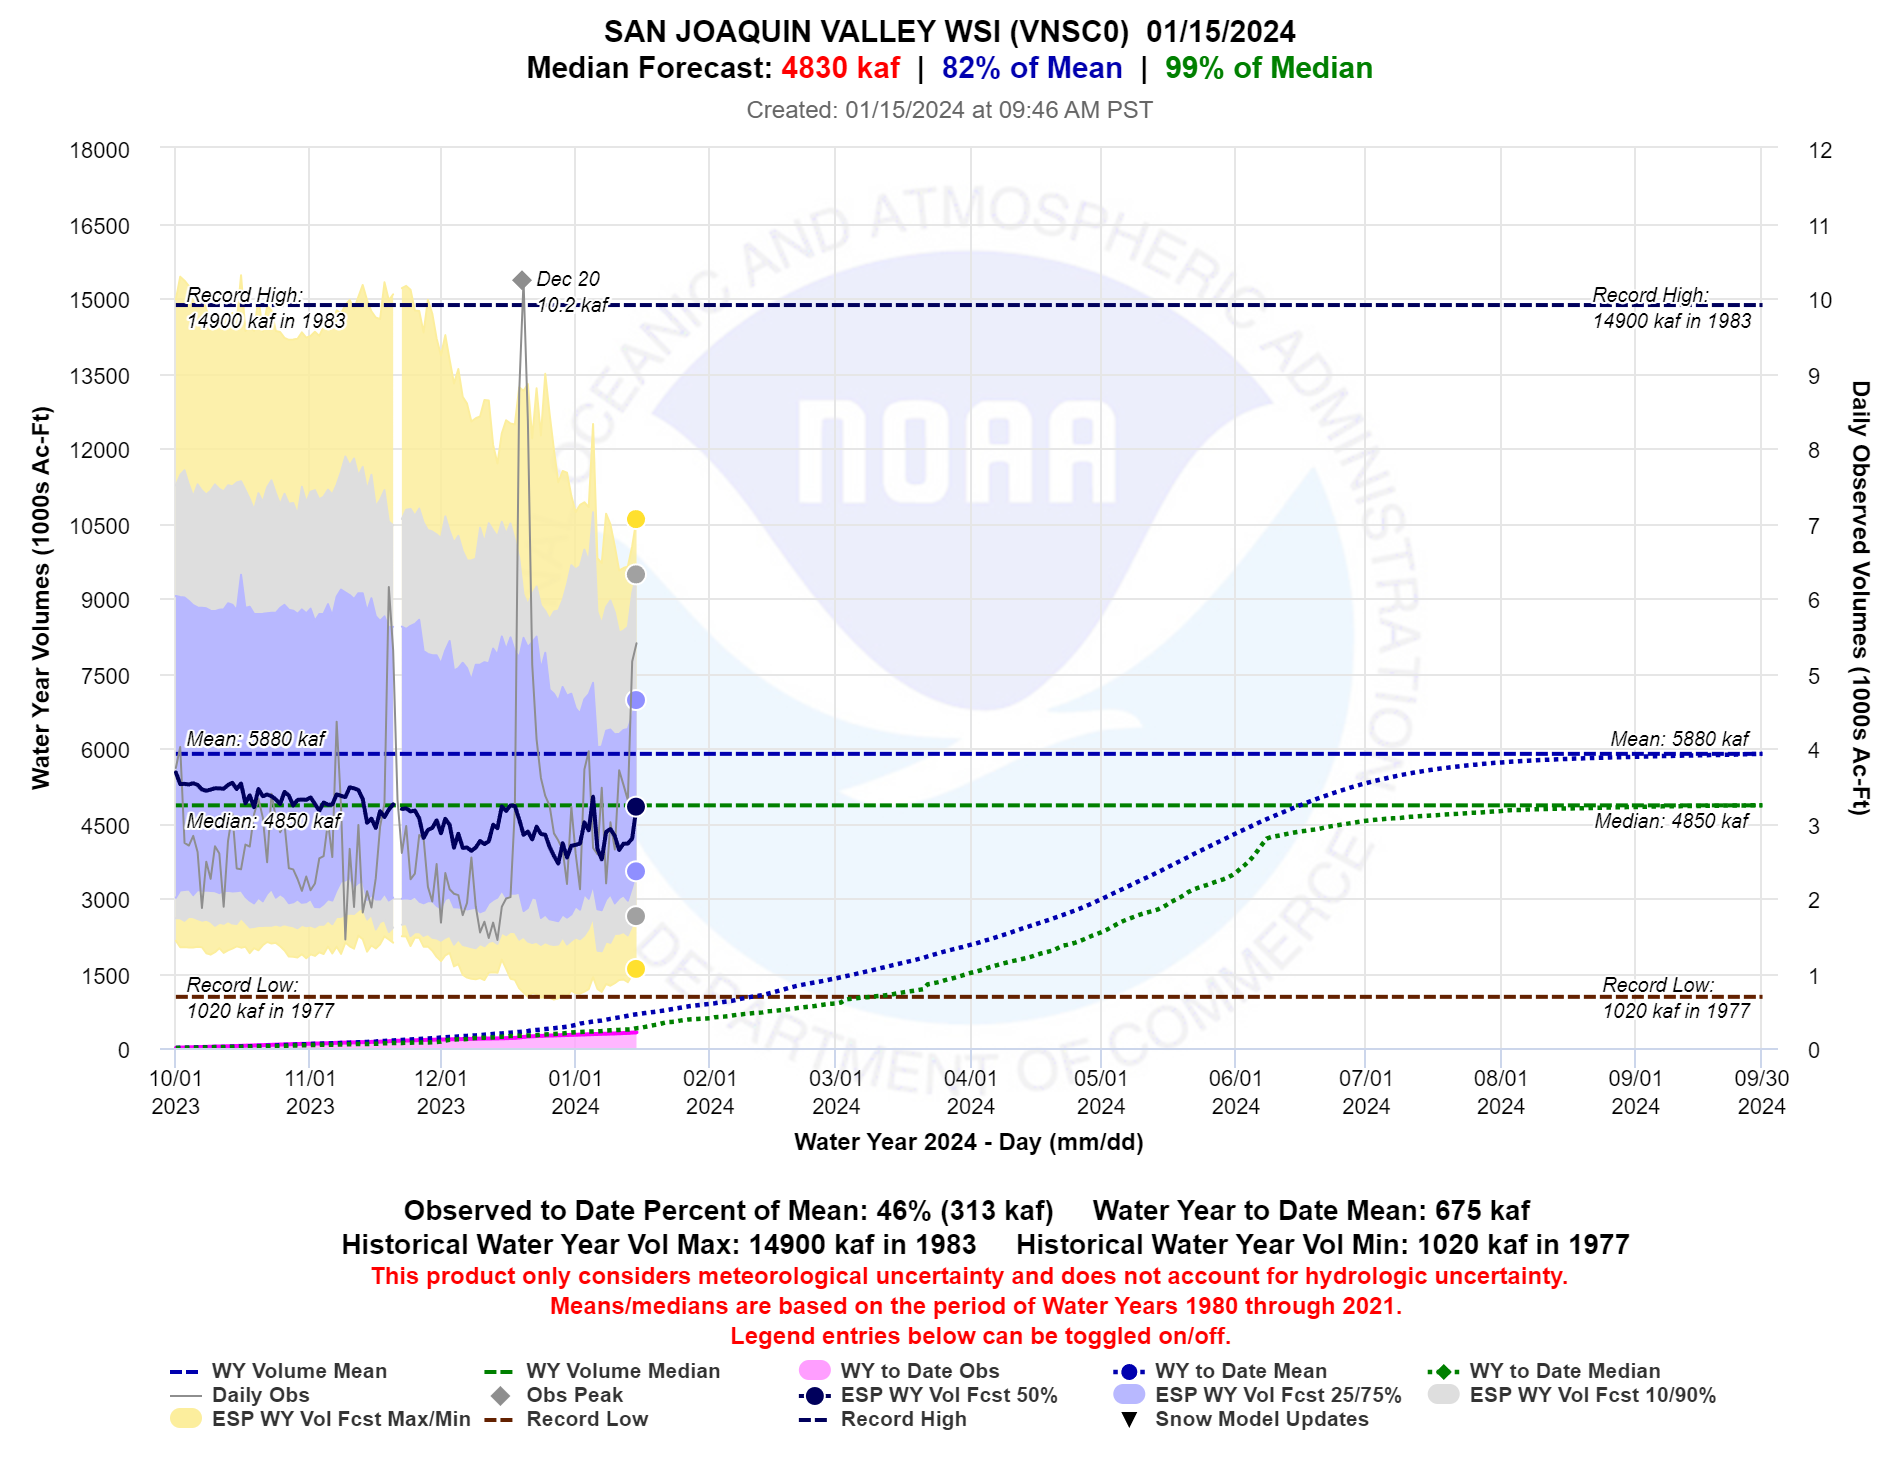
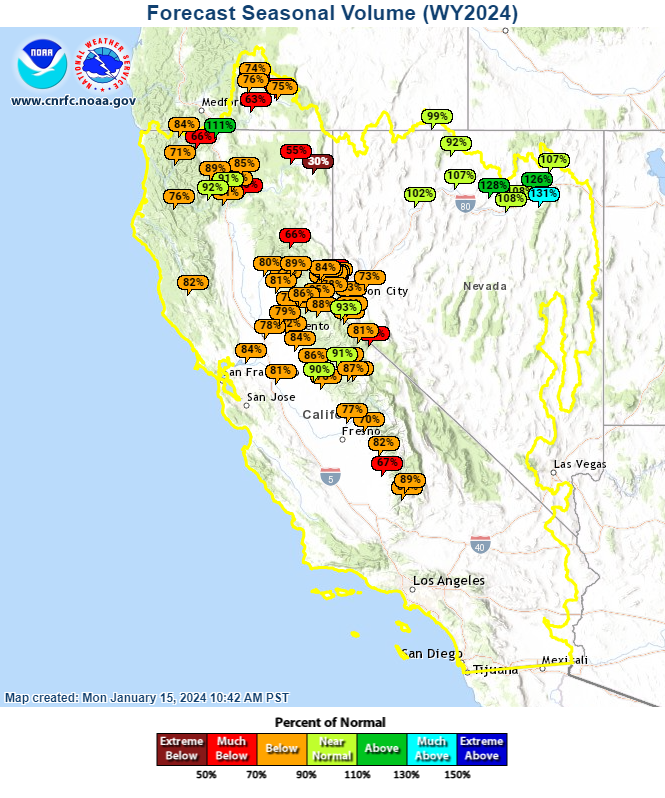
Trends in the water year forecasts for the Sacramento and San Joaquin Valley Water Resources Index locations are shown below in figures 3 and 4. The Sacramento Valley index has shown a bit of an increase over the first half of January, while little change has been noted for the San Joaquin index where less precipitation has fallen. April through July forecasts (not shown) have not changed significantly for either index over the past couple weeks. Most locations in the Sierra are forecast to receive around 80-90% of average for their respective seasonal (April through July for most locations) averages (figure 5).
Figure 3 Water year forecast trends for the Sacramento Valley Water Supply Index. Source: CNRFC
Figure 4 Water year forecast trends for the San Joaquin Valley Water Supply Index. Source: CNRFC
Figure 5 Seasonal (generally April through July) runoff forecasts. Source: CNRFC
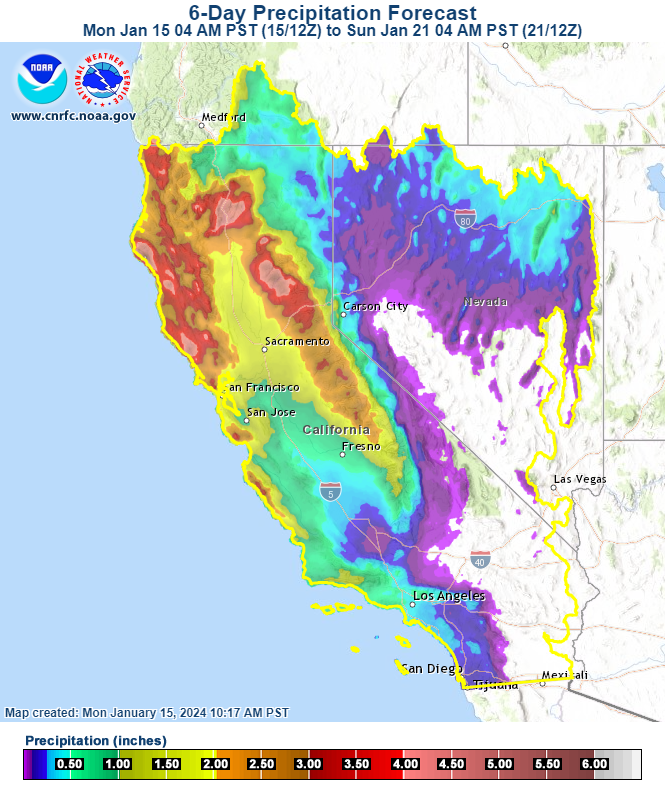
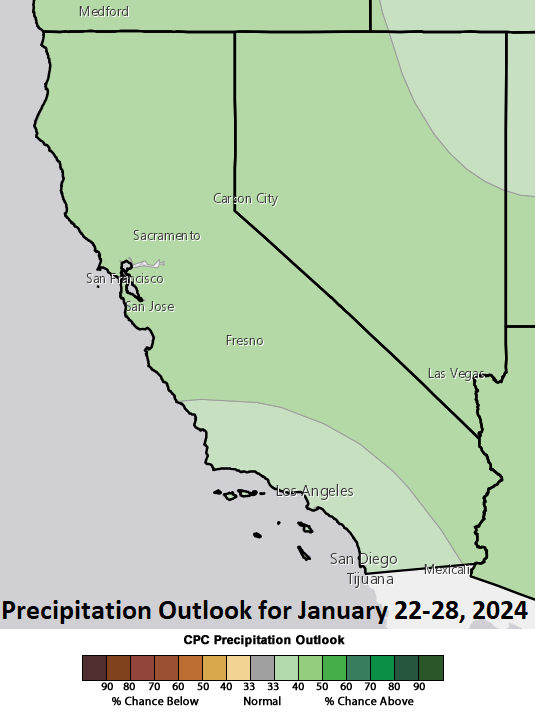
Forecasts show additional precipitation this week, with highest amounts in northern CA (figure 6a). Longer-range outlooks slightly favor above average precipitation for the January 22-28 period (figure 6b) as well as above-normal temperatures (not shown).
Figure 6a (left) 6-day precipitation forecast Source: CNRFC
Figure 6b (right) 8- to 14-day precipitation outlook. Source: Climate Prediction Center (graphic from CNRFC web site)