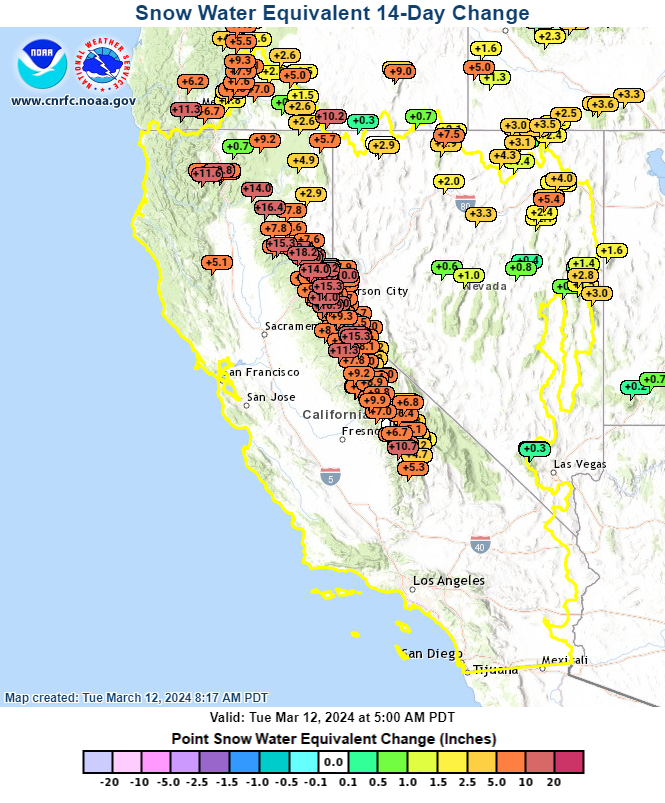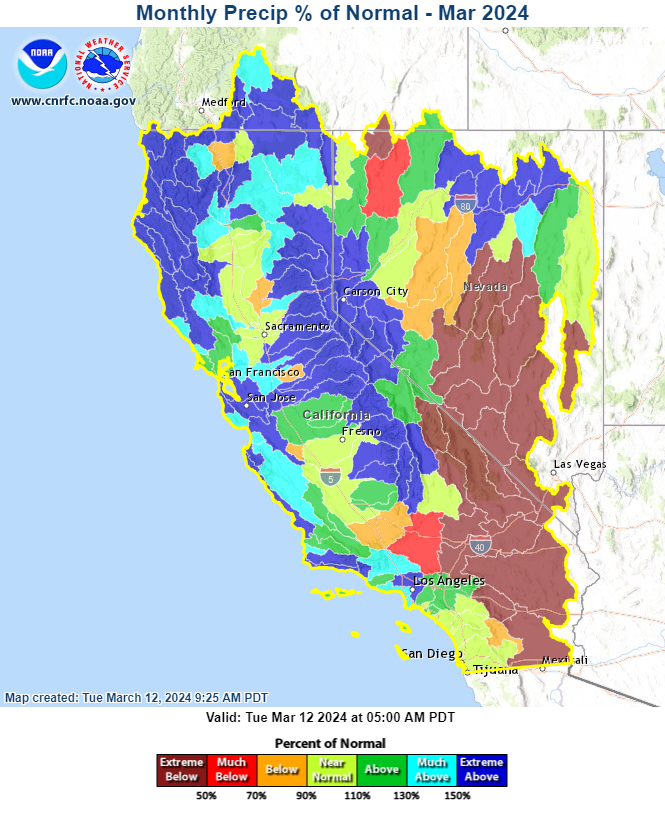
The winter storm that occurred between March 1 to 4 contributed a great amount of precipitation across the region, resulting in well-above normal March-to-date precipitation (Fig. 1). In terms of the Sierra Nevada snowpack, SNOTEL stations observed around 5-15 inches of SWE increase along various elevations for the past 14 days. (Fig. 2)
Fig. 1 March-to-date precipitation percent normal through Mar 12, 2024 at 5:00 AM PDT (Source: CNRFC)
Fig. 2 SWE 14-day change (Feb 27 - Mar 12) observed from SNOTEL stations (Source: CNRFC)
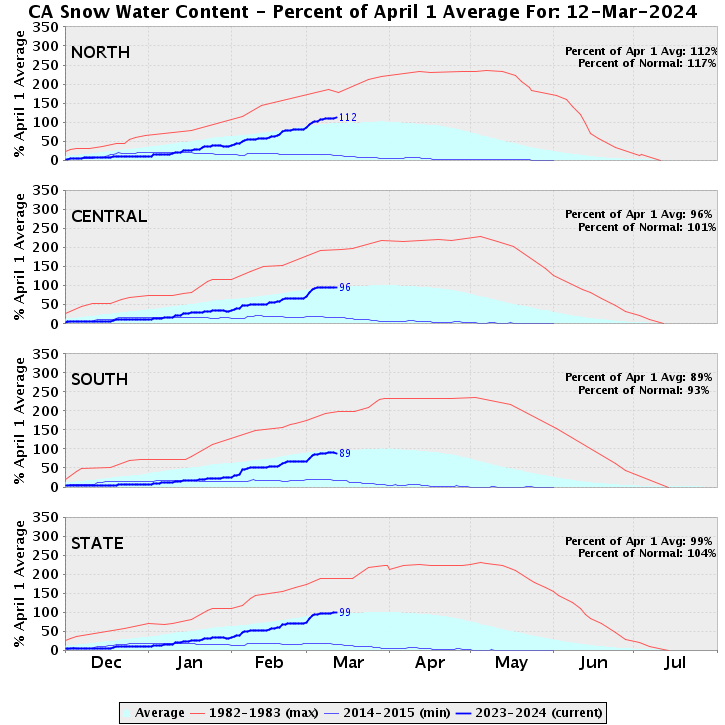
California state-wide snow water content is currently at 104% normal as of March 12, with 117% normal in the Northern Sierra, 101% normal in the Central Sierra, and 93 % in the southern Sierra (Fig. 3). The recent March 1 winter storm contributed to 17-25% increase across the Sierra, brining Northern, Central Sierra SWE and state-wide to above normal SWE conditions.
Fig. 3 California snow water content by region (Source: California Department of Water Resources)
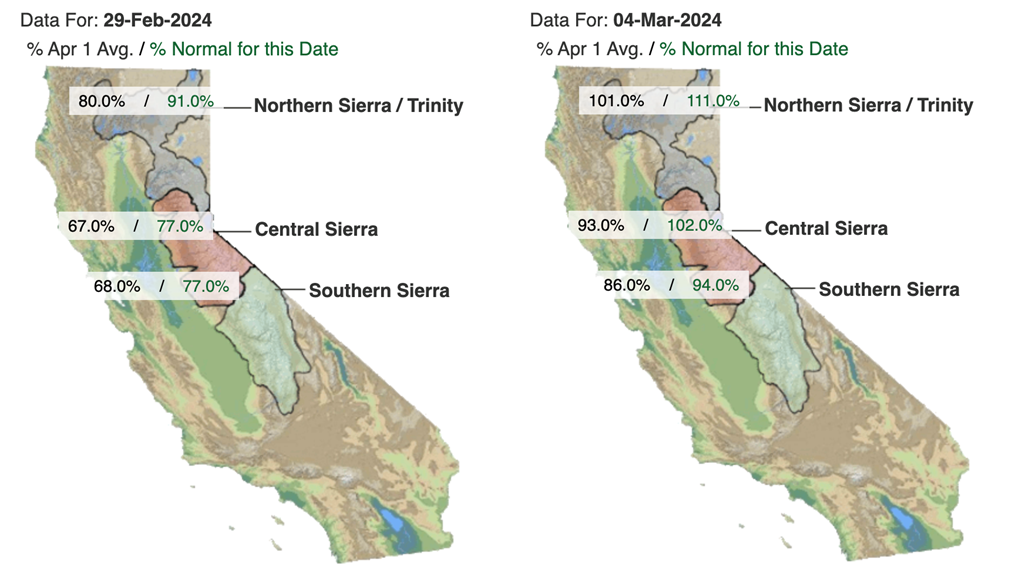
Fig. 4 California SWE percent normal change from Feb 29 (left) to Mar 4 (right) (Source: California Department of Water Resources)
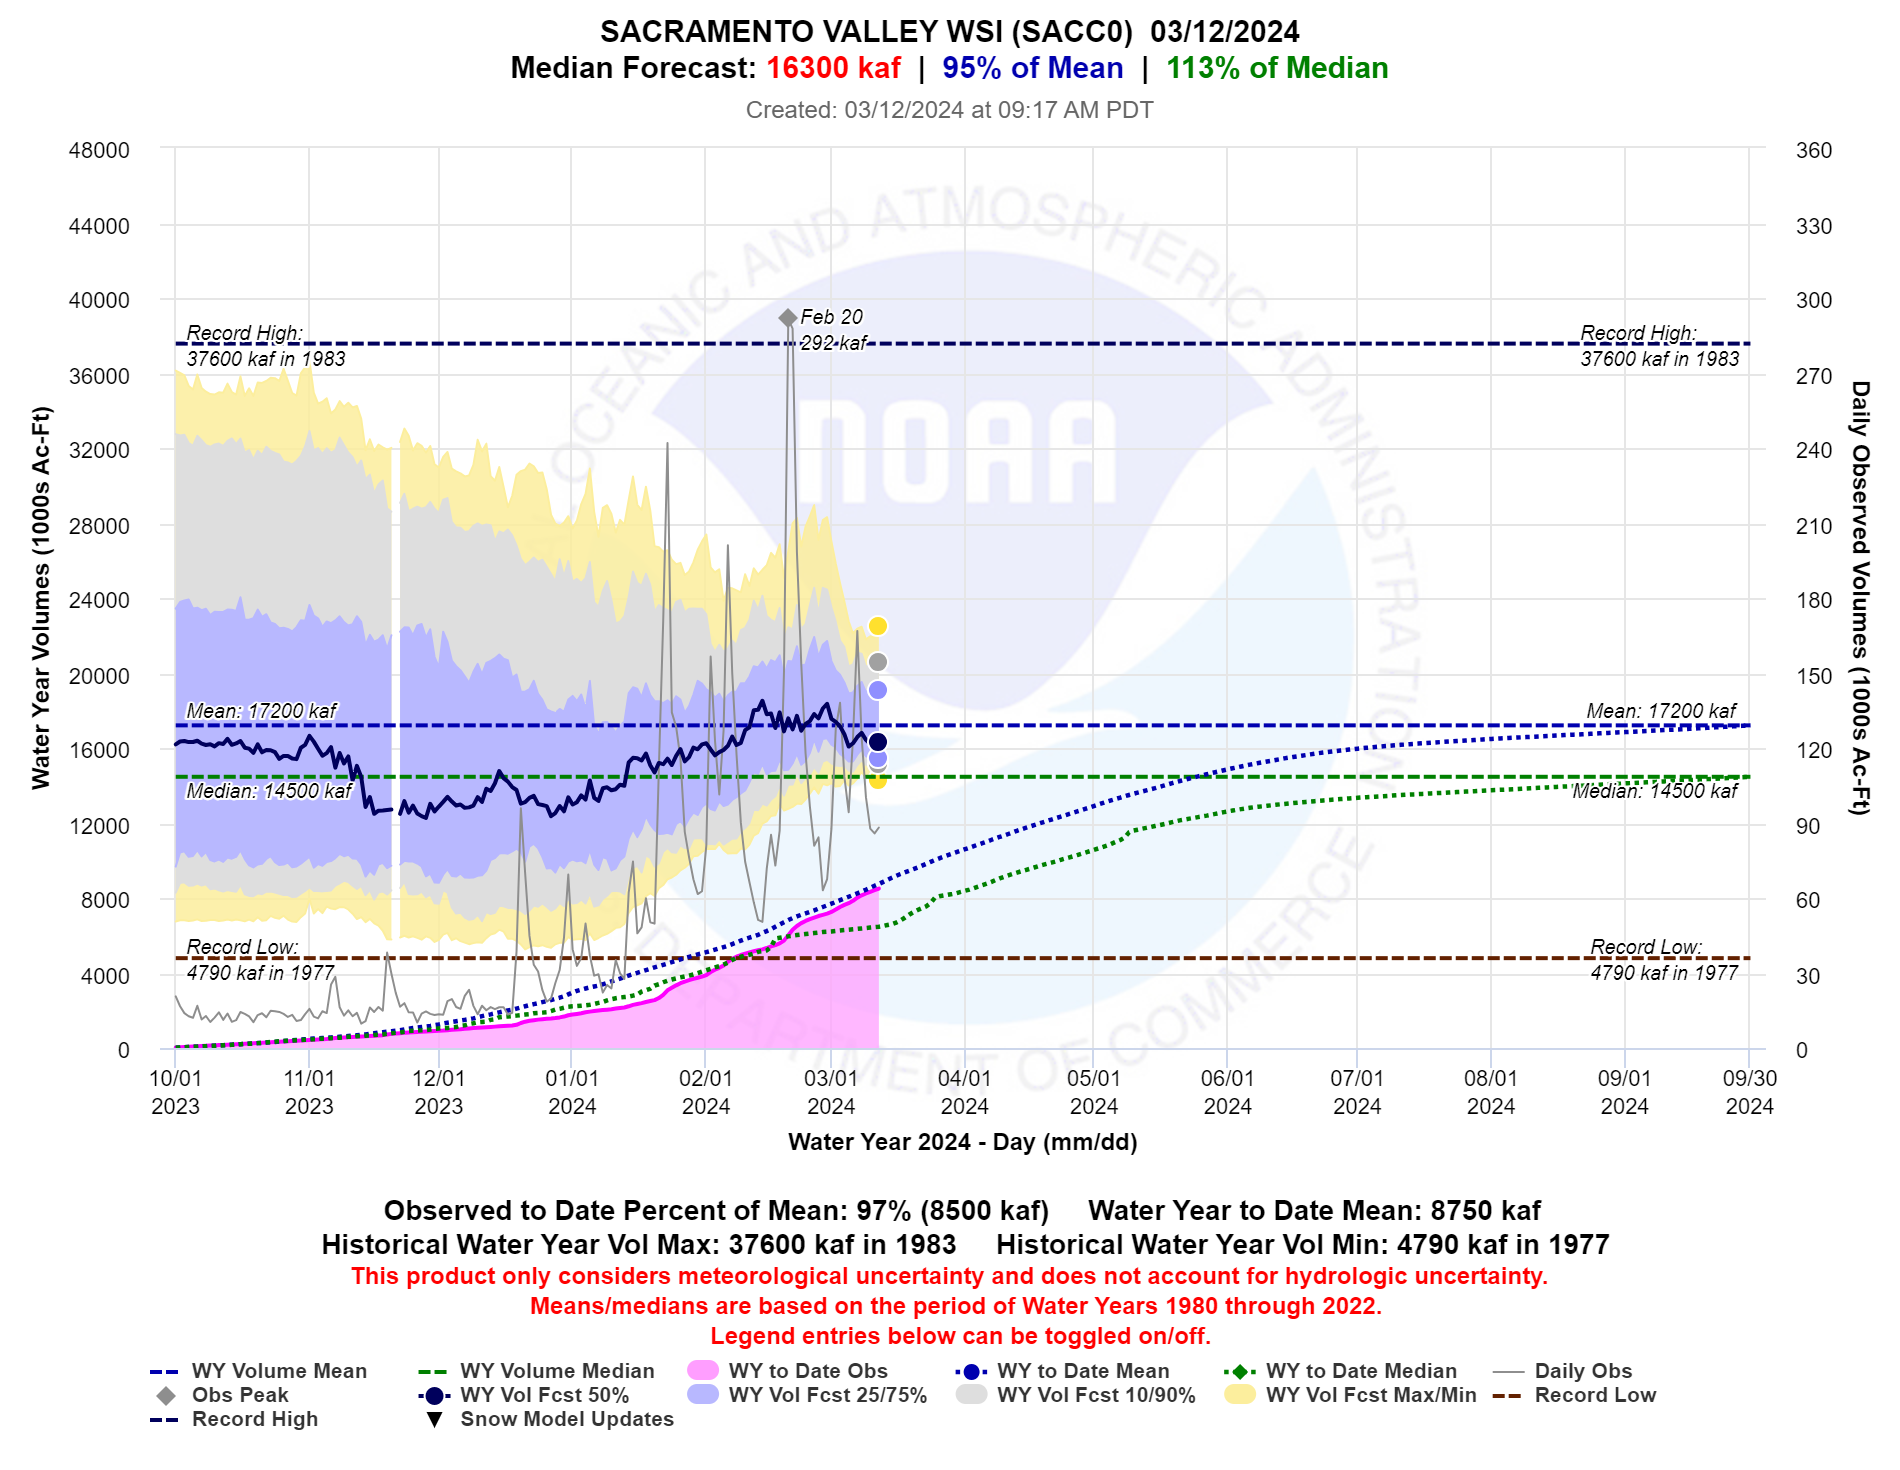
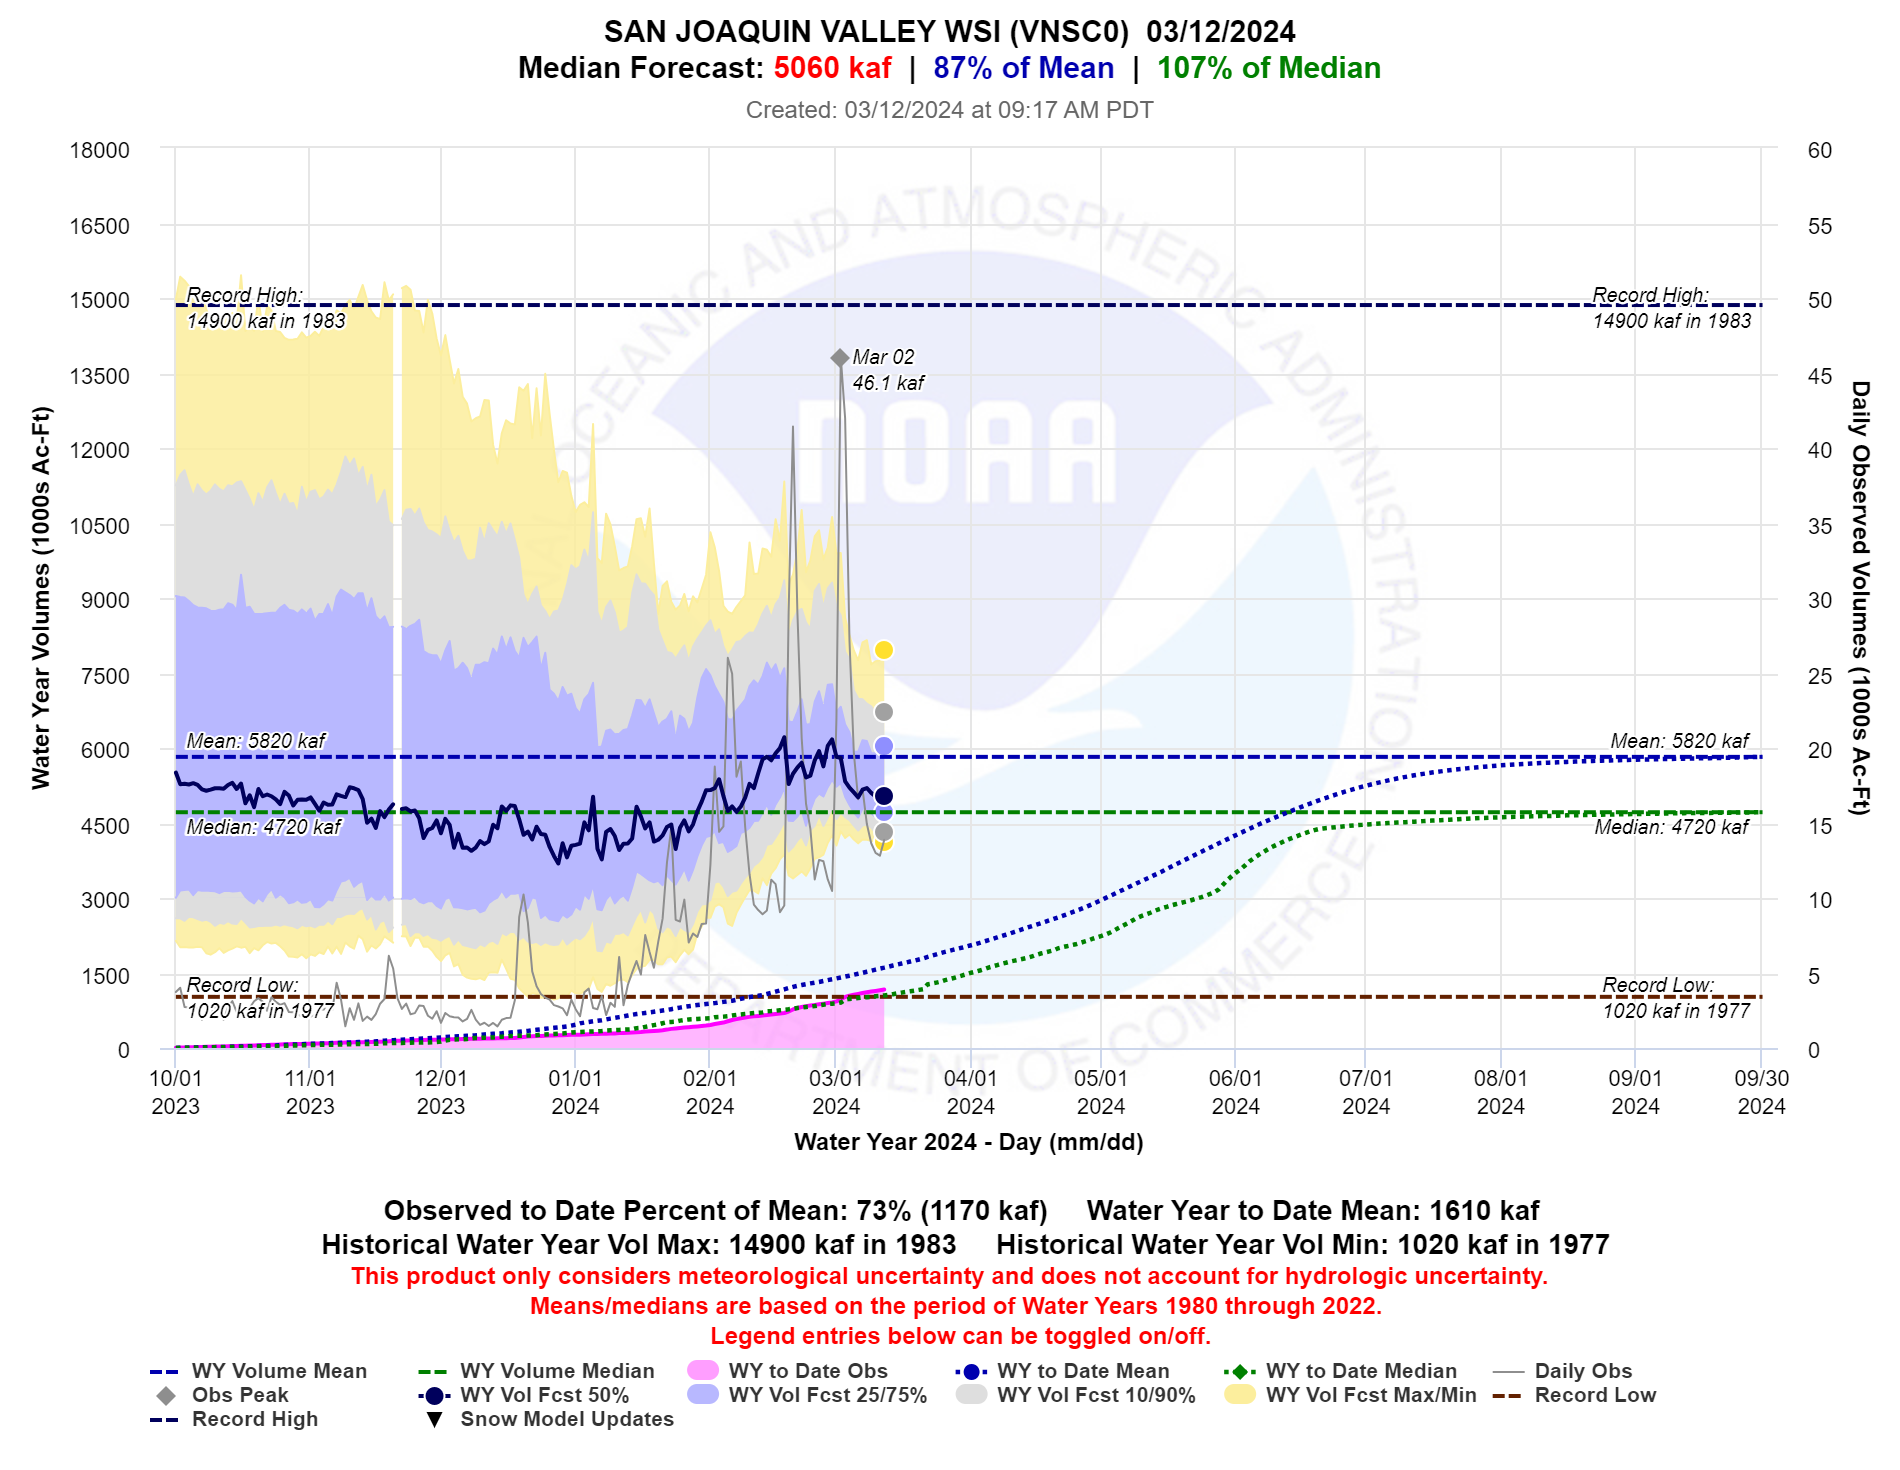
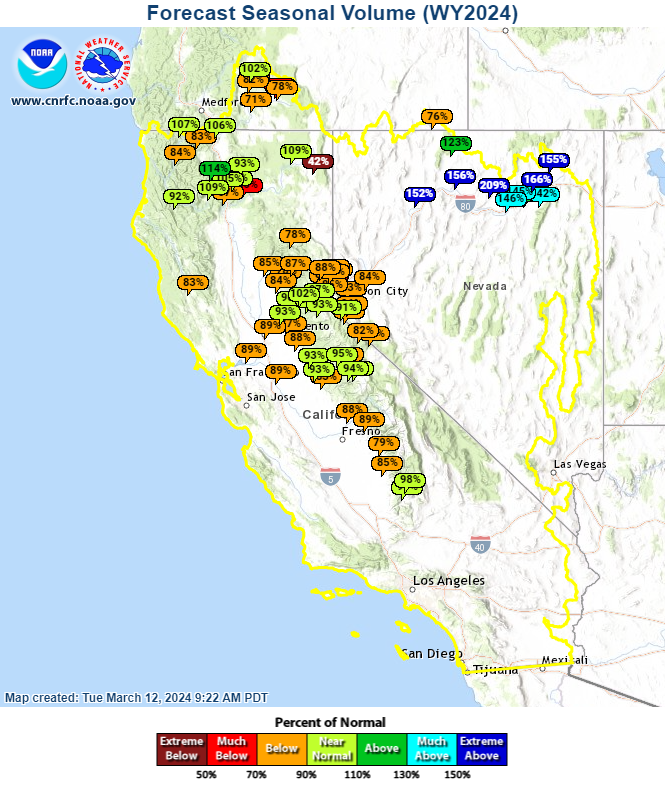
The water year forecasts for Sacramento Valley and San Joaquin Water Supply Indices are currently at 95% and 87% normal, respectively (Fig 5 and 6). Noticeably, both indices were above 100% normal at the end of February, but have dropped to some extent since then, and continued to have slightly downward trends due to (1) QPF amount did not verify for Mar 1 winter storm, (2) Dry forecast condition in the near-term weather and (3) Recent warm-up trend picked up by HEFS, resulting in increased early snowmelt. In terms of seasonal volume (cumulative volume from April to July) forecast, the majority of water supply locations are currently at 90% normal, with few locations in Northern California having near or slightly above 100% normal (Fig. 7).
Fig. 5 Water year forecast trend Sacramento Valley Water Supply Index (Source: CNRFC)
Fig. 6 Water year forecast trend for San Joaquin Valley Water Supply Index (Source: CNRFC)
Fig . 7 Seasonal volume water supply forecast percent of normal (Source: CNRFC)
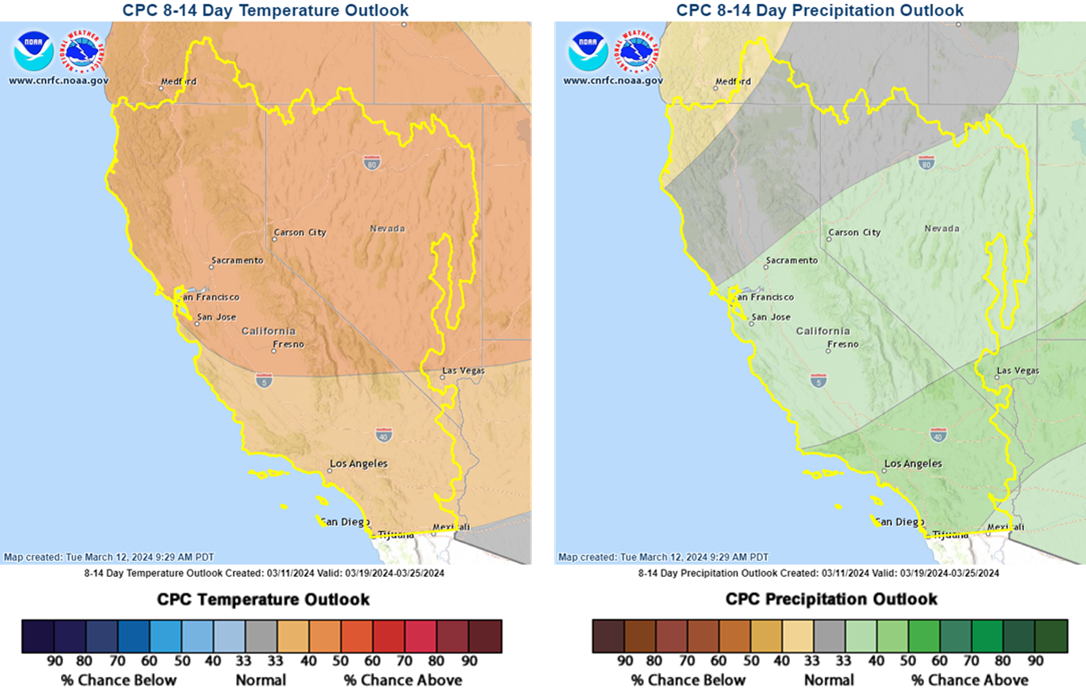
Longer-range outlooks issued on March 11 by Climate Prediction Center (CPC) favor above average temperature and near or slightly above average precipitation for the March 19-25 period (Fig. 8).
Fig. 8 CPC 6-10 day temperature (left) and precipitation (right) outlook (Source: CPC)
The contribution of precipitation and SWE from the March 1 winter storm brought water conditions to near normal or above normal across the CNRFC service area. Moving forward, the recent warm-up trends may slightly reduce the forecast seasonal volume with early melts, and near normal precipitation forecast later in the month may hold the snowpack and seasonal water supply forecasts to their current levels.
CNRFC