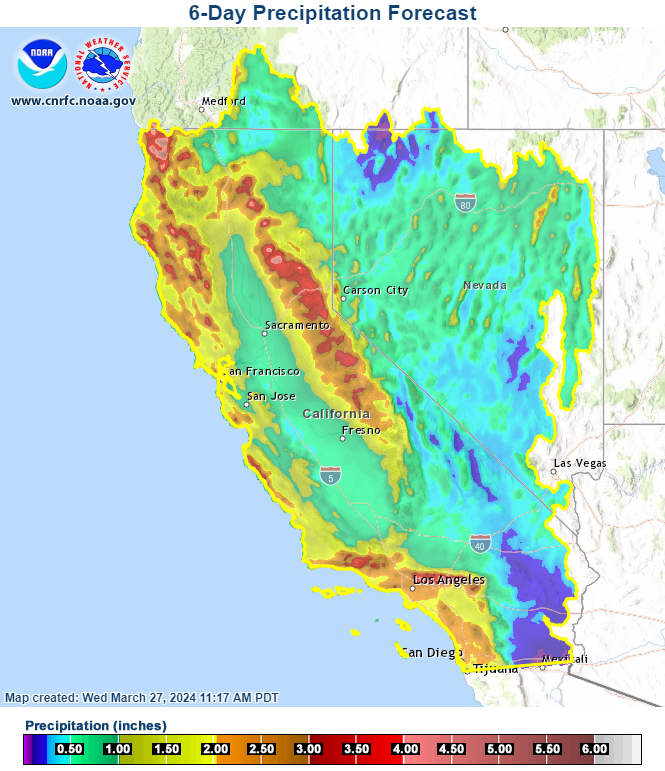
After a lull in precipitation across the region after the big snow storm in early March, the last 10 days of the month are shaping up to be on the wet side. A storm system moved across the area last weekend that brought several inches of liquid equivalent precipitation to the Sierra and areas along the north coast. Another round of storm systems will begin to impact the region today. Precipitation totals through this weekend are expected to be similar to last weekend in many areas of northern California, but higher totals are expected across the southern half of California and across Nevada. The 6-day forecast precipitation total from the CNRFC is shown in Figure 1.
Figure 1: 6-day precipitation forecast. Source: CNRFC
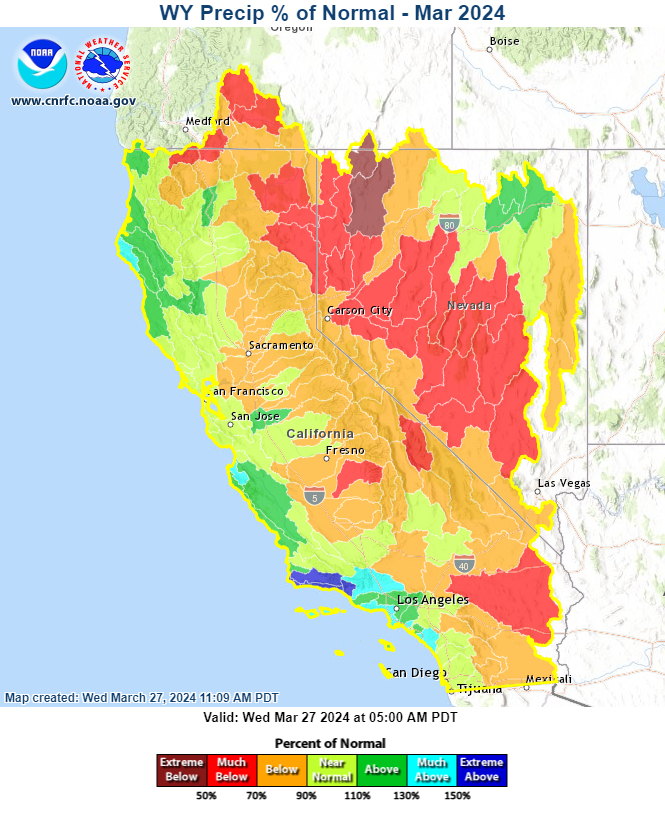
With most of the wet season now behind us, we have a pretty good sense of how the water year (WY) precipitation and snowpack will play out. The WY precipitation map in Figure 2 shows that much of the region is currently near or just below normal. Areas along the coast have received the brunt of the storms this year, with many of those watersheds above 100% of average. Areas of northern Nevada have also been wetter than average, while areas south of I-80 have been drier.
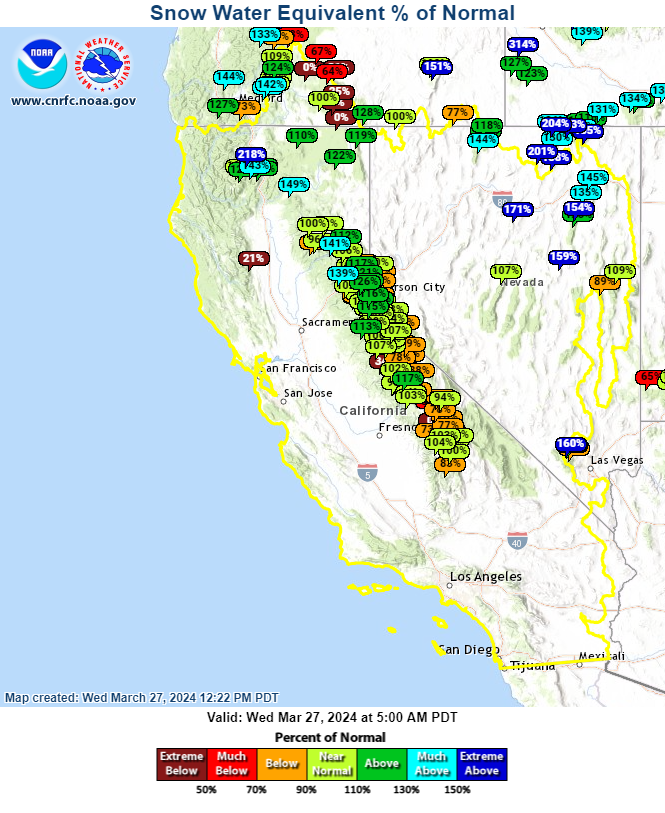
The current snowpack paints a more optimistic picture of the current water supply conditions than the precipitation map. With so much of the precipitation falling in the form of snow across the region this WY, the snowpack reported by many snow pillows is above average for this date. As of today, the California Department of Water resources estimates the state-wide snowpack at 101% of normal and 101% of the April 1st average. With more snow on the way the next several days, these numbers will increase as we close out the month of March. Some lower elevations (5-6,000ft) have already surpassed peak snow for the year as a result of the melt that occurred last week,, but higher elevations will likely reach peak snowpack volume this weekend.
Figure 2: To-date percent of average precipitation. Source: CNRFC
Figure 3: To-date percent of average snowpack. Source: CNRFC
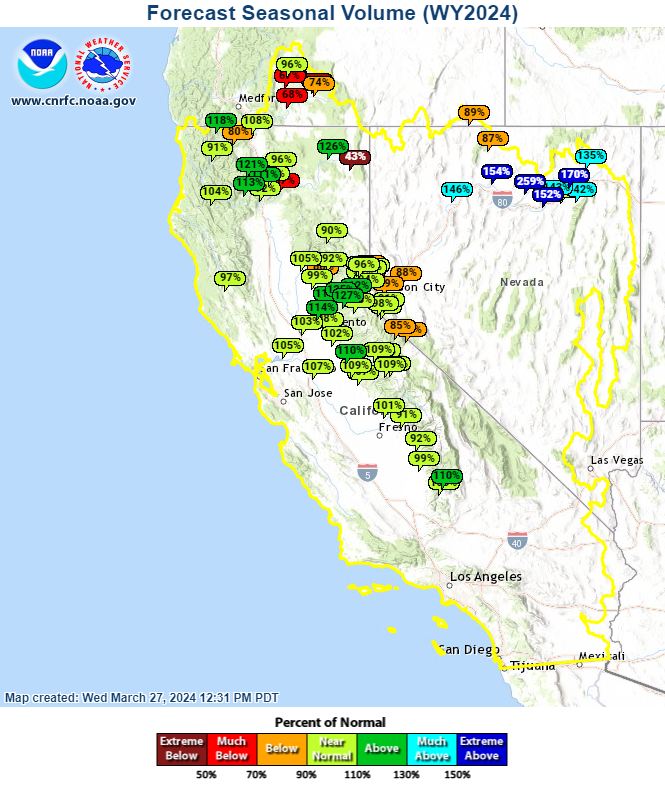
Water supply conditions are looking great across the region, especially with lots of carryover water supply coming off the heels of the big 2023 WY. Figure 4 shows the seasonal runoff forecasts from the CNRFC are most likely to be in the 100-120% of average range. Conditions are expected to be a bit wetter across northern Nevada, where the Humboldt River and tributaries are expected to have well above average seasonal runoff. Baseflow is a big component to the runoff in this watershed, which has been maintained throughout the water year by low elevation rain and snowmelt.
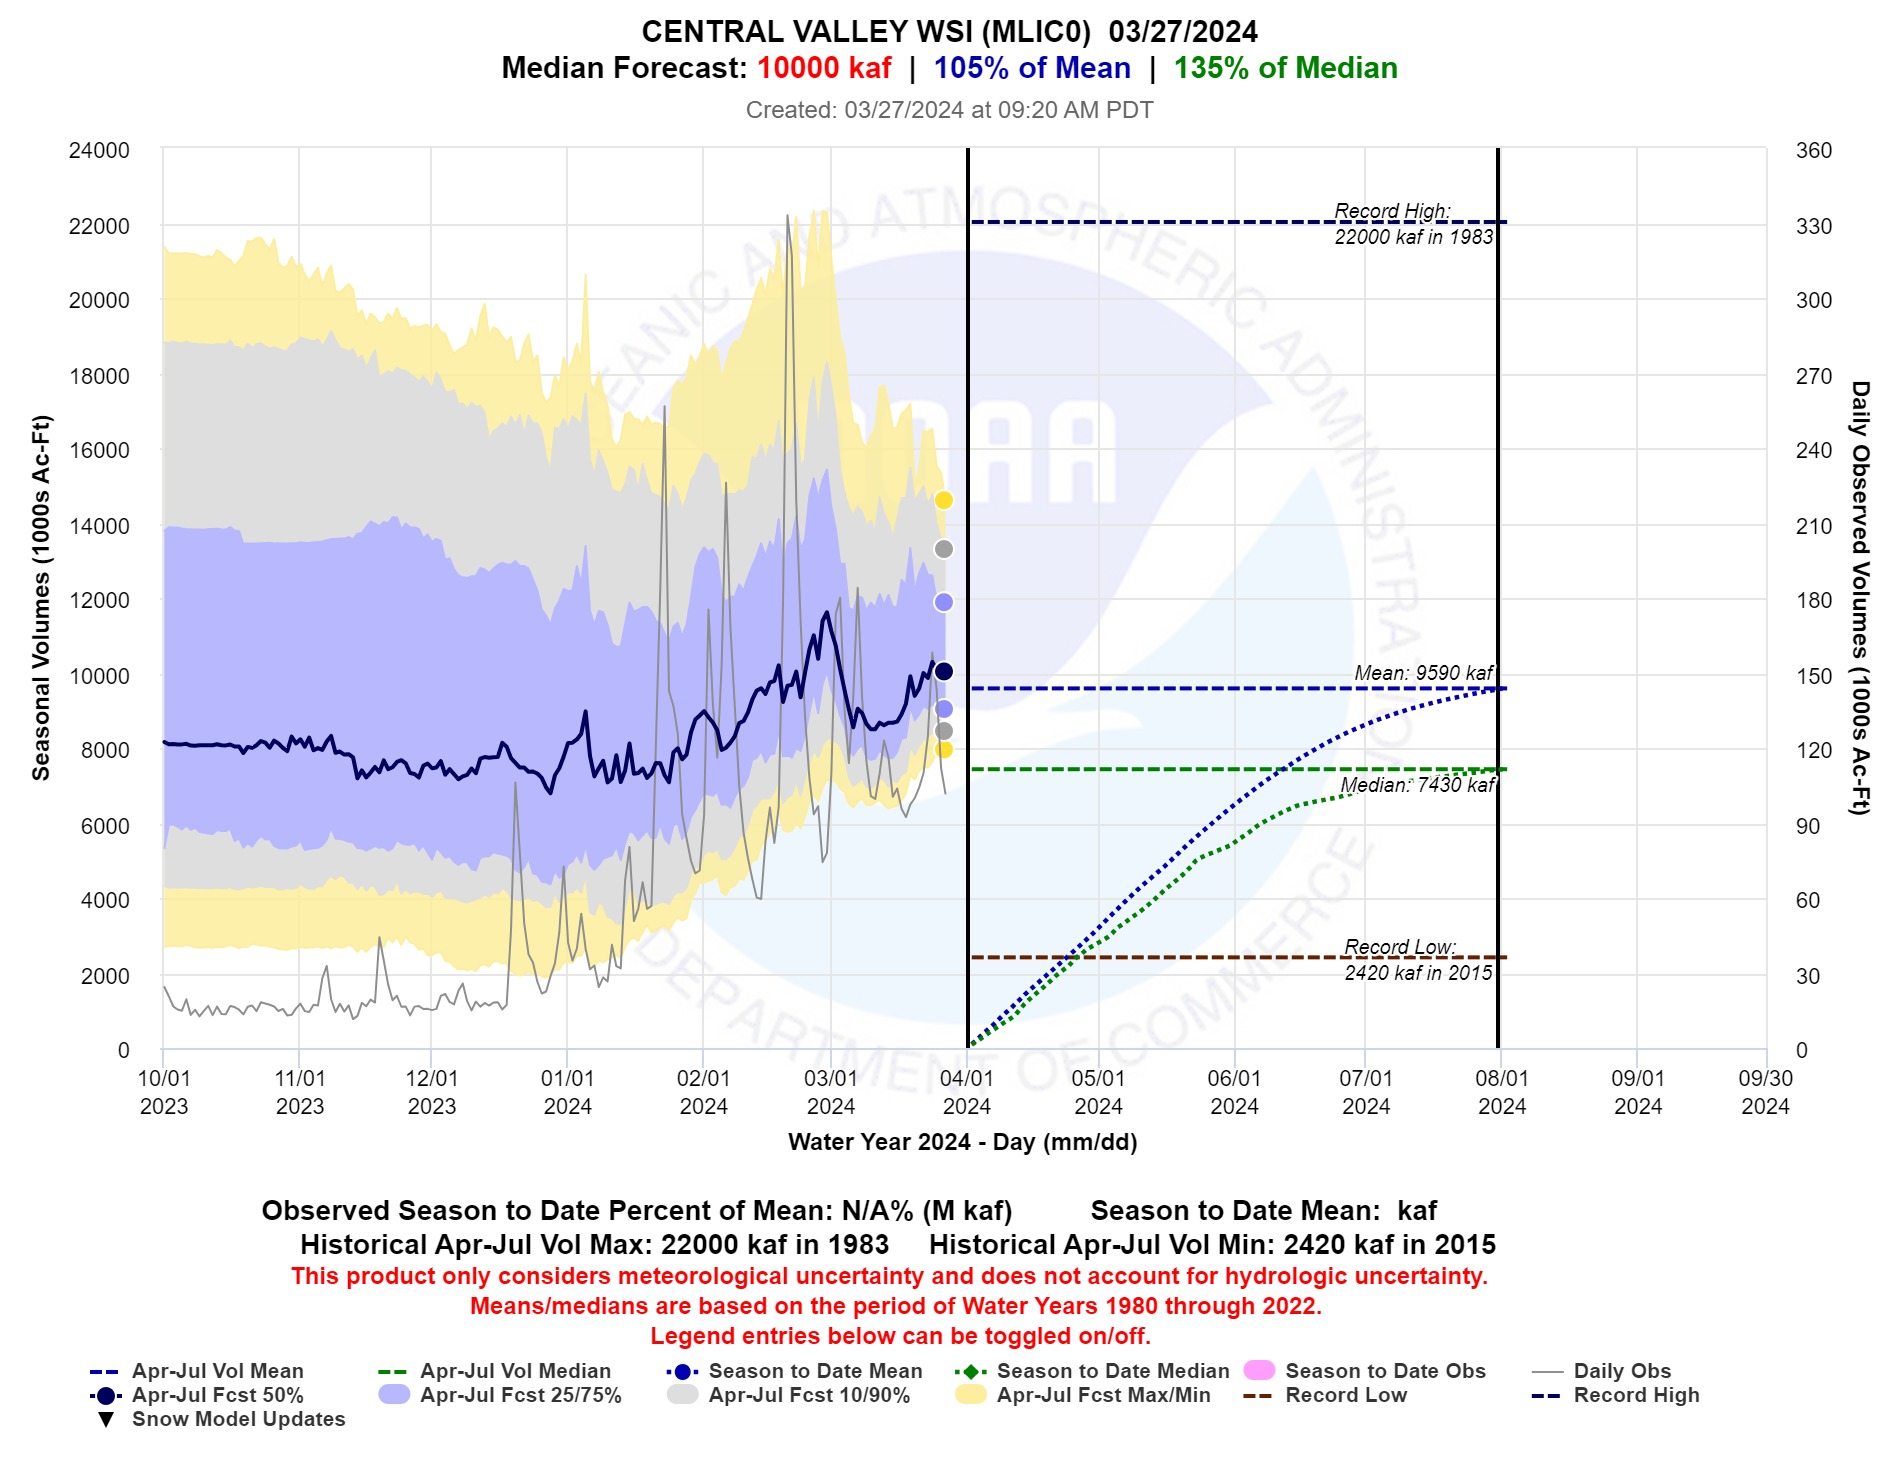
Many of the seasonal water supply forecasts took a sizable dip in mid-March with the dry weather and snowmelt that resulted from the warm weather across the area. Runoff forecasts for the WY held a little more steady during this time as some of the runoff volume from lower elevations was shifted from April into March. Even basins that lie above 6,500ft, such as the West Walker River, were showing sizable melt last week. With additional snow last weekend and more expected to close out this week, seasonal water supply forecasts have rebounded to near the peak levels forecasted earlier this month as shown in Figure 5.
Figure 4: Median seasonal water supply forecasts.. Source: CNRFC
Figure 5: Seasonal water supply forecast for the Central Valley Water Supply Index: This index takes into account 8 of the major river systems across the Sacramento and San Joaquin watersheds.. Source: CNRFC
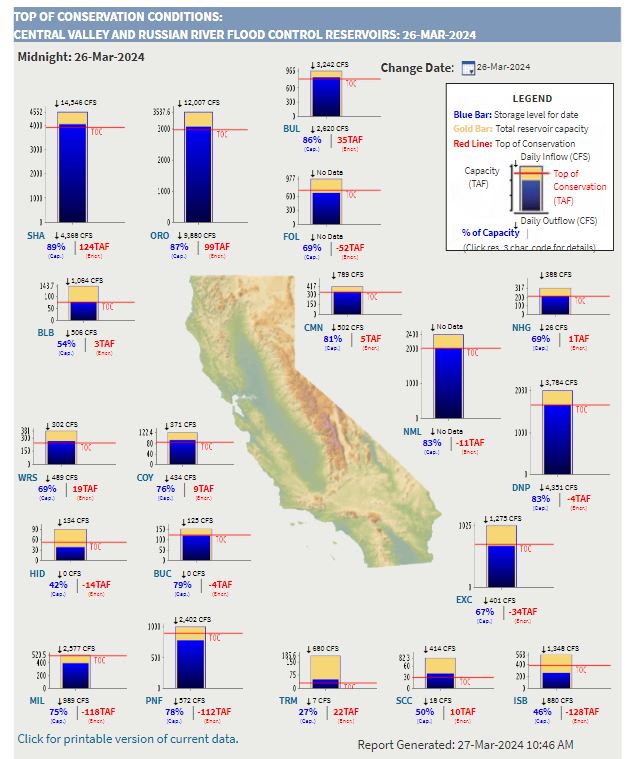
Area reservoir conditions shown in Figure 6 indicate that all major reservoirs are at or very near the top of the conservation pool. As the calendar turns to April, reservoir levels will continue to rise with the abundant snowpack that lies above them.
Figure 6: Current water supply conditions for area reservoirs. Source: CA Department of Water Resources
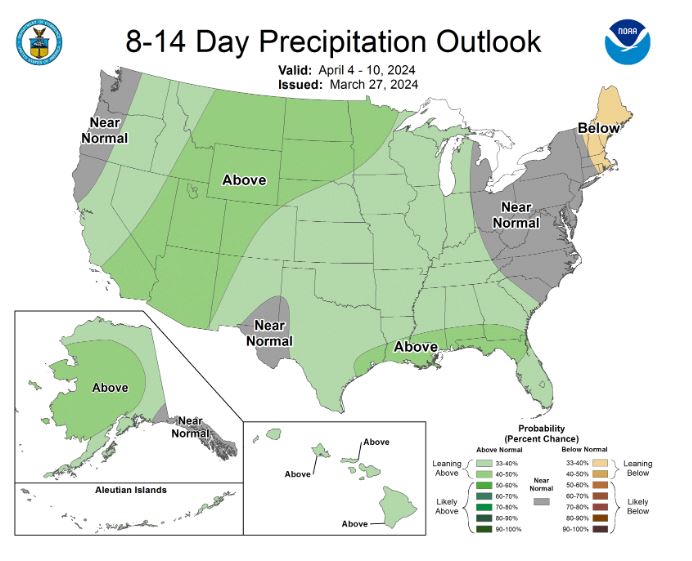
Figure 7 shows the 8-14 day forecast from the Climate Prediction Center (CPC) highlighting slightly above average chances for above normal precipitation. Longer range outlooks currently favor near normal conditions for much of the region. Keep in mind that as we head into April, the average precipitation starts to rapidly tail off. Thus, an above average forecast for a given time frame doesn’t necessarily mean an abundance of precipitation.
Figure 7: 8-14 day precipitation outlook. Source: NOAA Climate Prediction Center