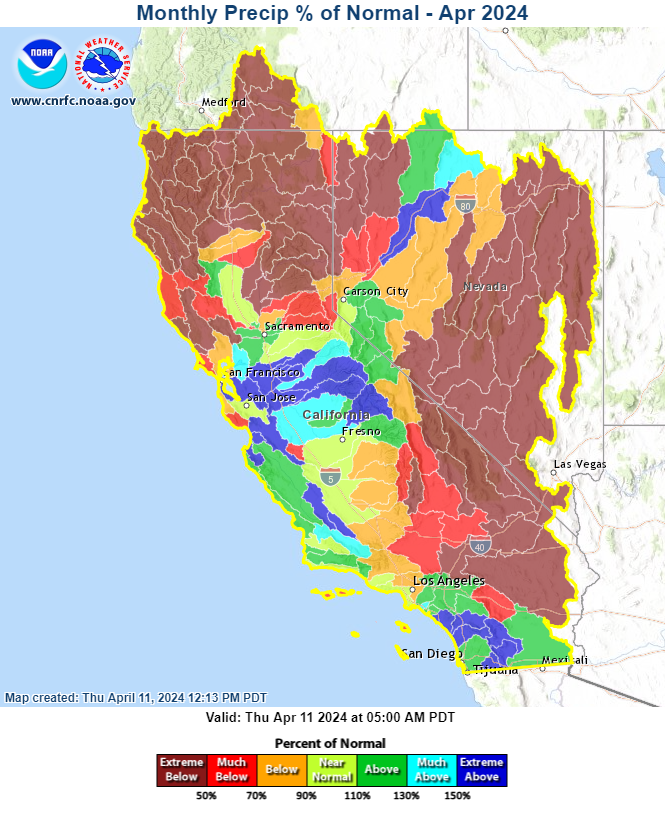
The first 10 days of April saw both below normal regions of precipitation, and some above normal regions in the Central Sierra and along coastal basins south of the Bay Area
Figure 1a April-to-date precipitation through April 11, 2024 at 4 AM PST. Source: CNRFC
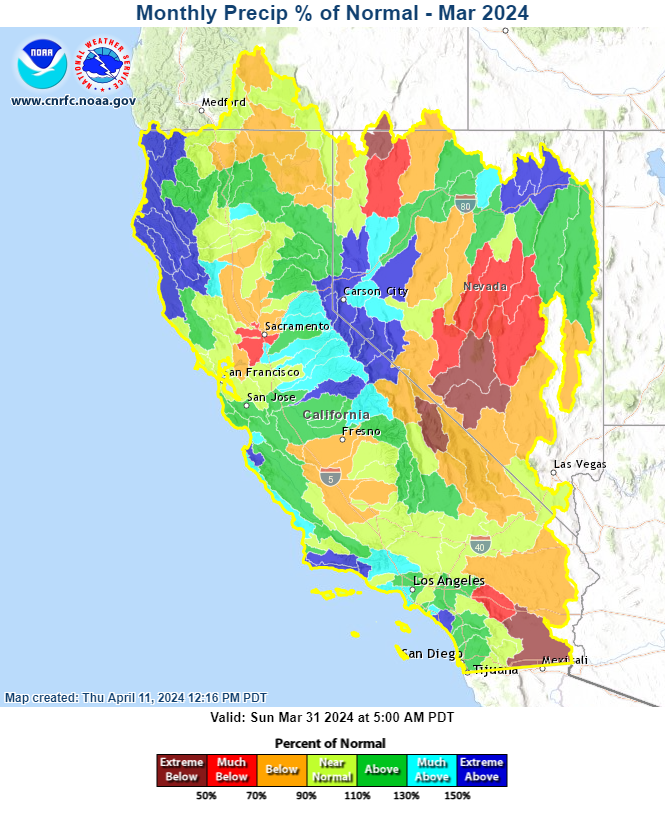
This comes on the heels of an above average March precipitation. An especially cold storm March 29-31 produced snow down to low elevations.
Figure 1b March 2024 precipitation. Source: CNRFC
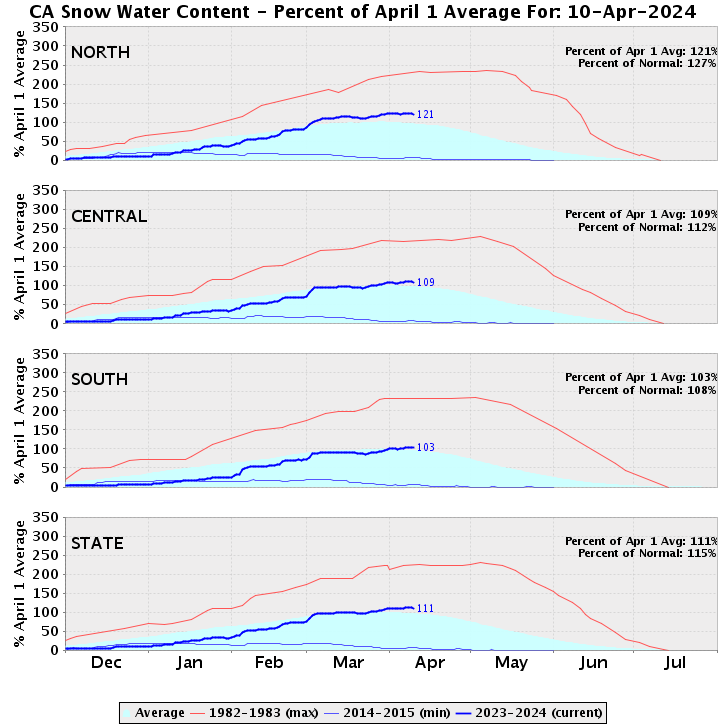
On February 9, Statewide water content stood at 13.5 inches, or 52% of average. After a productive two months of snow production, the April 9 value was 28.8 inches or 116% of average. Snowpack water content has decreased from it’s peak on April 8th with warm CA temperatures yesterday.
Figure 2 CA snow water content by region. Source: CA Department of Water Resources
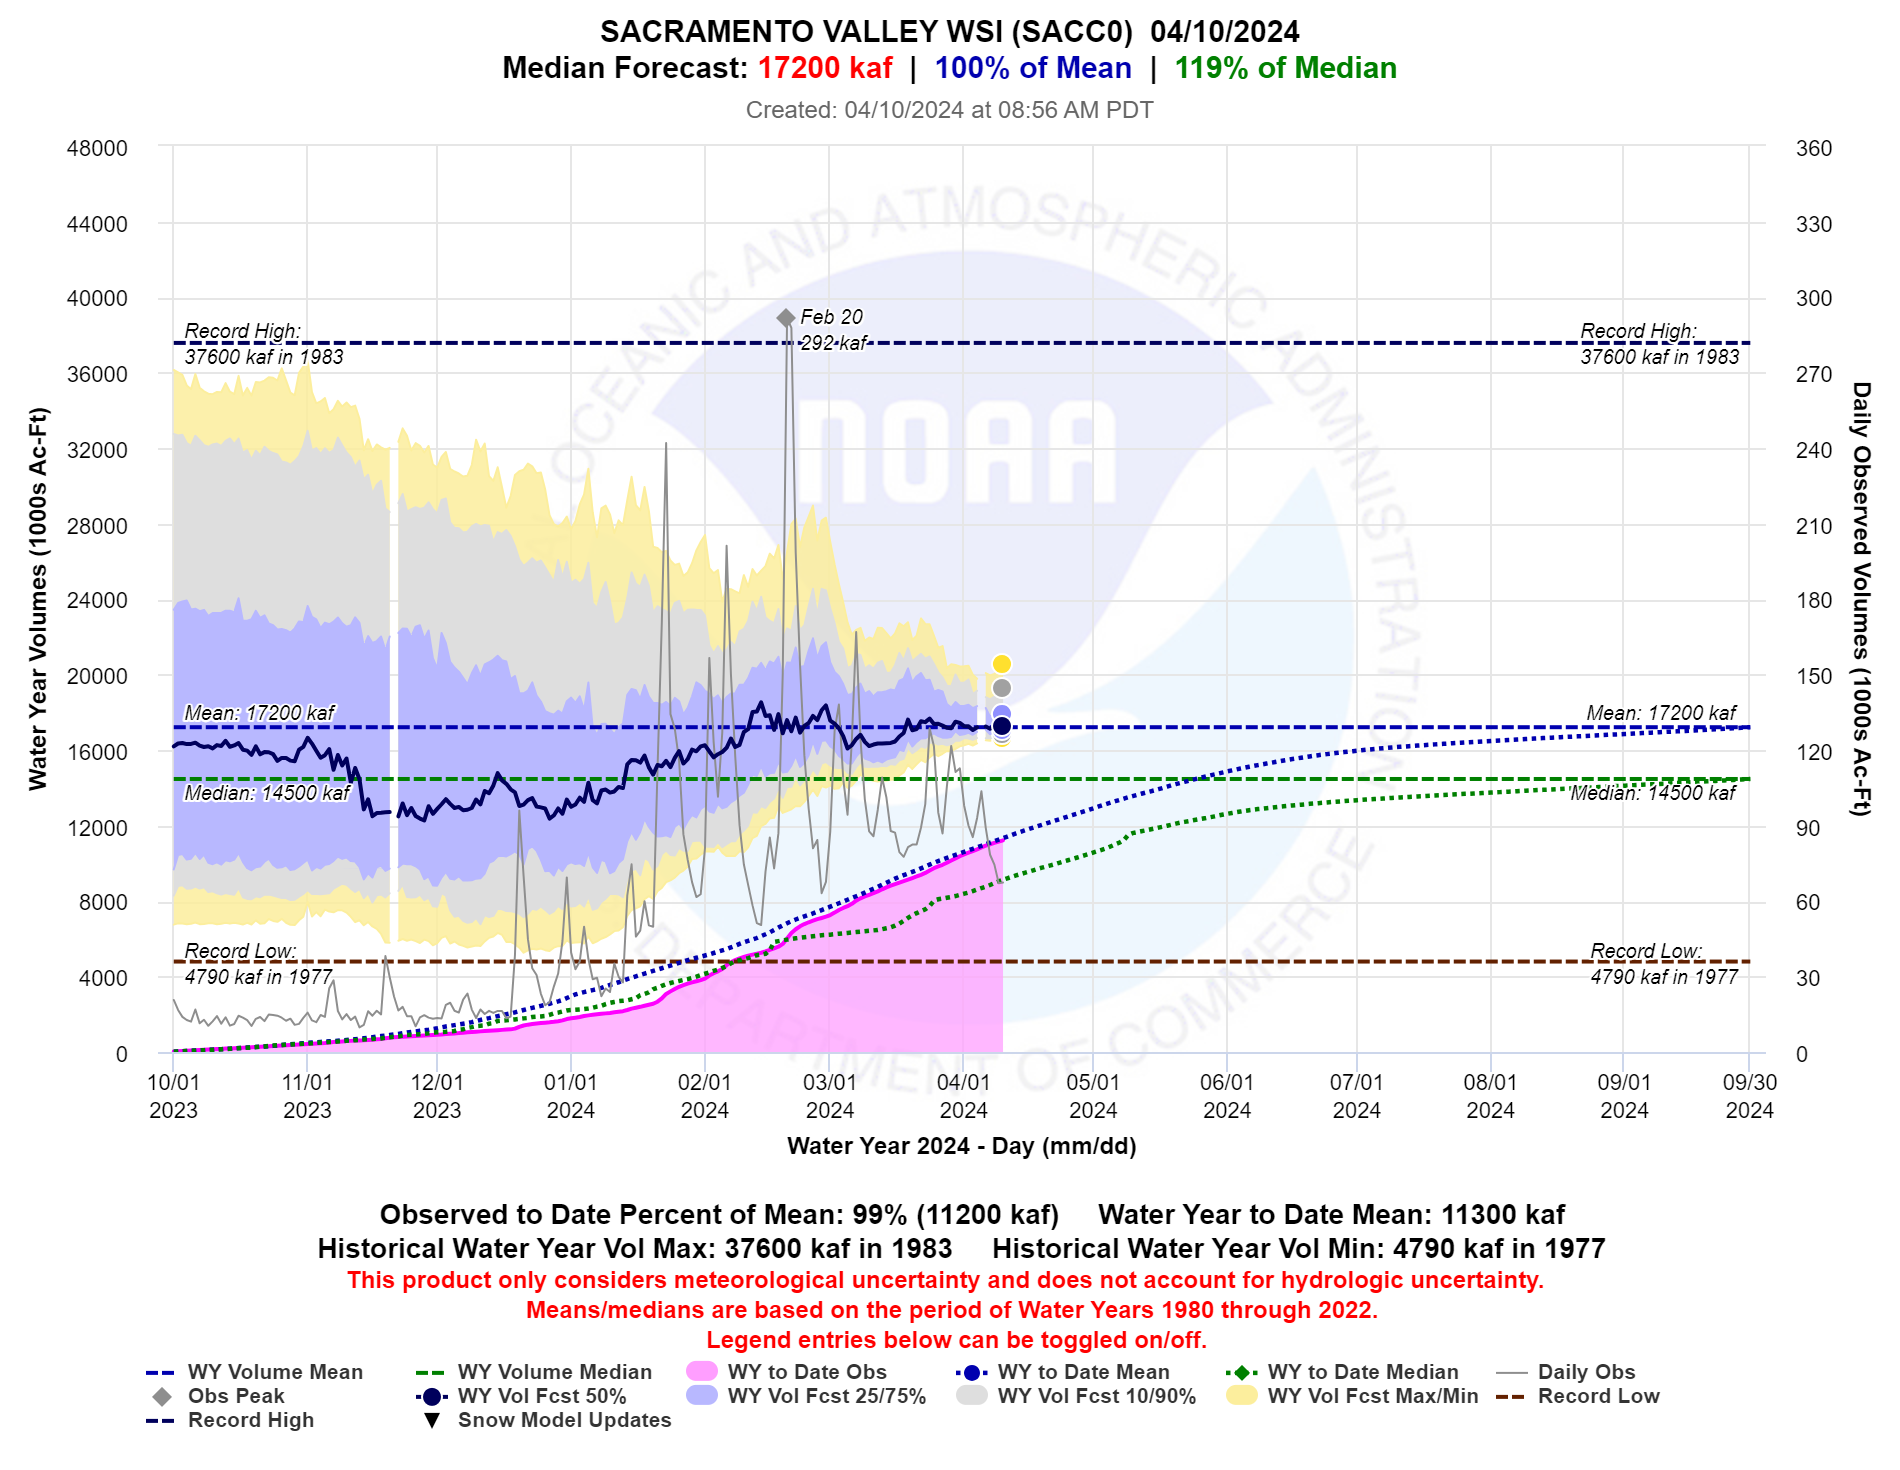
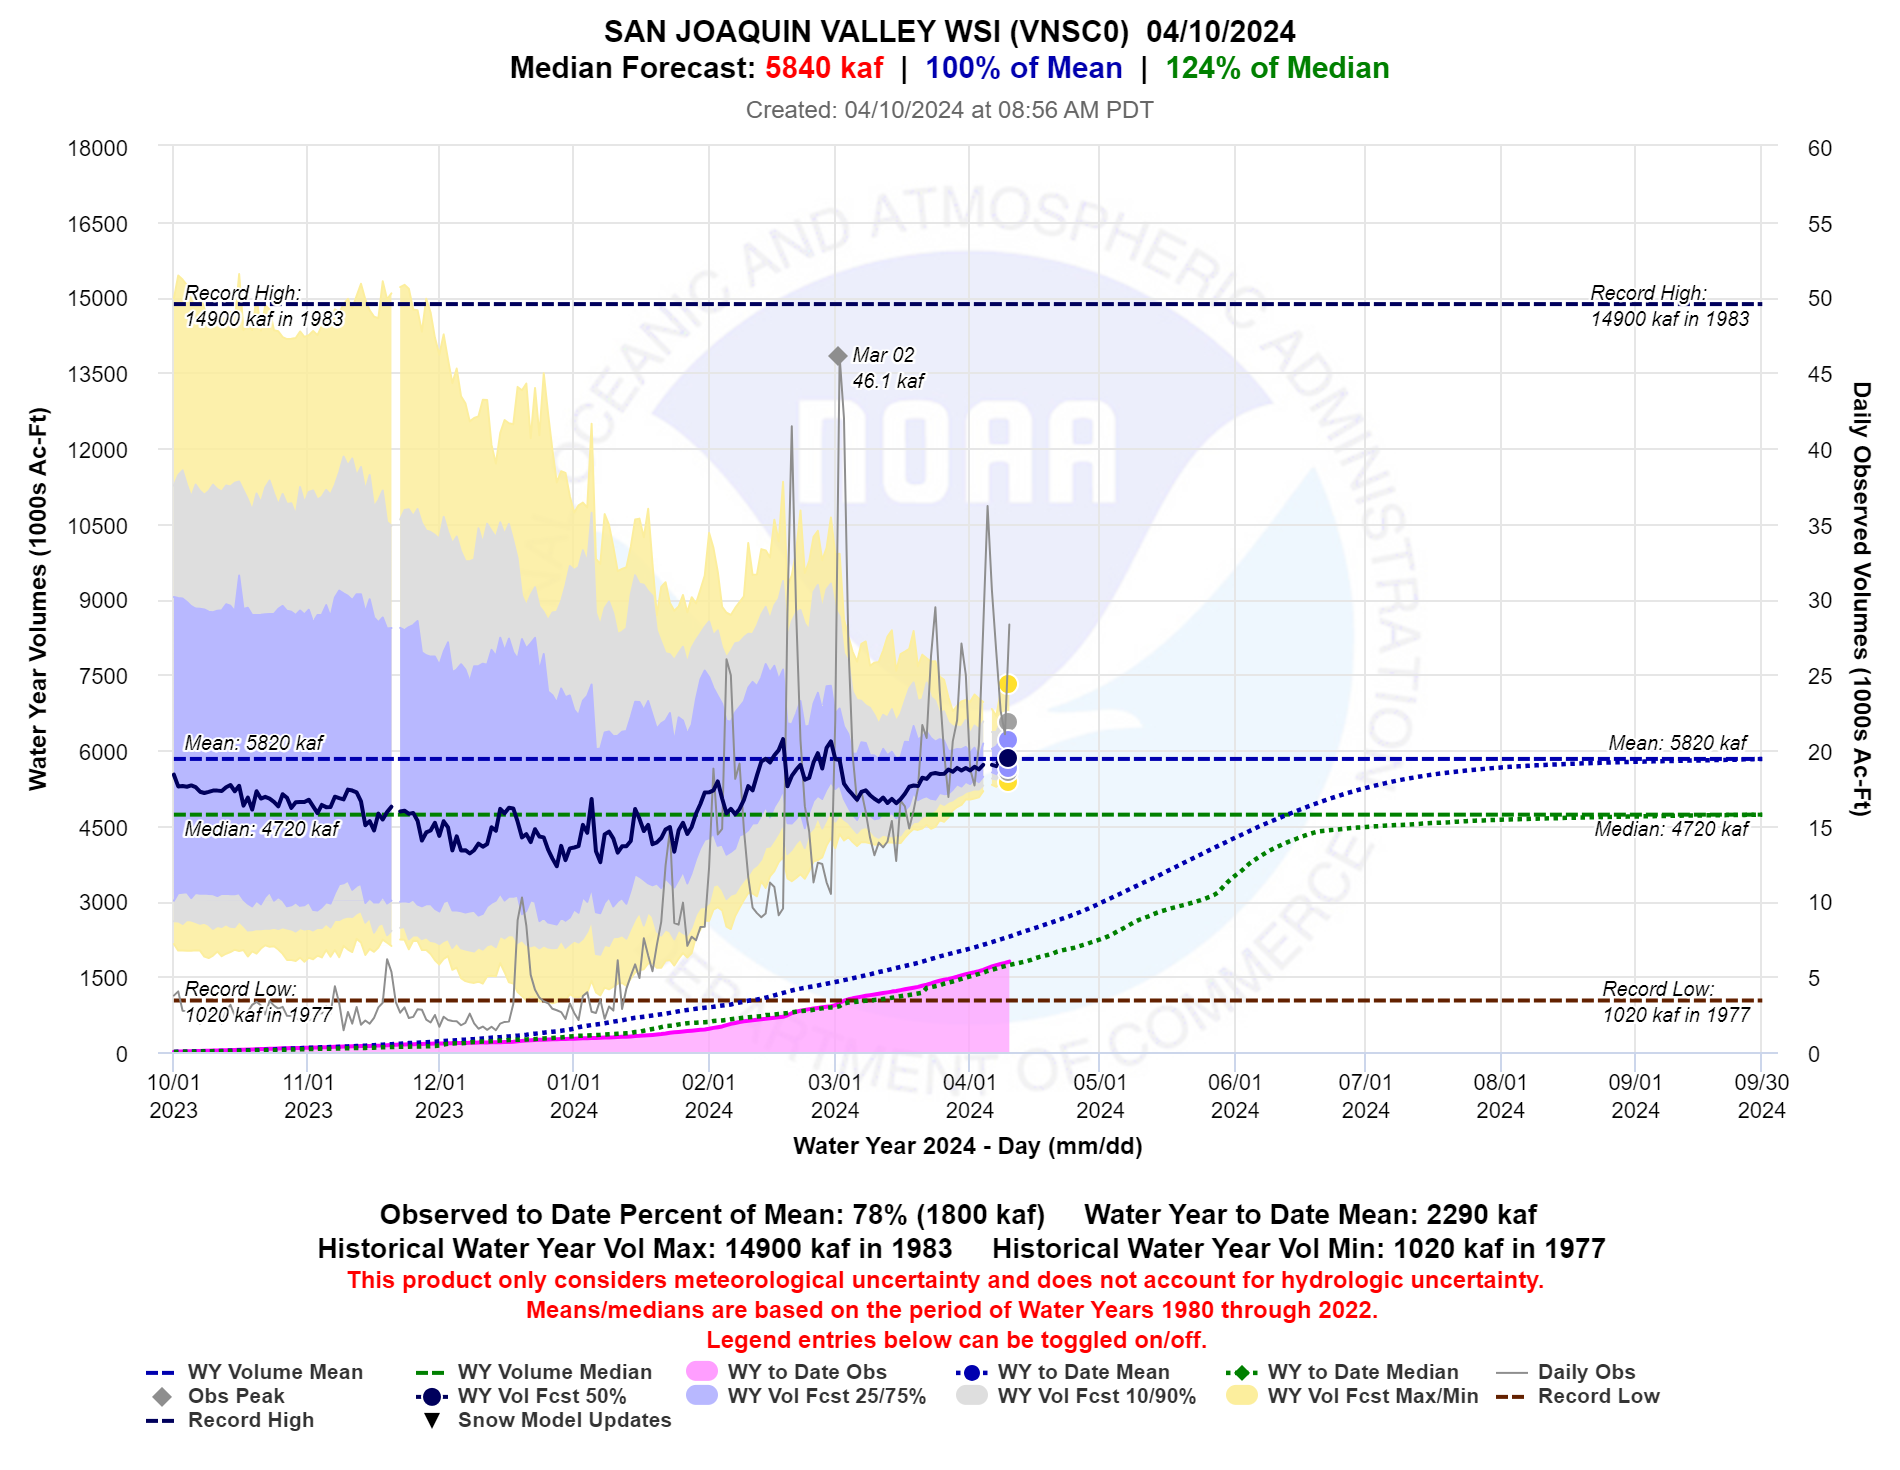
Trends in the water year forecasts for the Sacramento and San Joaquin Valley Water Resources Index locations have been flat, hovering around 100% of normal. Yesterday’s forecast had both regions at exactly 100% of the 1980-2022 mean.
Figure 3 Water year forecast trends for the Sacramento Valley Water Supply Index. Source: CNRFC
Figure 4 Water year forecast trends for the San Joaquin Valley Water Supply Index. Source: CNRFC
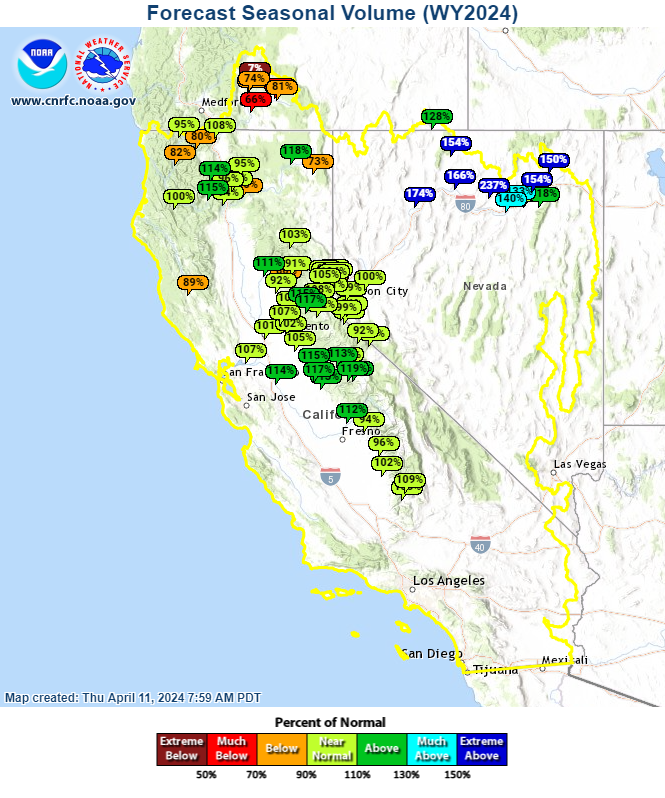
Figure 5 Seasonal (generally April through July) runoff forecasts. Source: CNRFC
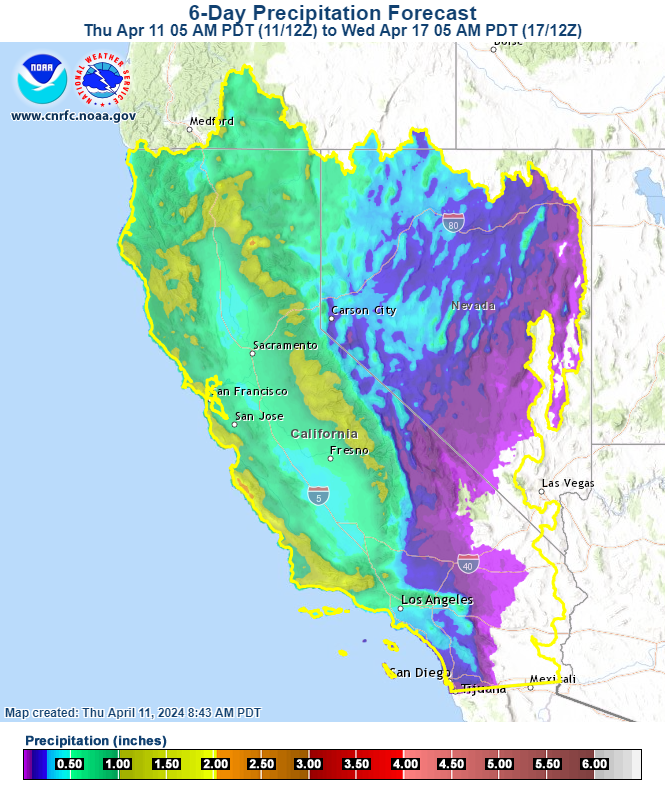
Forecasts show additional precipitation this week (next 6 days), with highest amounts in northern and central CA (figure 6a). Longer-range outlooks favor below average precipitation for the April 19-25 period (figure 6b).
Figure 6a : 6-day precipitation forecast Source: CNRFC
Figure 6b : 8- to 14-day precipitation outlook. Source: Climate Prediction Center (graphic also available on CNRFC web site)
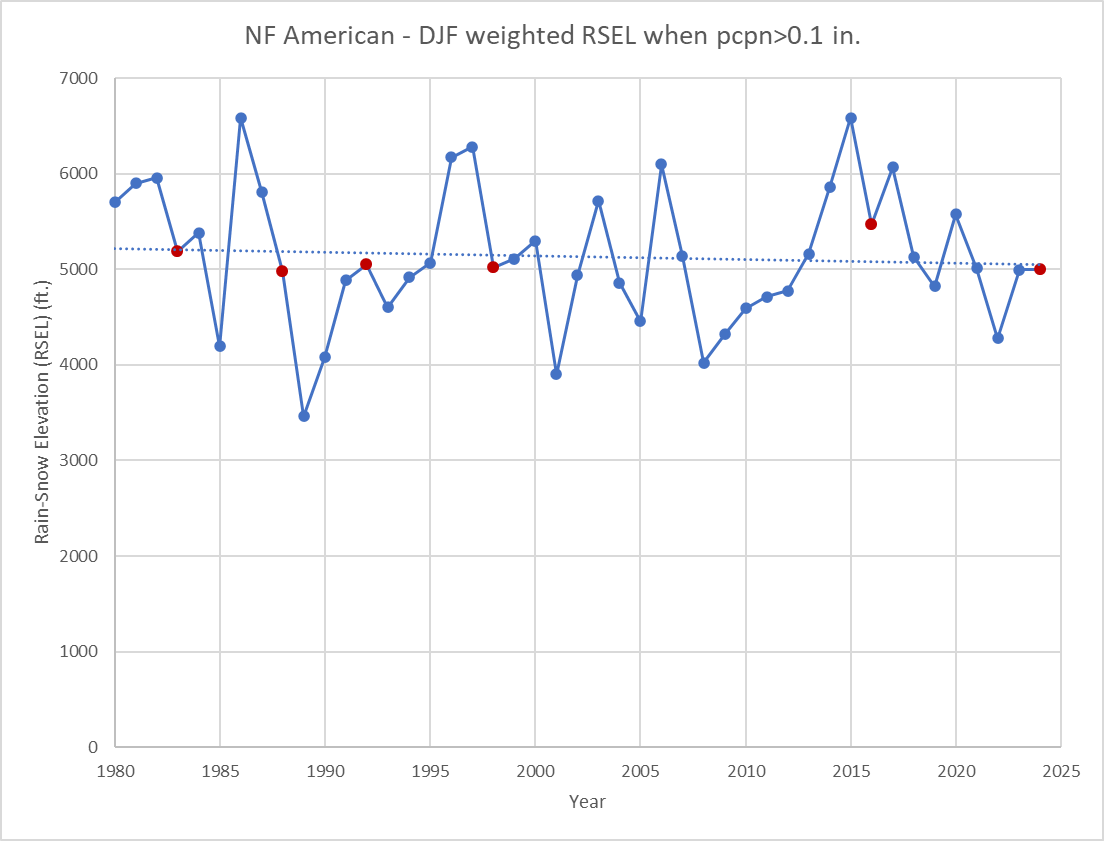
Despite the slow trend toward warmer temperatures, California continues to see its share of colder storms, particularly since the 2015 snow drought (see graph below showing rain-snow elevations during winter precipitation events in the American River basin. ‘DJF’⇒ ‘Dec/Jan/Feb’). The RSEL is weighted by the amount of precipitation, so RSEL during heavier precip periods are weighted more. Red dots indicate strong El Nino years, which have been remarkably consistent in producing fairly average rain-snow elevation lines during the winter months.
After a slow start to the water year, February and March produced abundant precipitation and brought the major water supply regions to around 100% of average (some higher, some lower). However, exceptions are the rule outside of California with the southern Oregon region well below normal, and the Humboldt River watershed in Nevada well above normal.
If the current trend for “normal” is any indication, California may even have near normal precipitation during April-July, which would be a welcome change after 3 dry Springs (2021-2023).
CNRFC