The first of a series of storms is impacting California today with widespread precipitation across the northern two thirds of the state. Precipitation totals from this first wave ranged from 1-2in along the north coast down through the Russian basin, to around 0.5-1.0in from roughly Stockton northward through the Central Valley. Precipitation is just getting started across much of the Sierra, with totals of around 0.5-1.5in expected during this first wave.
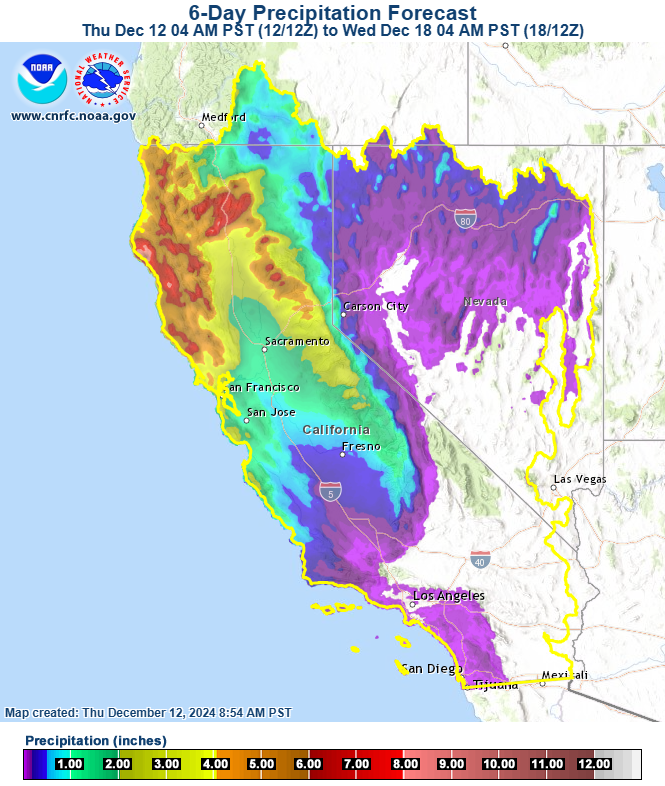
A second storm will move across the area on Friday into Saturday, with a third system arriving on Monday. Forecast precipitation totals range from 4-8in across many of the watersheds north of San Francisco, 3-6in across the northern Sierra, and a more modest 1-3in expected across the central and southern Sierra. Snow lines will fluctuate between approximately 3-5,000ft across the northern Sierra where much of the precipitation will be concentrated. The forecast precipitation totals for the next 6 days is shown in Figure 1. Note that these precipitation totals are in addition to what has already fallen prior to 4AM Thursday morning.
Figure 1: 6-day precipitation forecast. Source: CNRFC
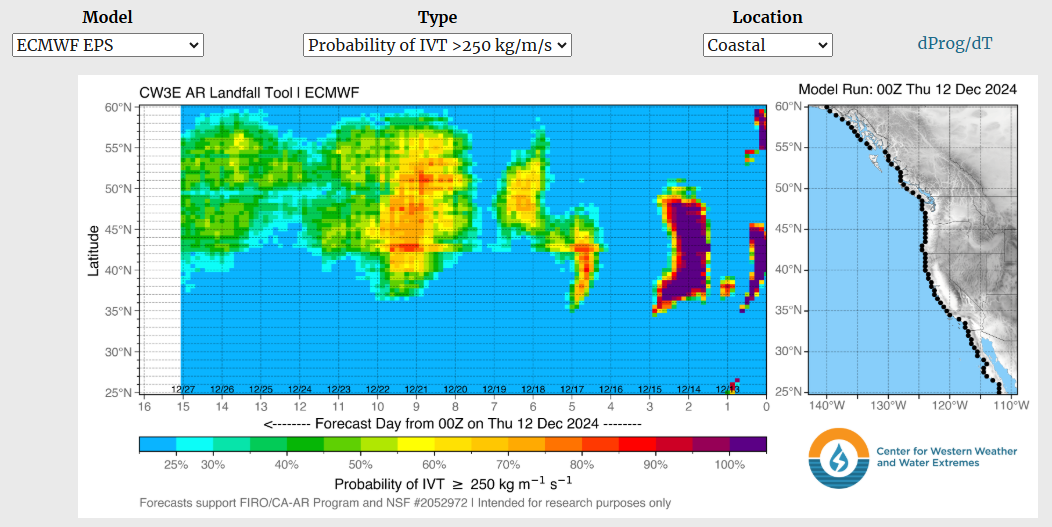
Looking beyond Tuesday of next week, there is the potential for unsettled weather to continue across the area, particularly across northern CA. The atmospheric river landfall tool from the Center for Weather and Water Extremes (CW3E) in Figure 2 indicates additional chances for atmospheric river conditions beyond Tuesday, with the highest chances across northern California, Oregon and Washington. Any shift southward could bring more impactful weather to more of our region.
Figure 2: Atmospheric Landfall Tool showing moisture transport from the European model. Source: CW3E
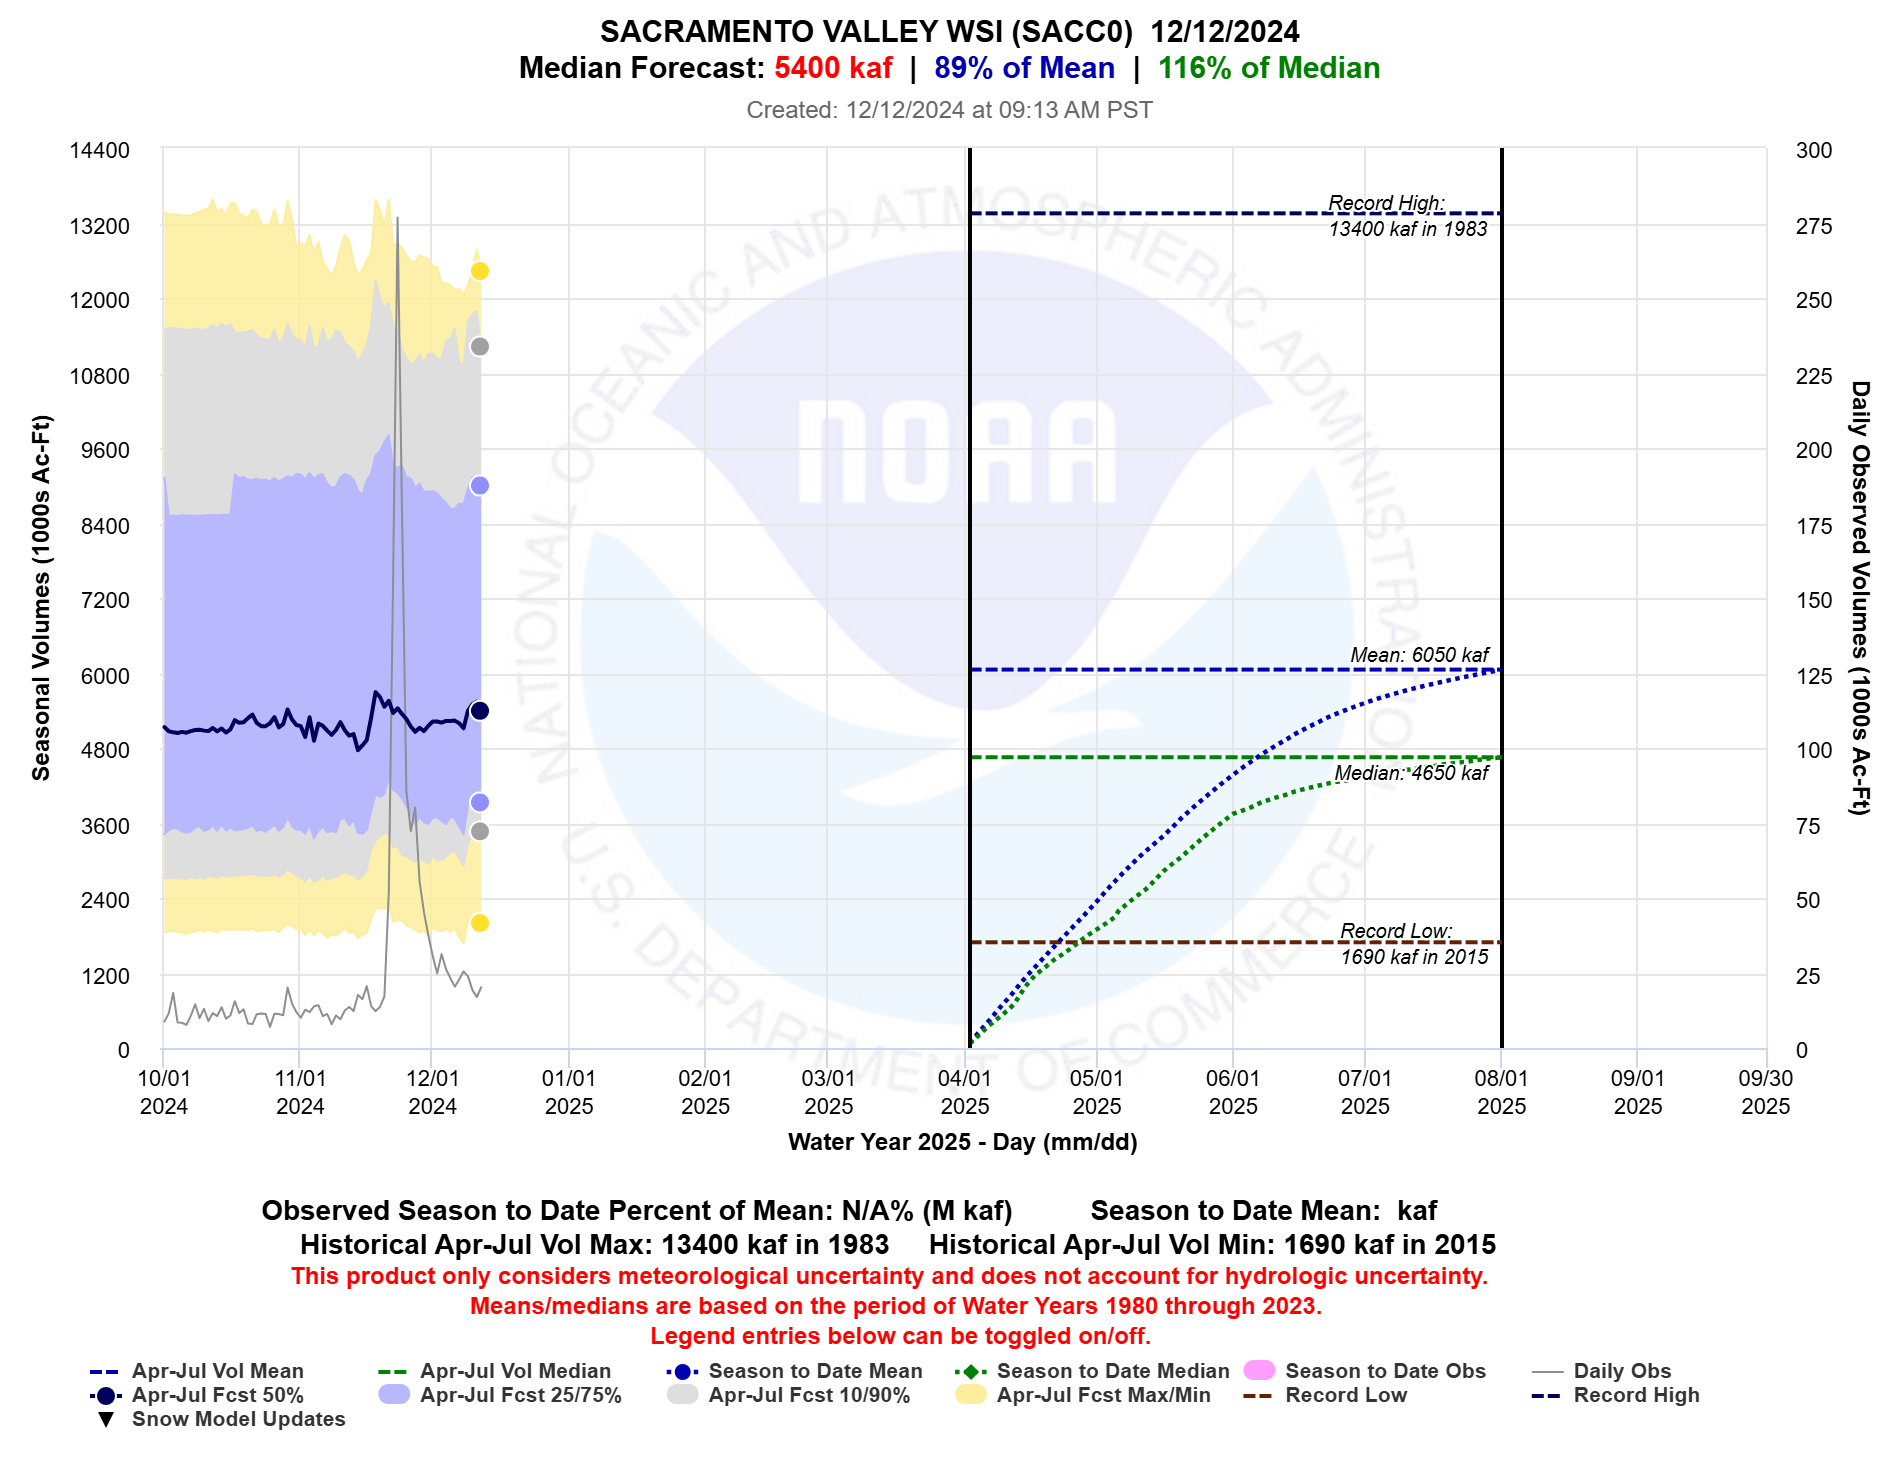
With dry conditions across the area the past 2 weeks, water supply numbers have declined a bit. With the anticipation of the upcoming storms, water supply numbers have started to rebound with the last several forecasts. Figure 3 shows the AJ forecast for the Sacramento Valley water supply index, which is the accumulation of the full natural flow forecasts at Bend Bridge, Oroville, Englebright, and Folsom. Both the current AJ and WY forecasts are approximately 115% of the historical median (water years 1980-2023). Conditions have been drier in the central and southern Sierra. The water supply index for the San Joaquin basin is currently near 90% of median for both the AJ and WY forecasts.
Figure 3: Trend plot for the Sacramento Valley water supply index. Source: CNRFC
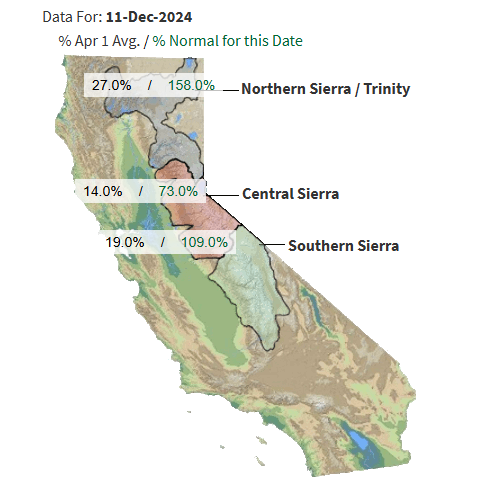
The snowpack across the state has remained pretty constant the past couple of weeks. Low elevation snow pillows across the state, in general, are reporting well below normal as a result of the warm, late November storm. Pillows at higher elevations are reporting much higher numbers relative to average, especially those in the northern Sierra and through the Trinity basin.
Figure 4 shows the current snowpack conditions across California. The northern Sierra is currently at 158% of average, while the central Sierra is only 73% of average. Expect the percentages to increase a fair amount over the next 5 days across the northern Sierra, with more modest increases across the central and southern regions.
Figure 4: Current statewide snowpack conditions. Source: CDEC
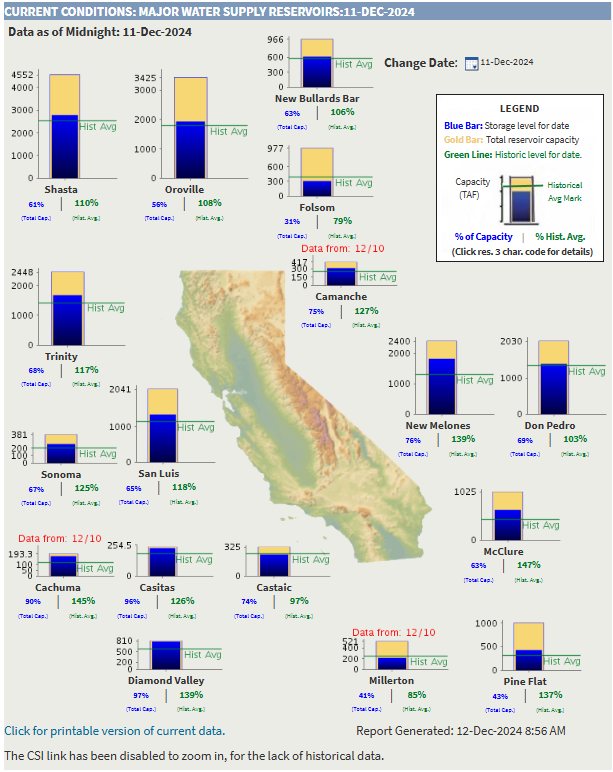
Water supply reservoir levels across the state are looking good for most watersheds. The vast majority of reservoirs across the state are above the historical average for this time of year as shown in Figure 5. Many reservoirs across the state are still well below their respective seasonal top of conservation pools, so plenty of space to store more water as we begin the wet season.
Figure 5: Current water supply conditions for area reservoirs. Source: CA Department of Water Resources