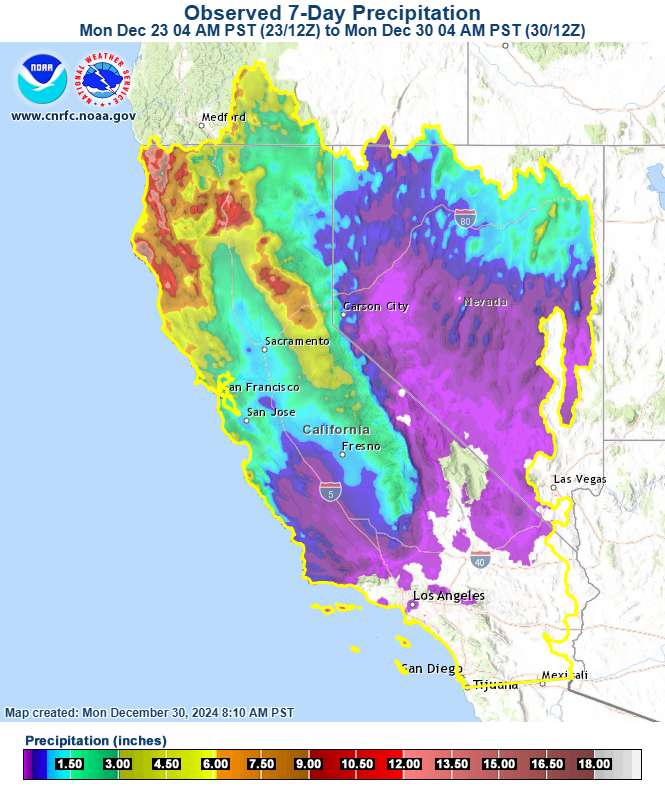
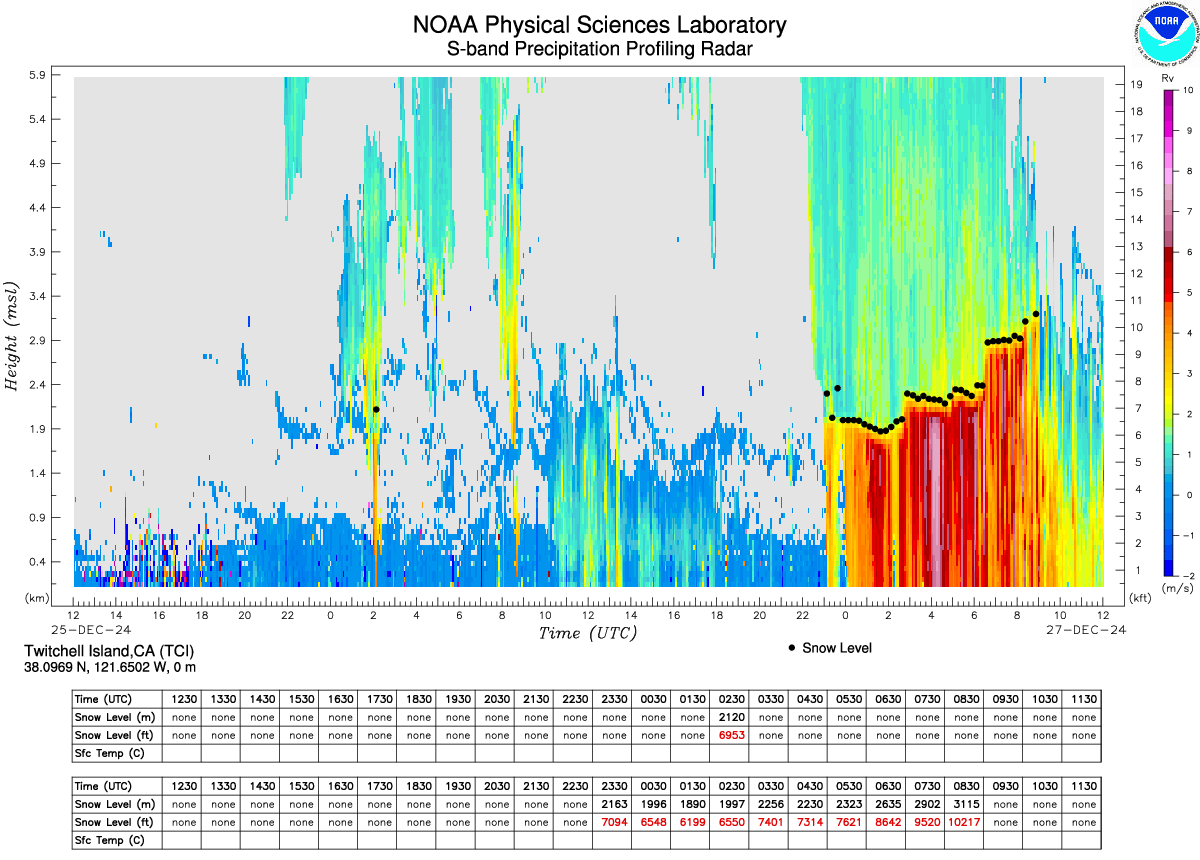
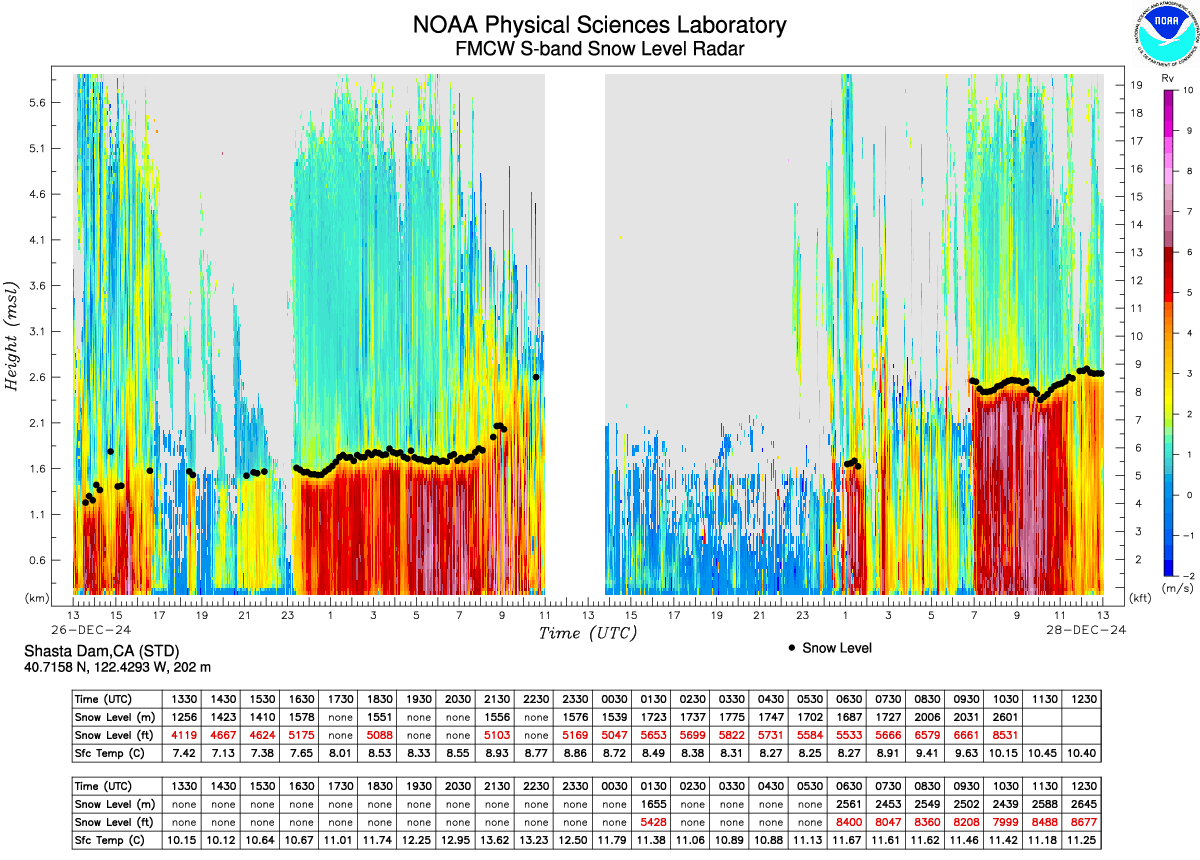
Multiple systems brought precipitation across much of the CNRFC domain over the last 10 days. The heaviest amounts occurred along the North Coast, Upper Sacramento and the Feather-Yuba drainages as indicated by 7 day totals shown in Figure 1. Snow level profiling radars at Twitchell Island and Shasta Dam indicated elevated snow levels beginning on December 27th (Figures 2 and 3). This suggests recent precipitation fell as rain across large portions of the Northern and Central Sierra and suppressed snowpack depth accumulation. As a result of the wet conditions, numerous river locations in the Upper Sacramento, North Coast, Russian and Klamath regions surpassed their monitor/action stages with a few exceeding minor flood stages.
Figure 1: Observed 7 Day Precipitation. Source: CNRFC
Figure 2: Twitchell Island, CA Profiling Radar. Source: NOAA Physical Sciences Laboratory
Figure 3: Shasta Dam, CA Profiling Radar. Source: NOAA Physical Sciences Laboratory
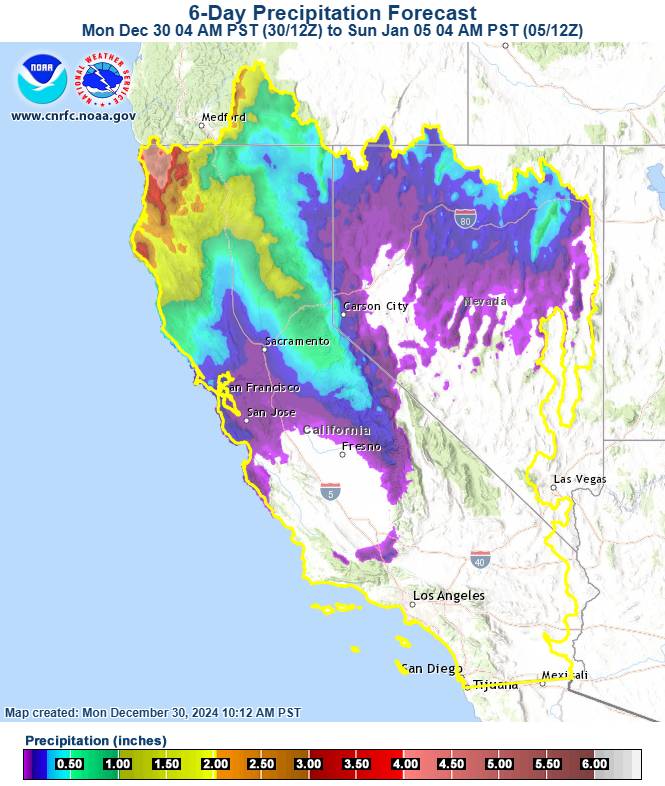
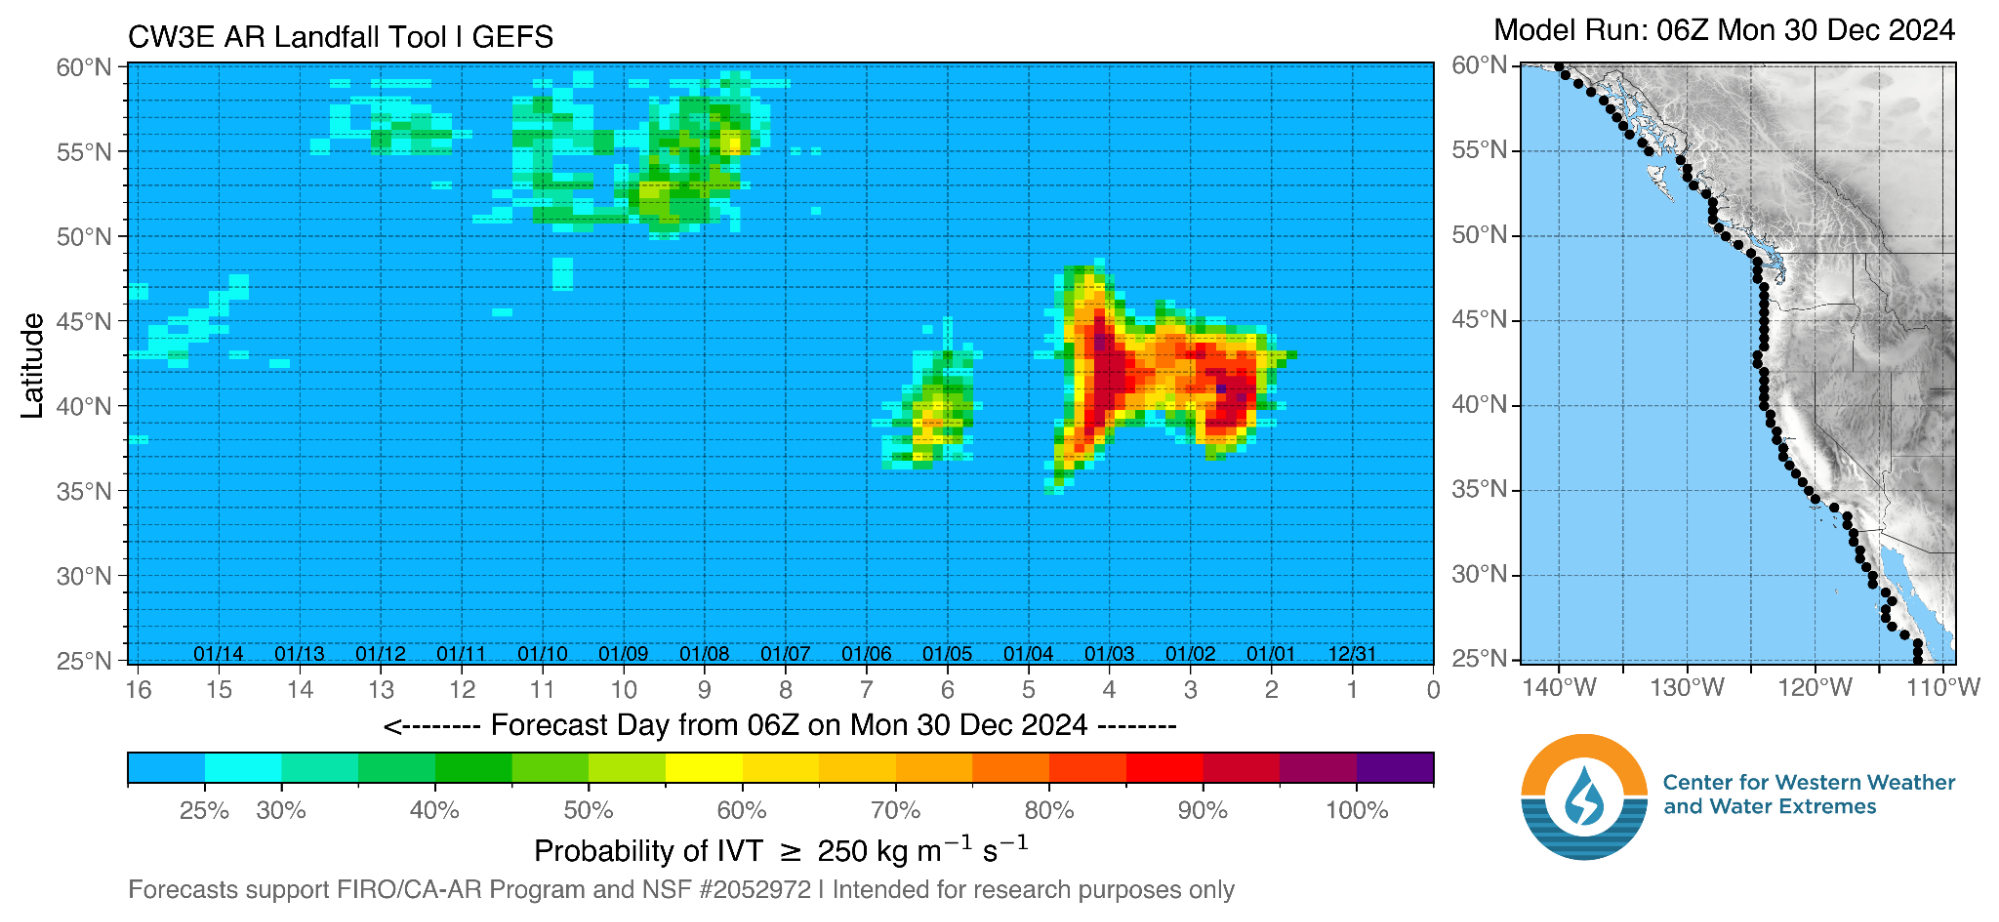
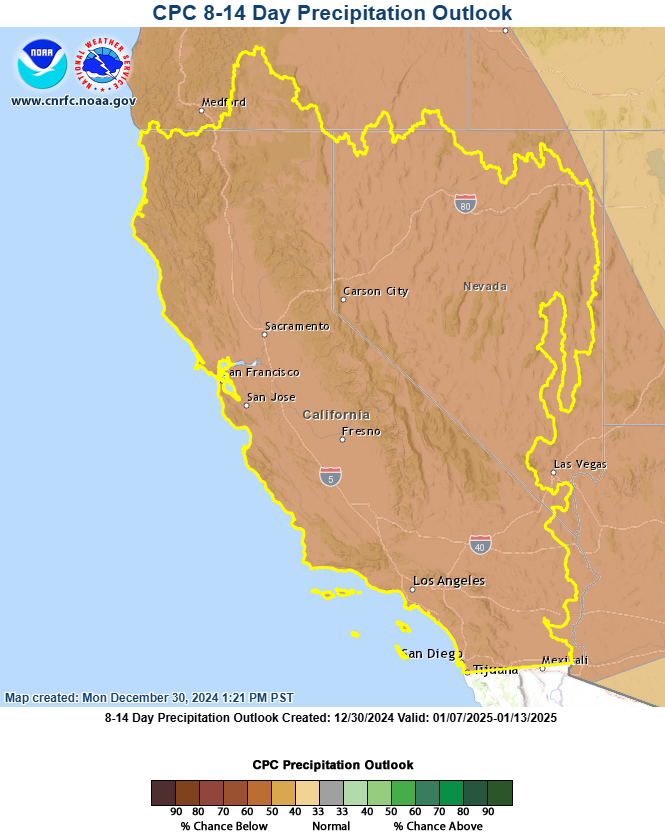
Looking ahead, a break in the precipitation is expected for the region through New Year’s Eve. Additional systems are expected to impact the area later in the week with widespread precipitation possible over the northern half of the region. There is lower confidence in 6 day amounts as there are model differences (Figure 4). The CW3E GEFS landfall tool suggests atmospheric river activity is expected to decrease or shift northward beyond this upcoming weekend (Figure 5). The CPC 8-14 day precipitation outlook is also favoring drier conditions for the 2nd week of January (Figure 6).
Figure 4: Forecasted 6 Day Precipitation. Source: CNRFC
Figure 5: Atmospheric Landfall Tool showing moisture transport from the GEFS model. Source: CW3E
Figure 6: CPC Day 8-14 Precipitation Outlook. Source: CNRFC
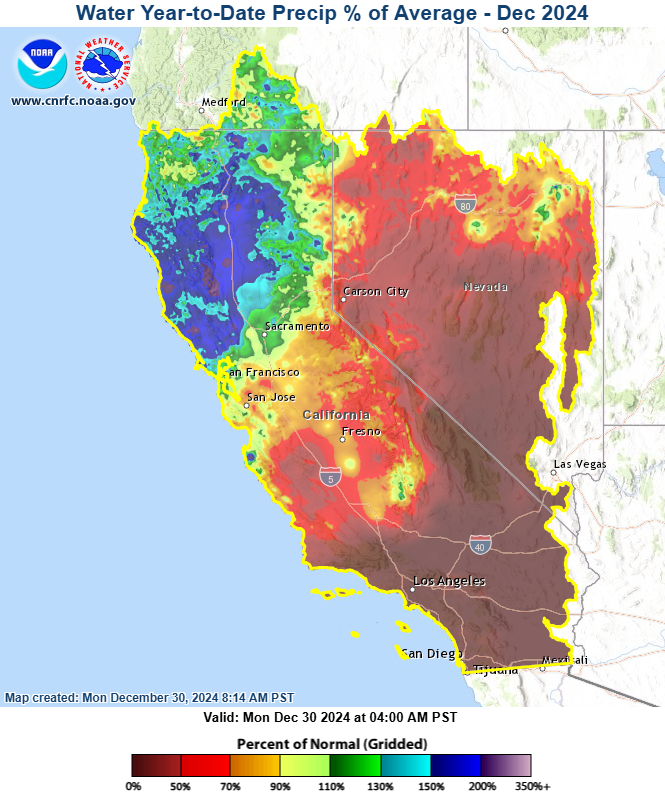
So far this water year, the precipitation pattern has largely followed winter outlook forecasts attributed to La Niña conditions. Above normal precipitation has fallen across much of Northern California with precipitation amounts quickly dropping off below I-80. Southern California has received little to no precipitation as indicated by the to date water year precipitation normals (Figure 7). Unfortunately, much of Nevada is well below normal due to limited spillover of precipitation over the Sierra.
Figure 7: To Date, Percent of WY Normal Precipitation. Source: CNRFC
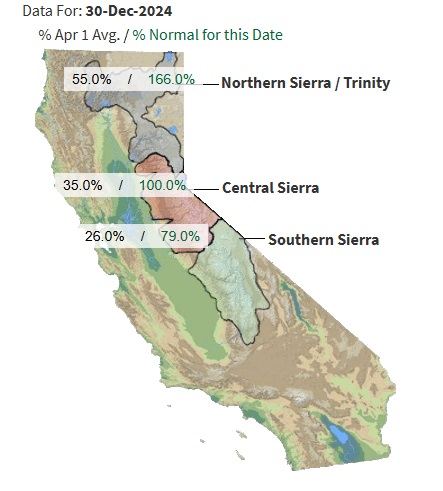
Compared with the December 12th update, snowpack has continued to build across the Northern and Central Sierra but declined across the Southern Sierra with respect to historical averages (Figure 8). For December 30th, % normal SWE (to date) for the Northern Sierra stands at 166%, 100% for the Central Sierra and 79% for the Southern Sierra. Somewhat impressive is the Northern Sierra/Trinity region has already accumulated over 50% of the annual April 1st SWE average.
Figure 8: Current statewide snowpack conditions. Source: CDEC
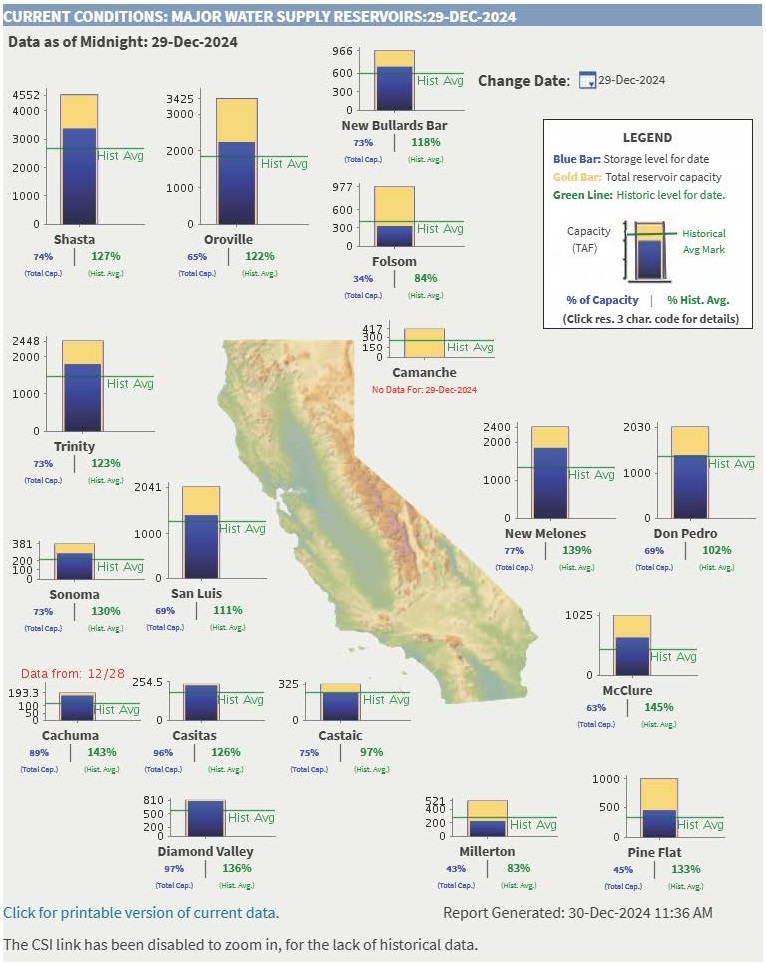
For California, water supply storage continues to be above the historical average for nearly all reservoirs (Figure 9). With the recent systems, some northern and smaller reservoirs have increased their releases when appropriate to stay below their top of conservation levels.
Figure 9: Current water supply conditions for area reservoirs. Source: CA Department of Water Resources
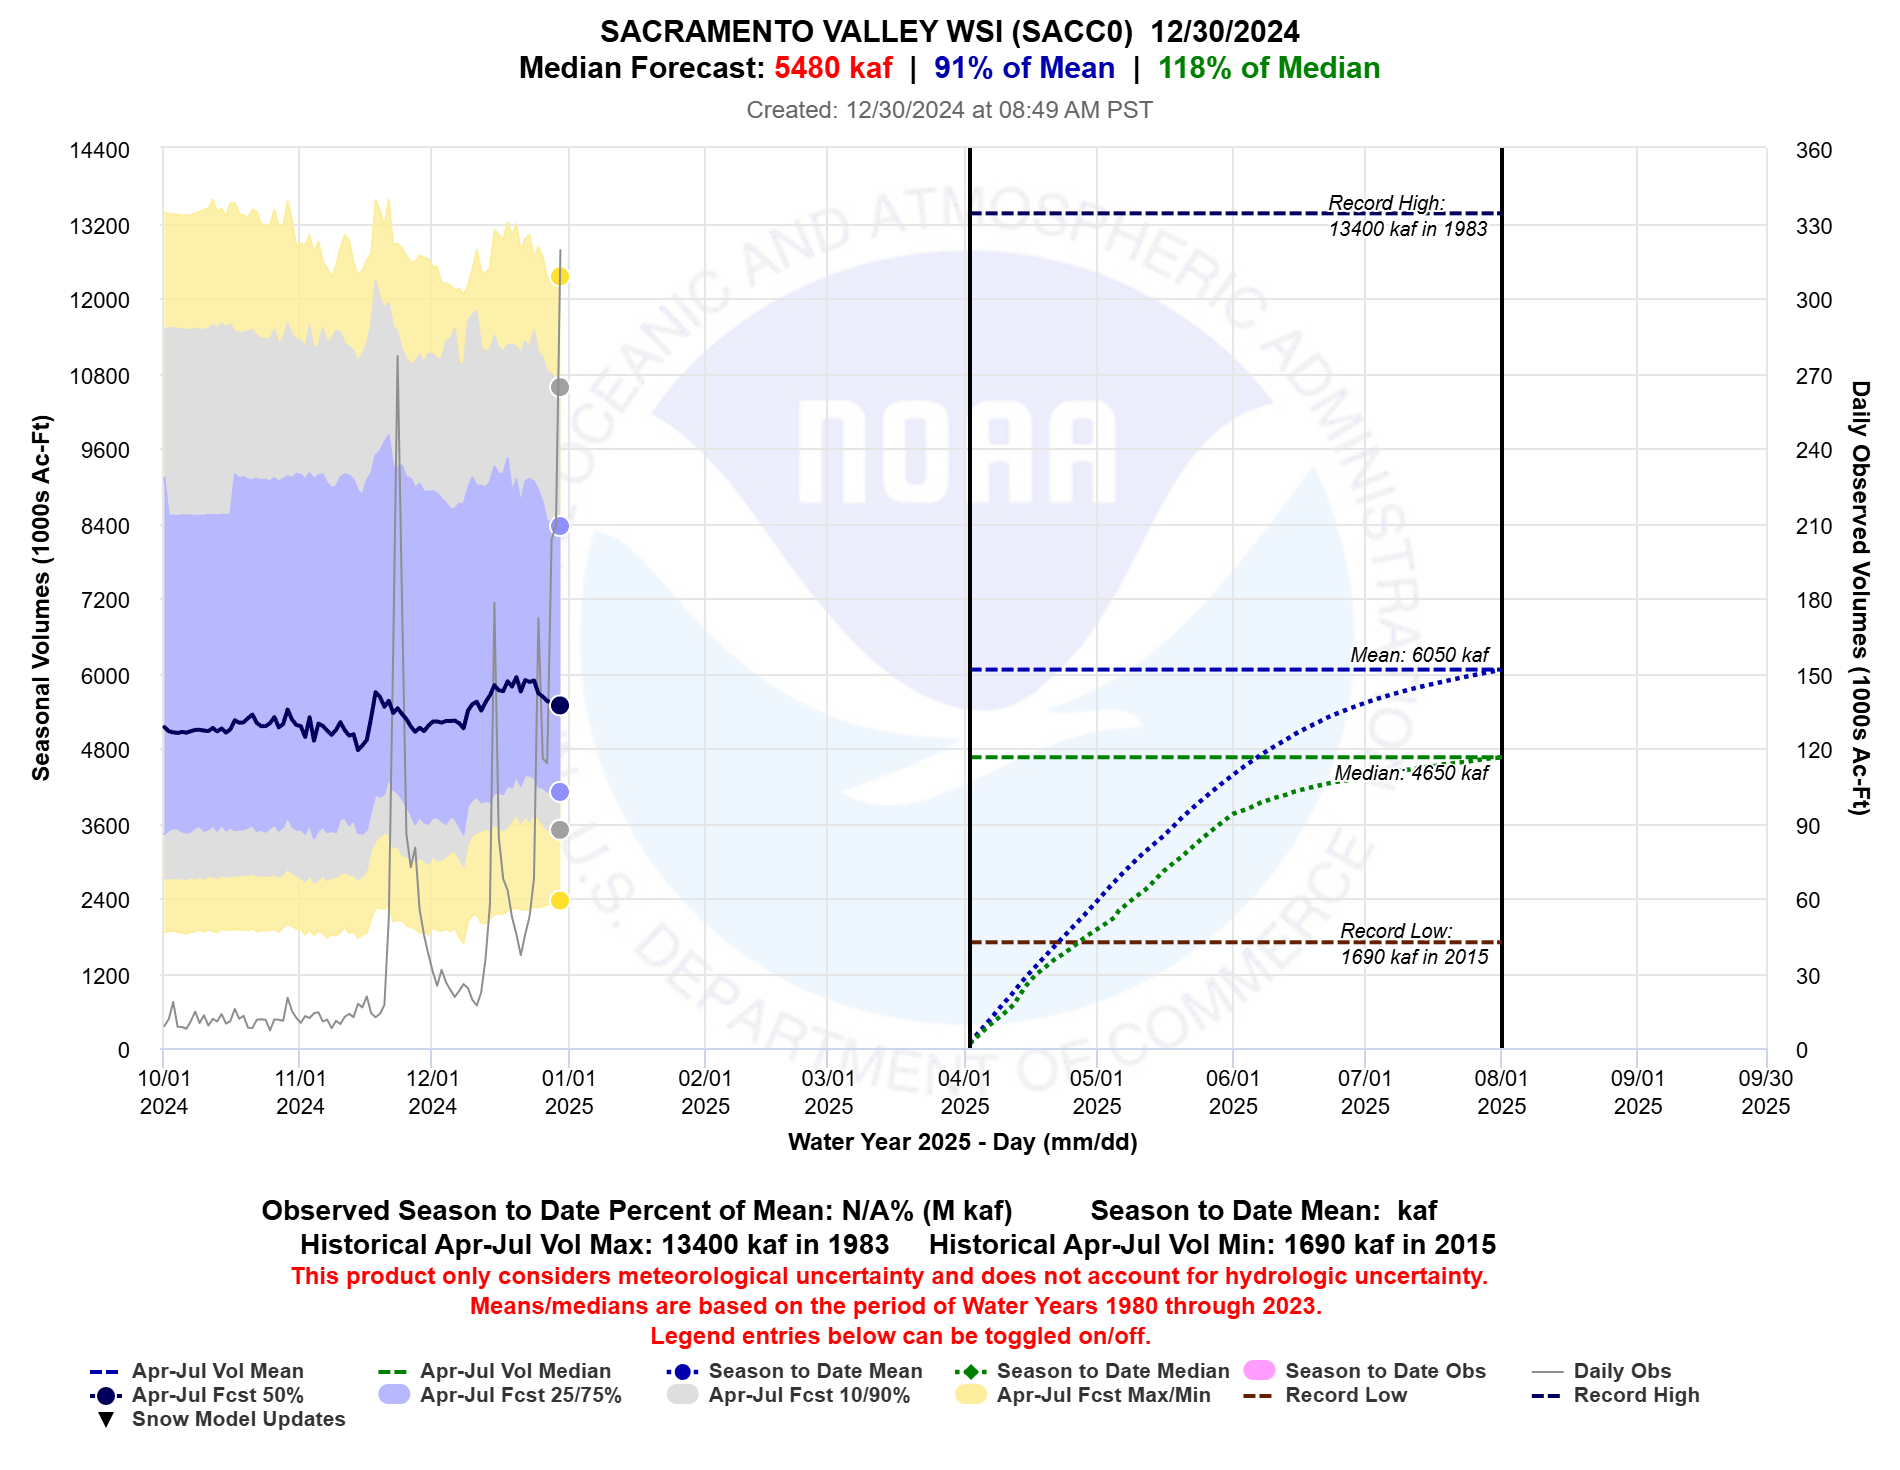
Despite a wet December, the April to July seasonal trend forecast for the Sacramento Valley water supply index has not changed much since the December 12th update (Figure 10). The median AJ forecast forecast is 5480 kaf or 91% of the mean and 118% of the median. While the overall 2025 water year forecast has increased (130% of WY median), the recent warmer systems and temperatures limited low elevation snow accumulation. Additional melt and runoff at lower elevations has somewhat contributed to a flat AJ trend compared to the December 12th starting point.
Figure 10: Trend plot for the Sacramento Valley water supply index. Source: CNRFC
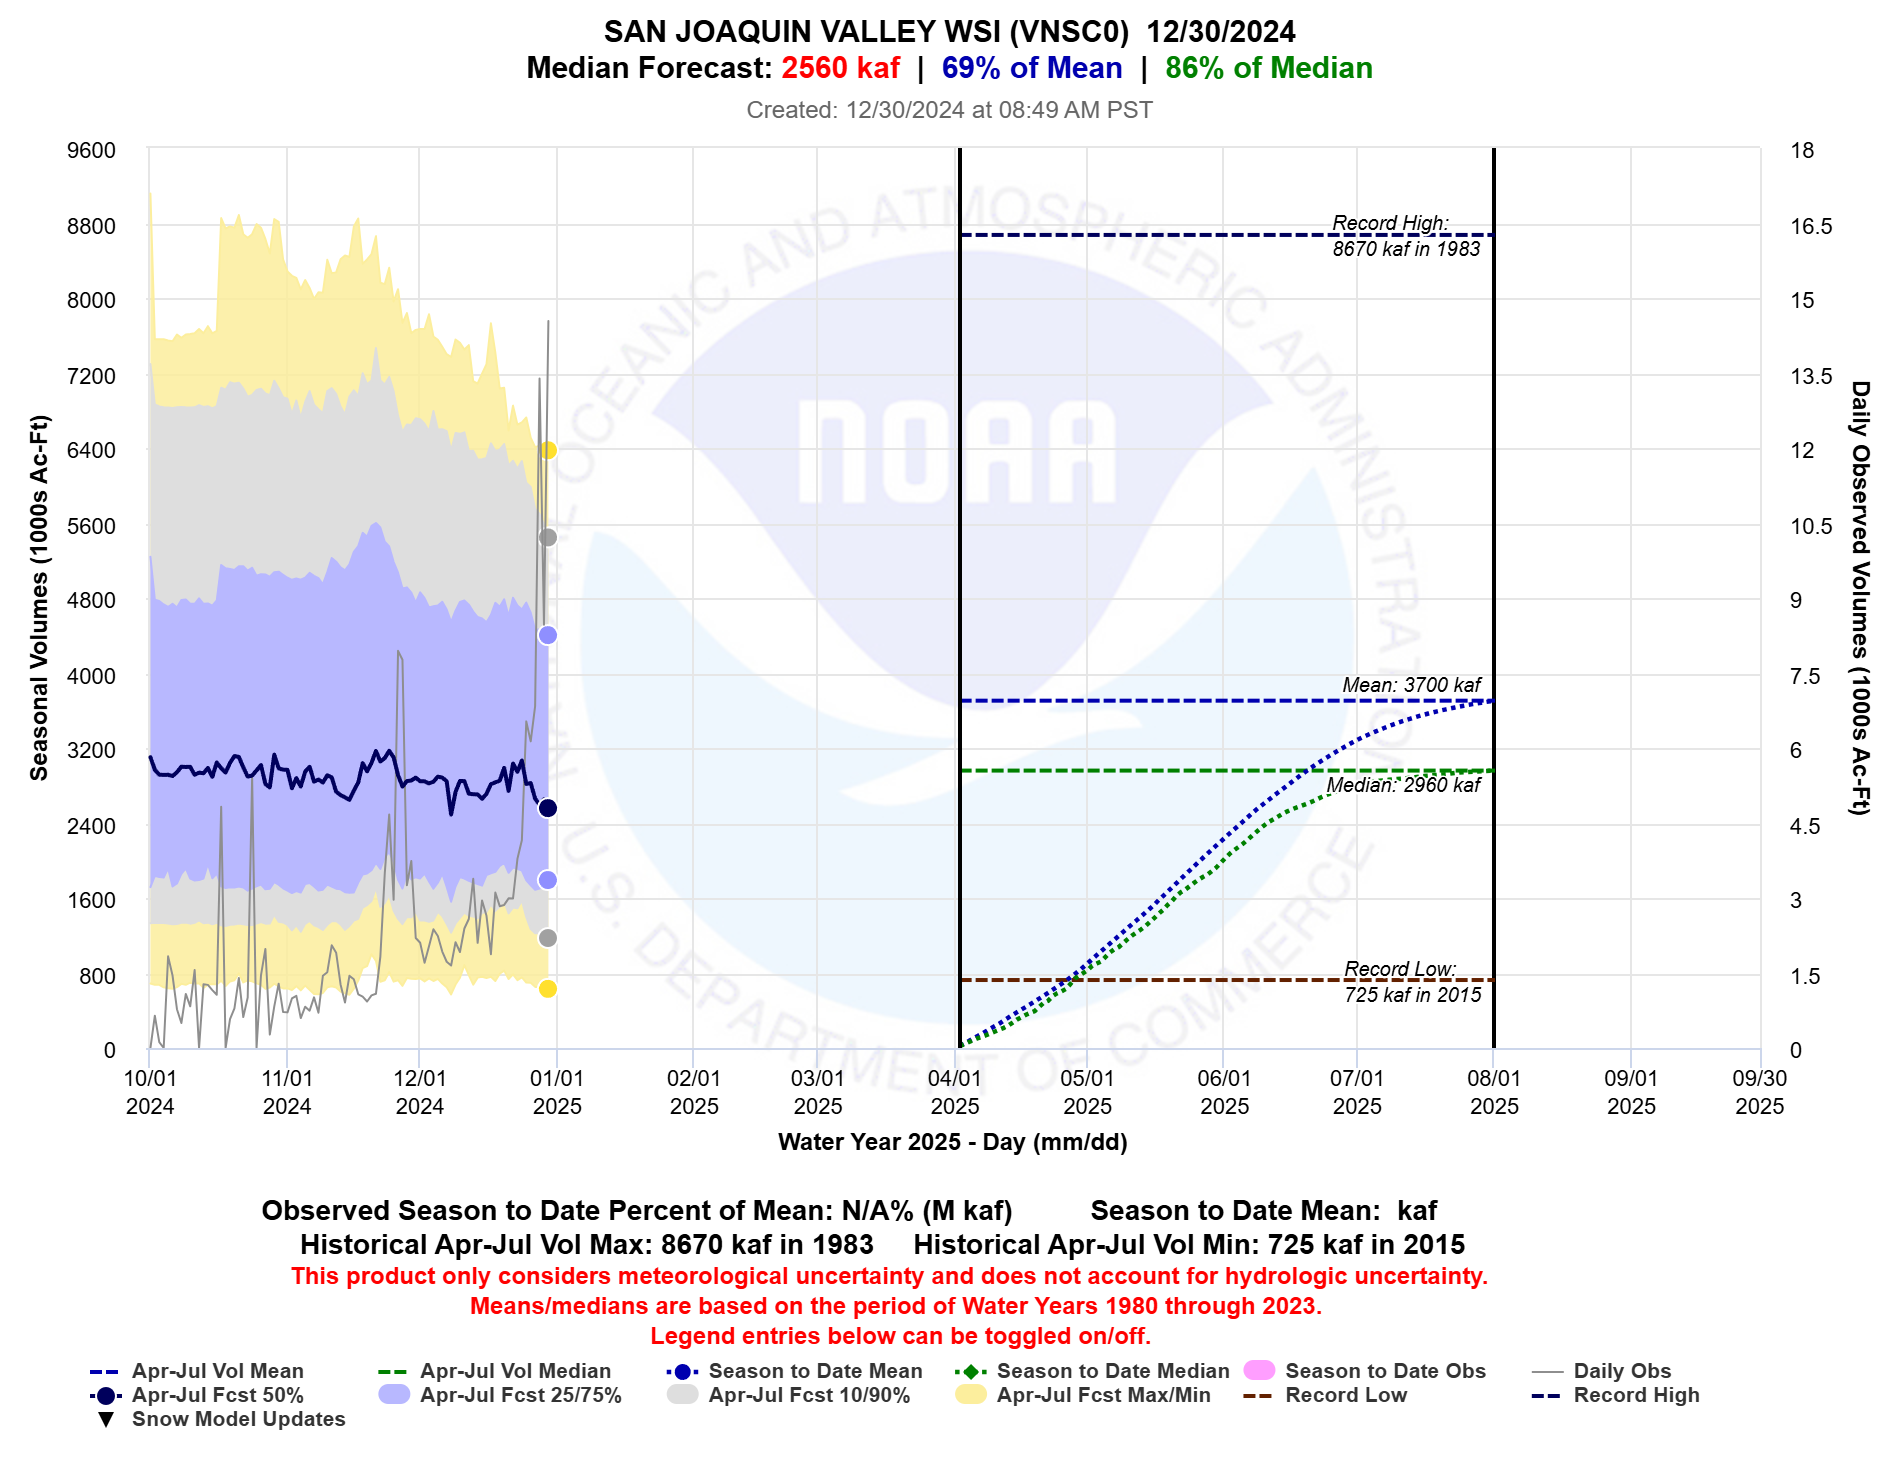
Likewise, the April to July seasonal trend forecast for the San Joaquin Valley water supply index has also exhibited a downward trend over the last week (Figure 11), with an AJ median forecast of 2560 kaf or 86% of the median. This is partly attributable to more runoff in the recent period due to warmer temperatures but also because the longer term meteorological forecast may be picking up drier periods in January. While the water year is off to a good start across Northern California it is important to remember additional storms are needed throughout winter to have a productive water year. Cold systems are needed to continue building snowpack throughout the Sierra and potential upcoming drier periods in January need to be monitored.
Figure 11: Trend plot for the San Joaquin water supply index. Source: CNRFC