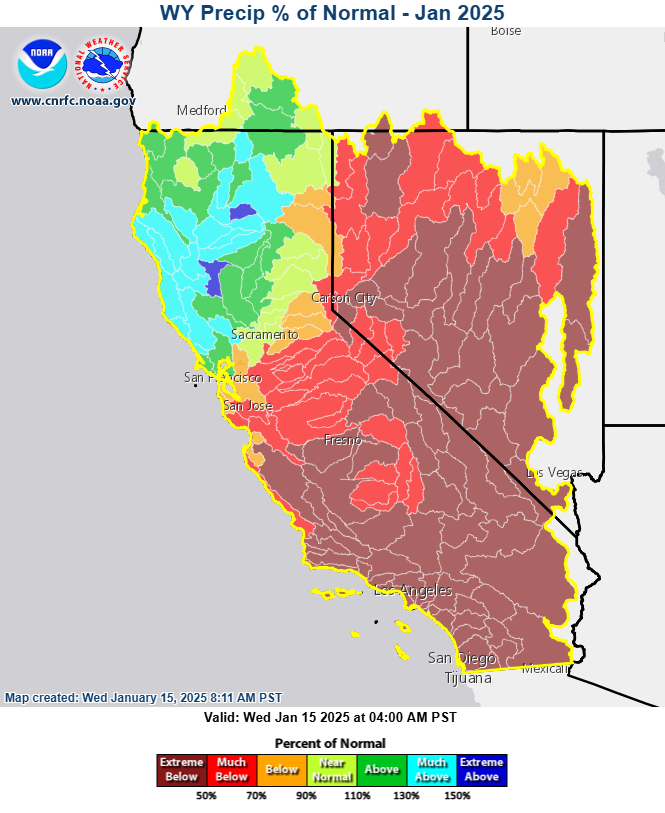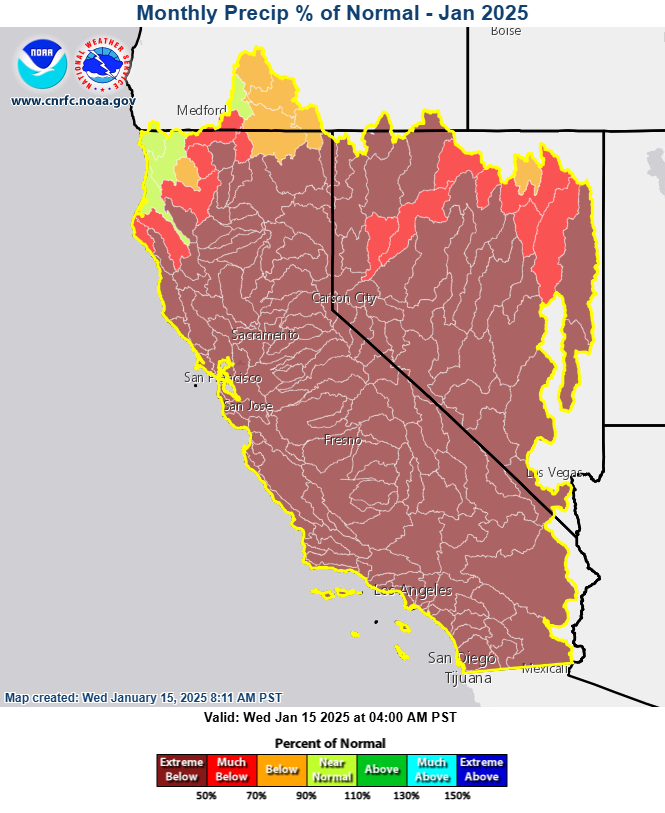
After a few wet days across northern CA early in January, a quiet pattern has persisted for the past week and a half or so. Most of the region has seen far below average precipitation this month except for the far NW portion of CA and portions of the Klamath River basin.
Image above: Jan 1-15, 2025 percent of average precipitation. Source: CNRFC
Thanks to the wet first half of the water year, northern CA precipitation for the water year to date remains near to above average, while the remainder of the region has seen less in the way of storm activity and remains below average.
Image above: October 1, 2024 through January 15, 2025 percent of average precipitation. Source: CNRFC
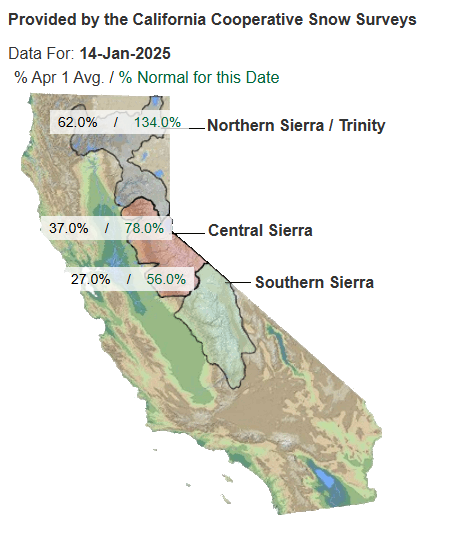
Snowpack across different regions of CA follows a similar pattern to the water year precipitation, with well above average snowpack for the northern Sierra/Trinity region and below average conditions across the central and southern Sierra.
Image above: Percent of average snow for various CA regions. Source: CDEC
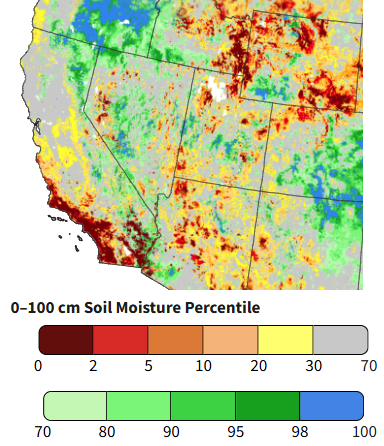
Soil moisture estimates are generally near median or above 70th percentile in northern CA and portions of NW and SW NV, and below median in central CA and parts of NV, and very low mainly over southern portions of CA.
Image above: 0-100 cm Soil Moisture Percentile. Source: drought.gov
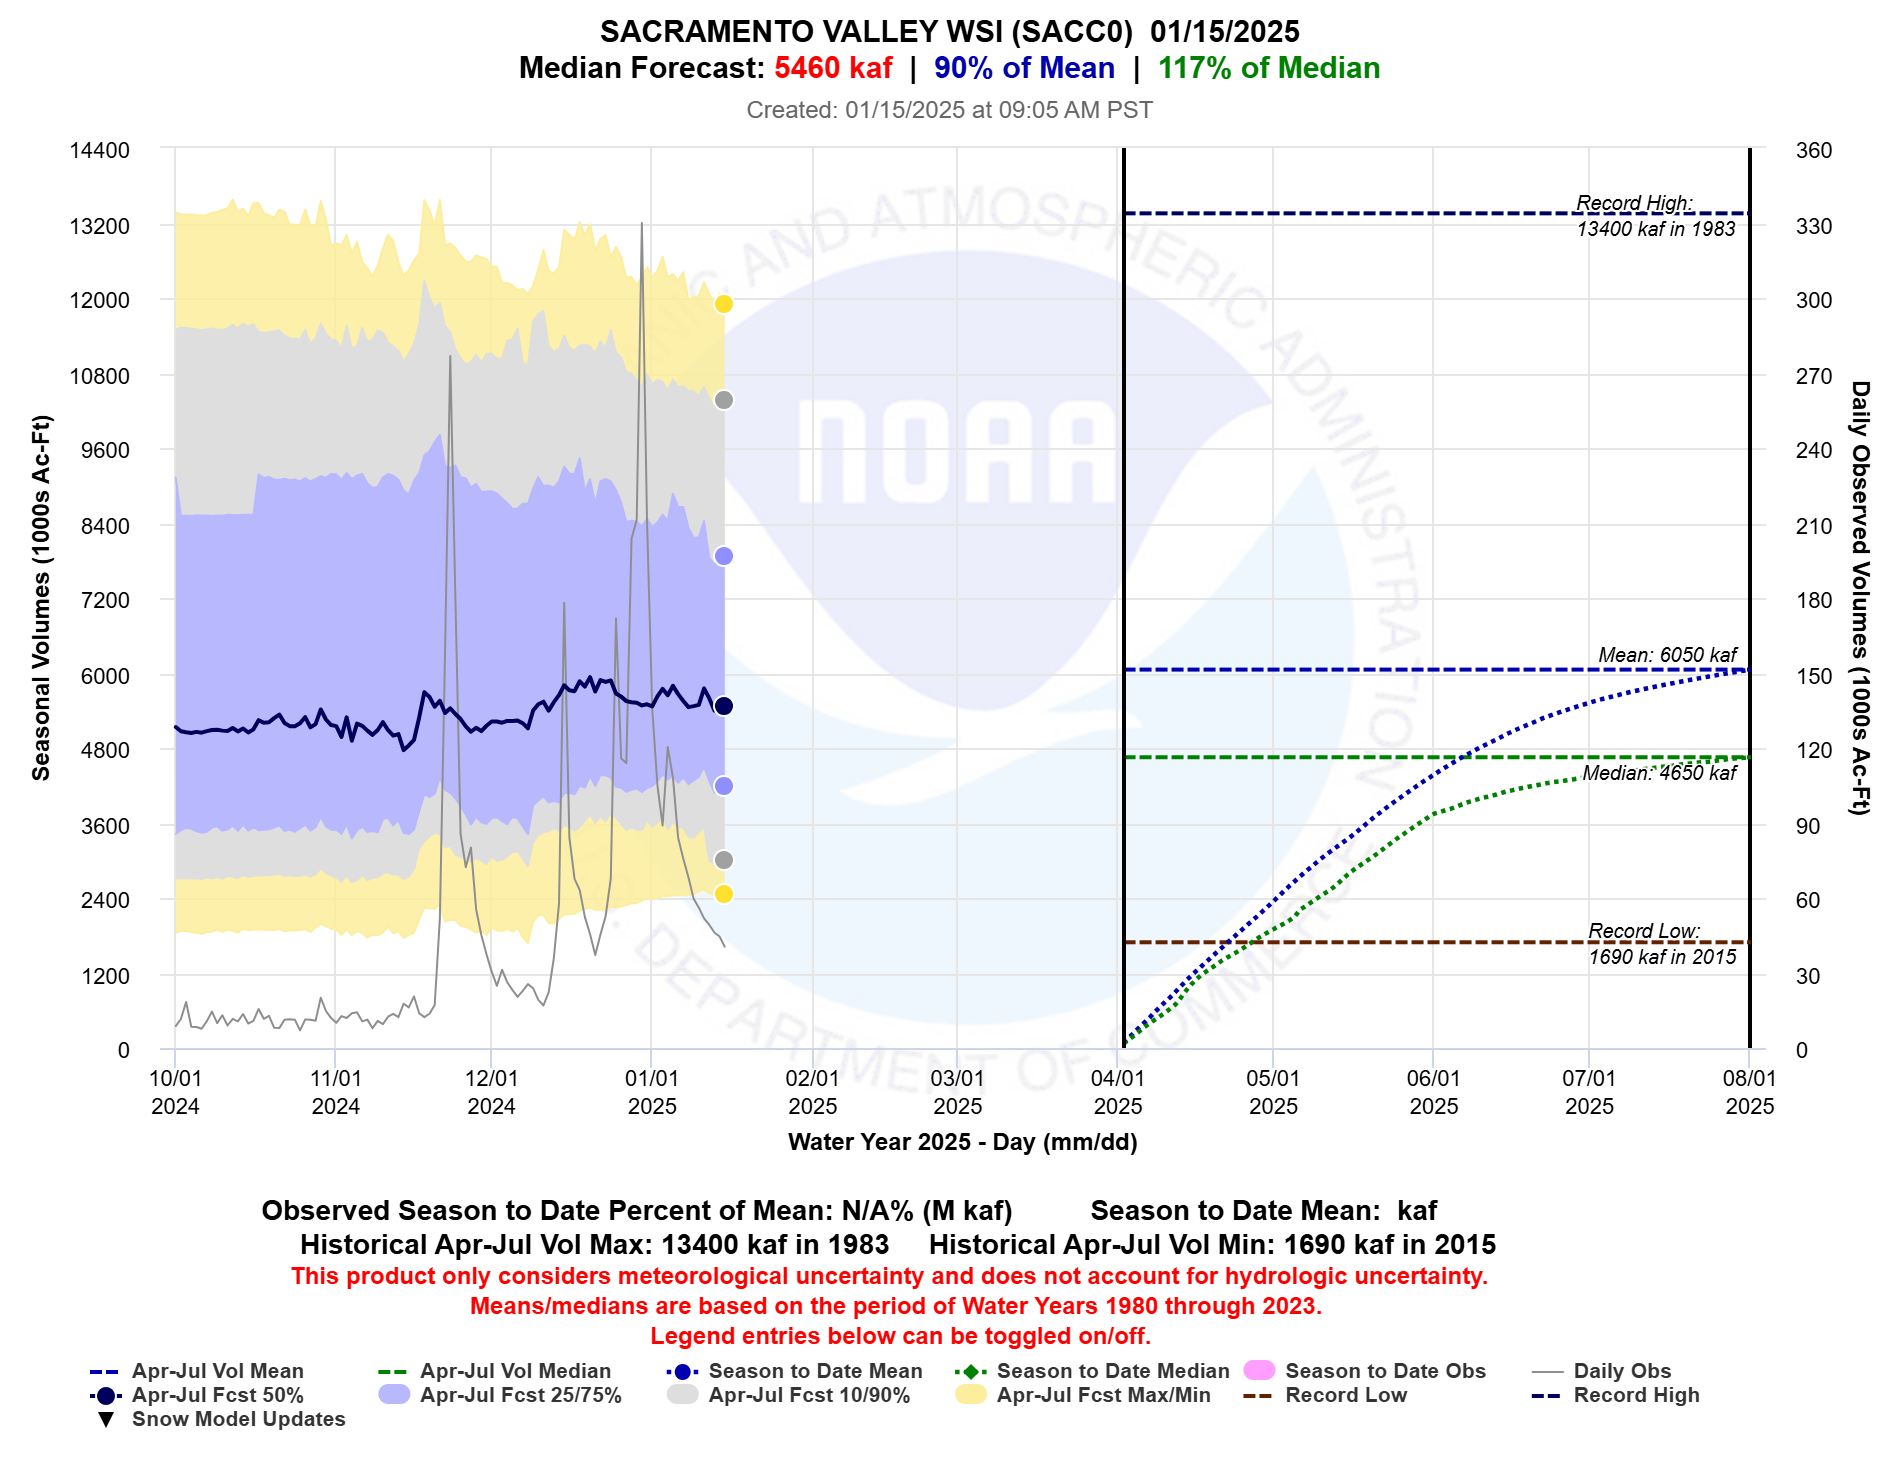
Despite the dry start to January, the Sacramento Valley Water Supply Index (shown below) and San Joaquin Index (not shown) have shown little change in 50% and higher exceedance forecasts. 25% and low exceedances have shown a declining trend over the past couple weeks.
Image above: Trend plot for the Sacramento Valley Water Resources Index. Source: CNRFC
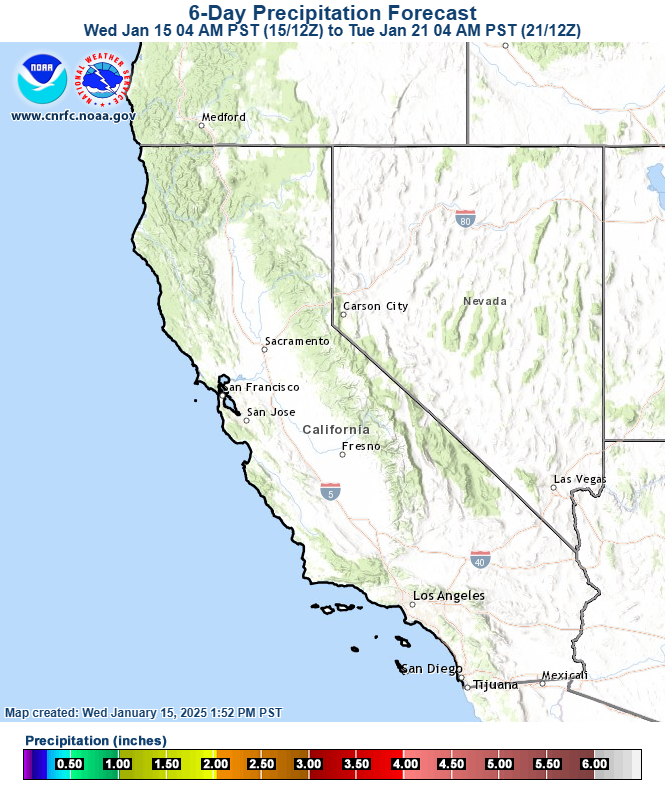
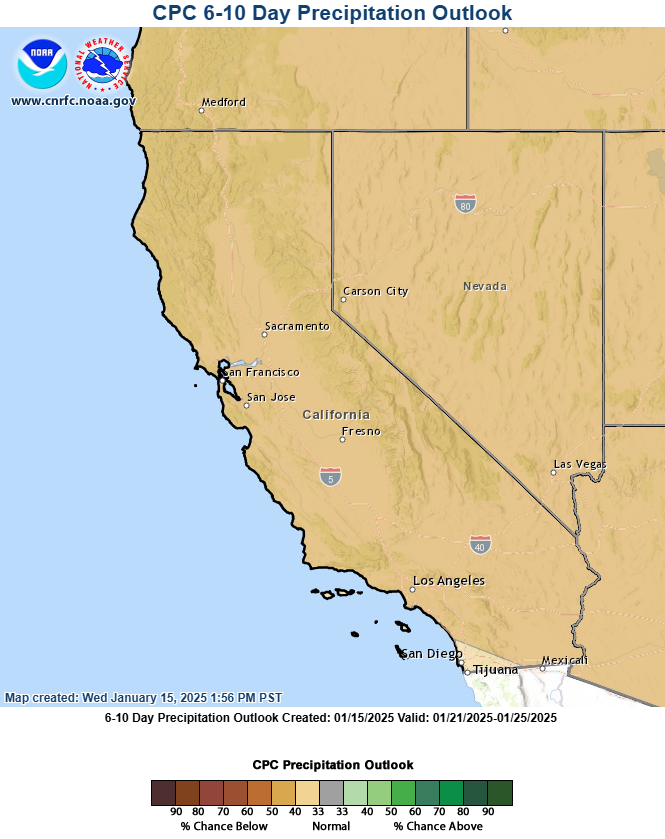
Looking ahead, models continue to indicate a good chance of below-average precipitation continuing at least the next week and a half and perhaps 2 weeks.
Images above: Left: Precipitation forecast for the next 6 days (source: CNRFC). Right: Precipitation outlook for days 6-10 (source CNRFC, data from CPC).