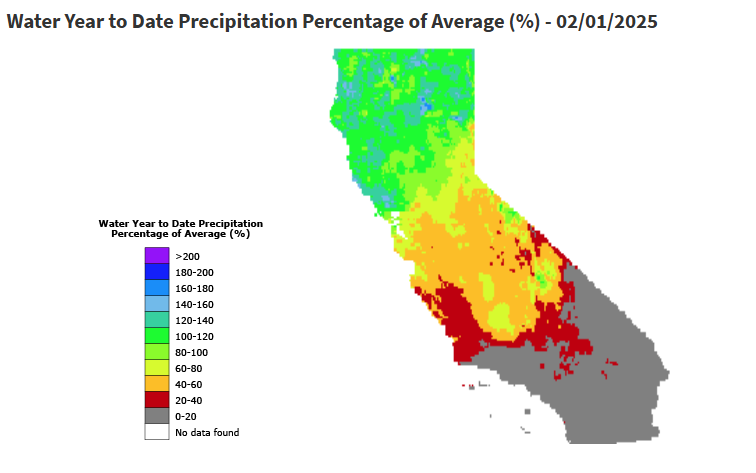
Water year 2025 had a wet start for Northern CA beginning in late November when a potent atmospheric river brought significant precipitation to much of California. Northern CA also fared well in December tracking near normal for the 8-station index. However, the stark contrast between Northern CA, roughly north of I-80, and the Central/Southern Sierra continues. The image below shows water year percent of normal through February 1st.
*source CA Department of Water Resources California Water Watch website
It appears California’s New Year’s resolution was a dry January! The three Sierra precipitation indices were all near record lows. During this period, the seasonal runoff forecasts dropped significantly. The Central Valley index fell over a million acre-feet during that time.
The current storm has once again been very beneficial for Northern CA, but it has also resulted in modest gains in the Central Sierra, and more is expected over the next 6 days ranging from 8-10 inches in the Northern Sierra to 5-6 inches in the Central/Southern Sierra.
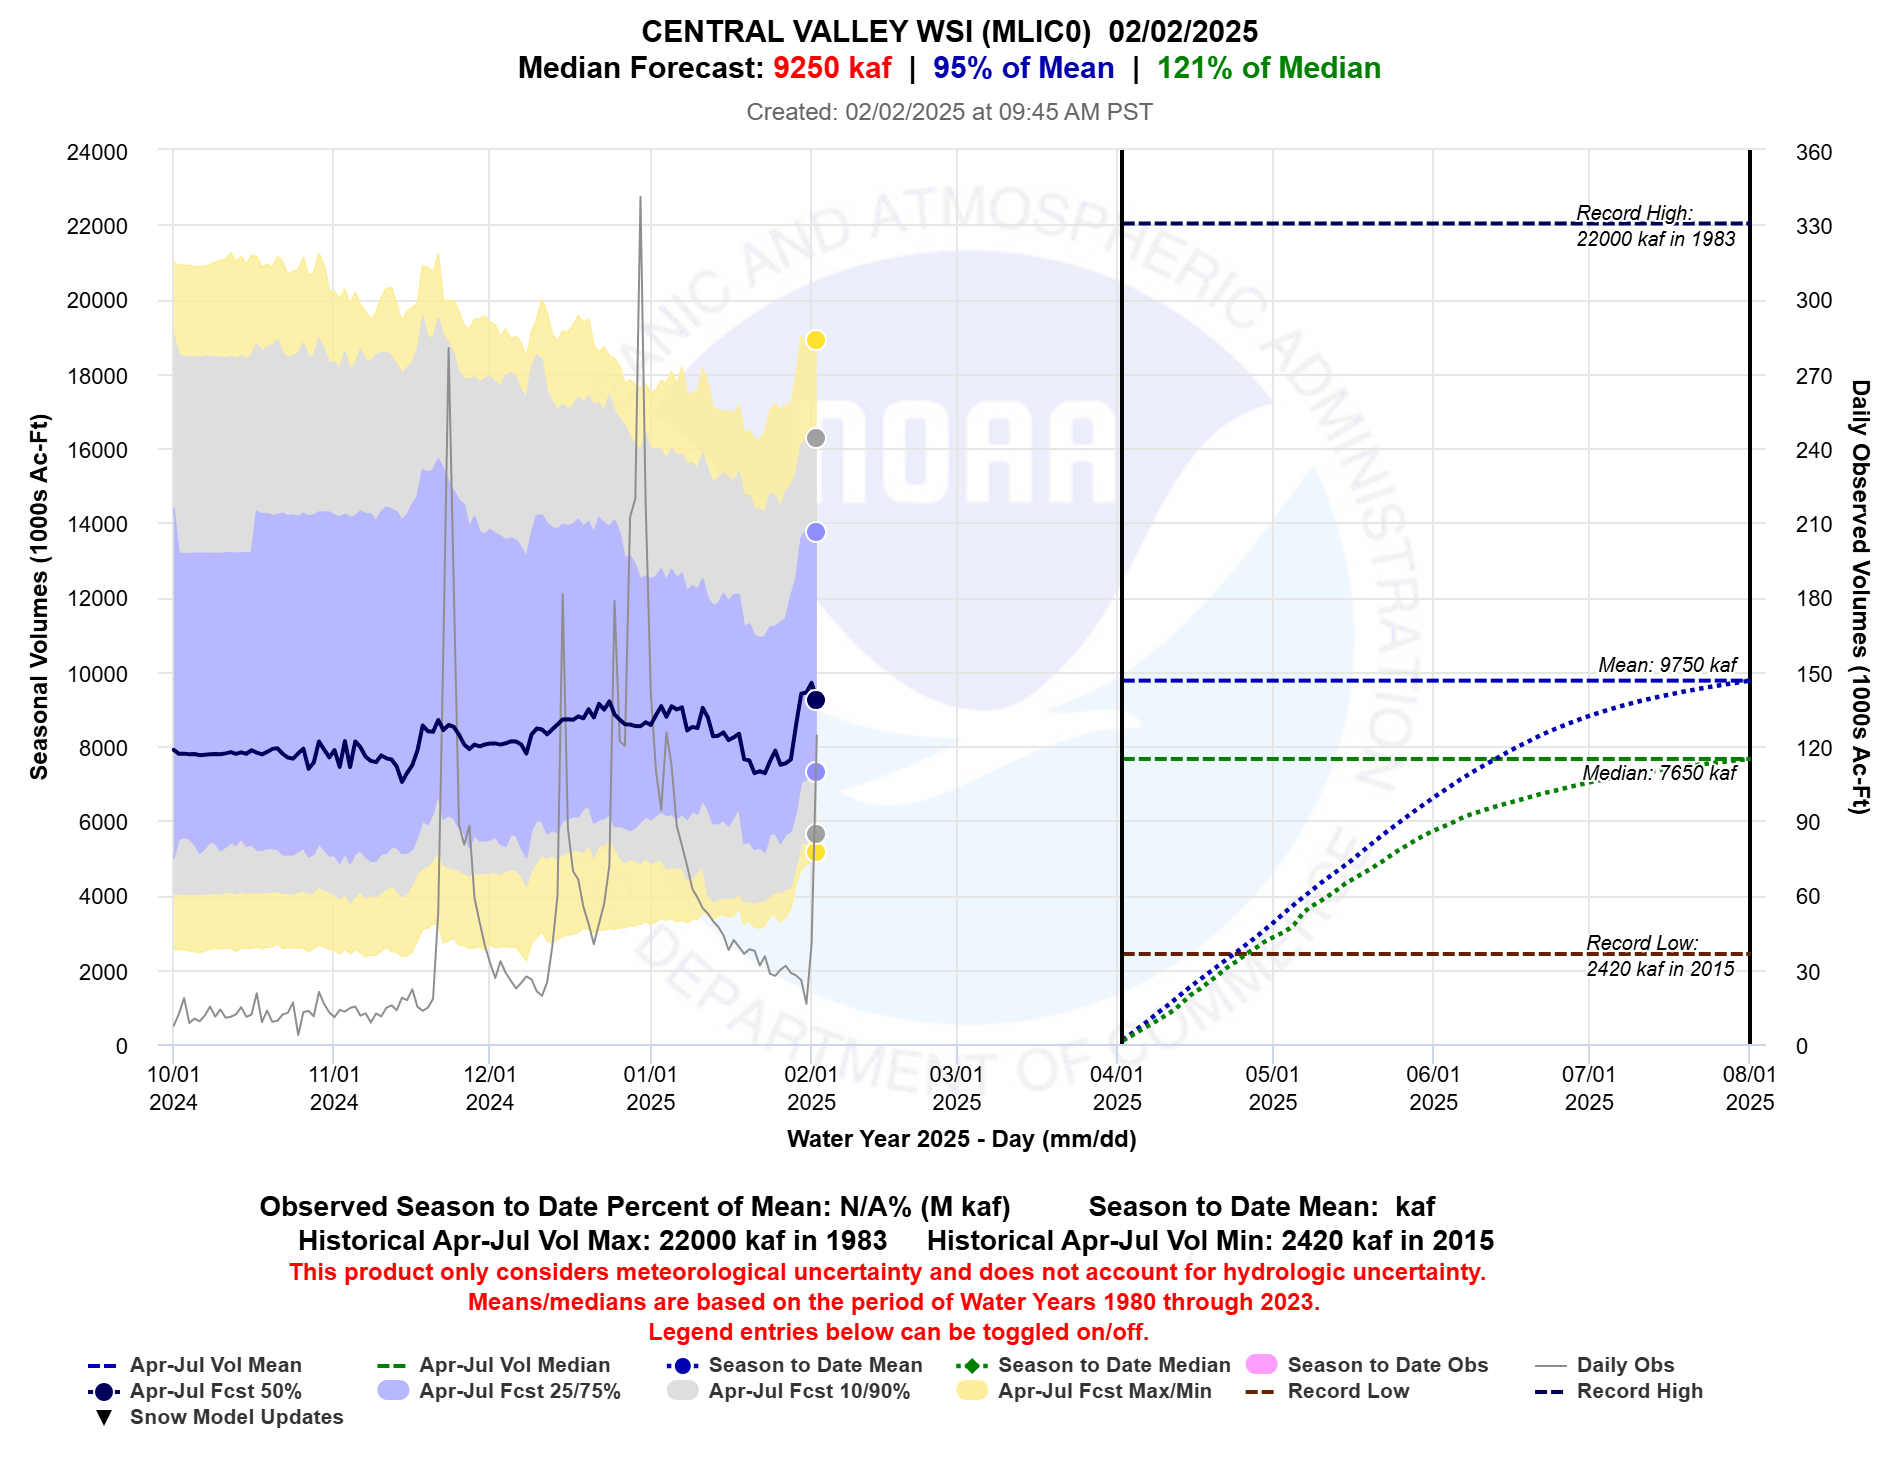
The wet start to February started impacting the long range water supply forecasts in late January as the models began to pick up on the strong AR approaching. Over that time, the Central Valley index April-July runoff forecast increased by over 1.5 million acre-feet (see image below). Even areas in the Southern Sierra have seen increases. Friant April-July runoff forecast has increased nearly 200 TAF from late January to Feb 3rd.
*source CNRFC Water Supply Forecast website.
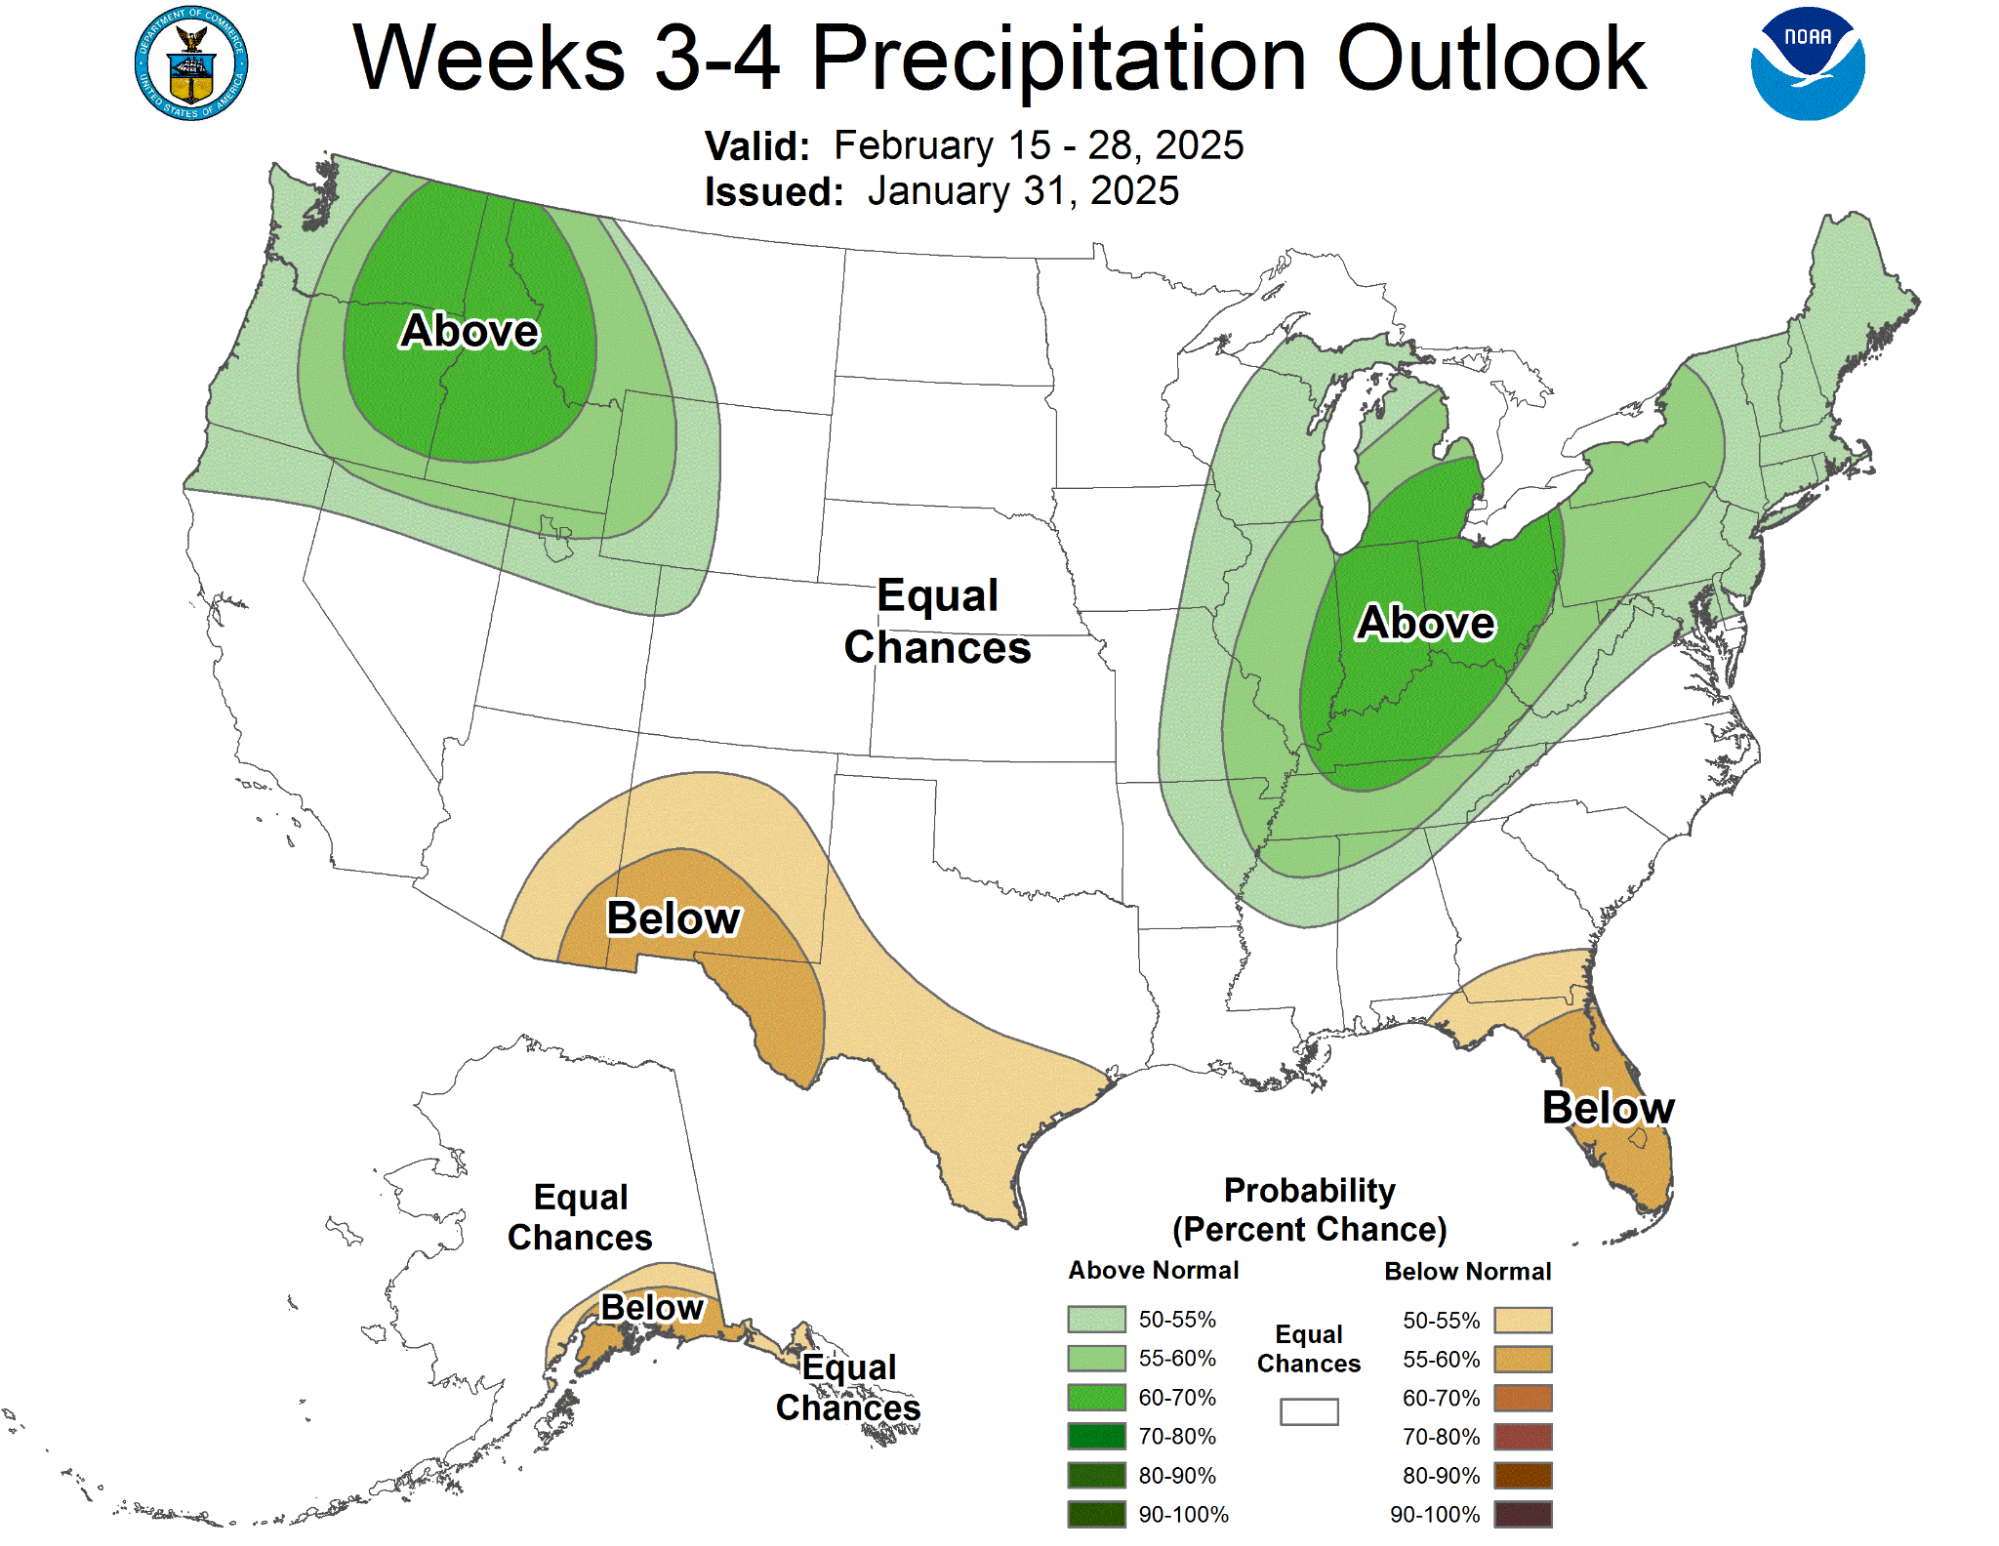
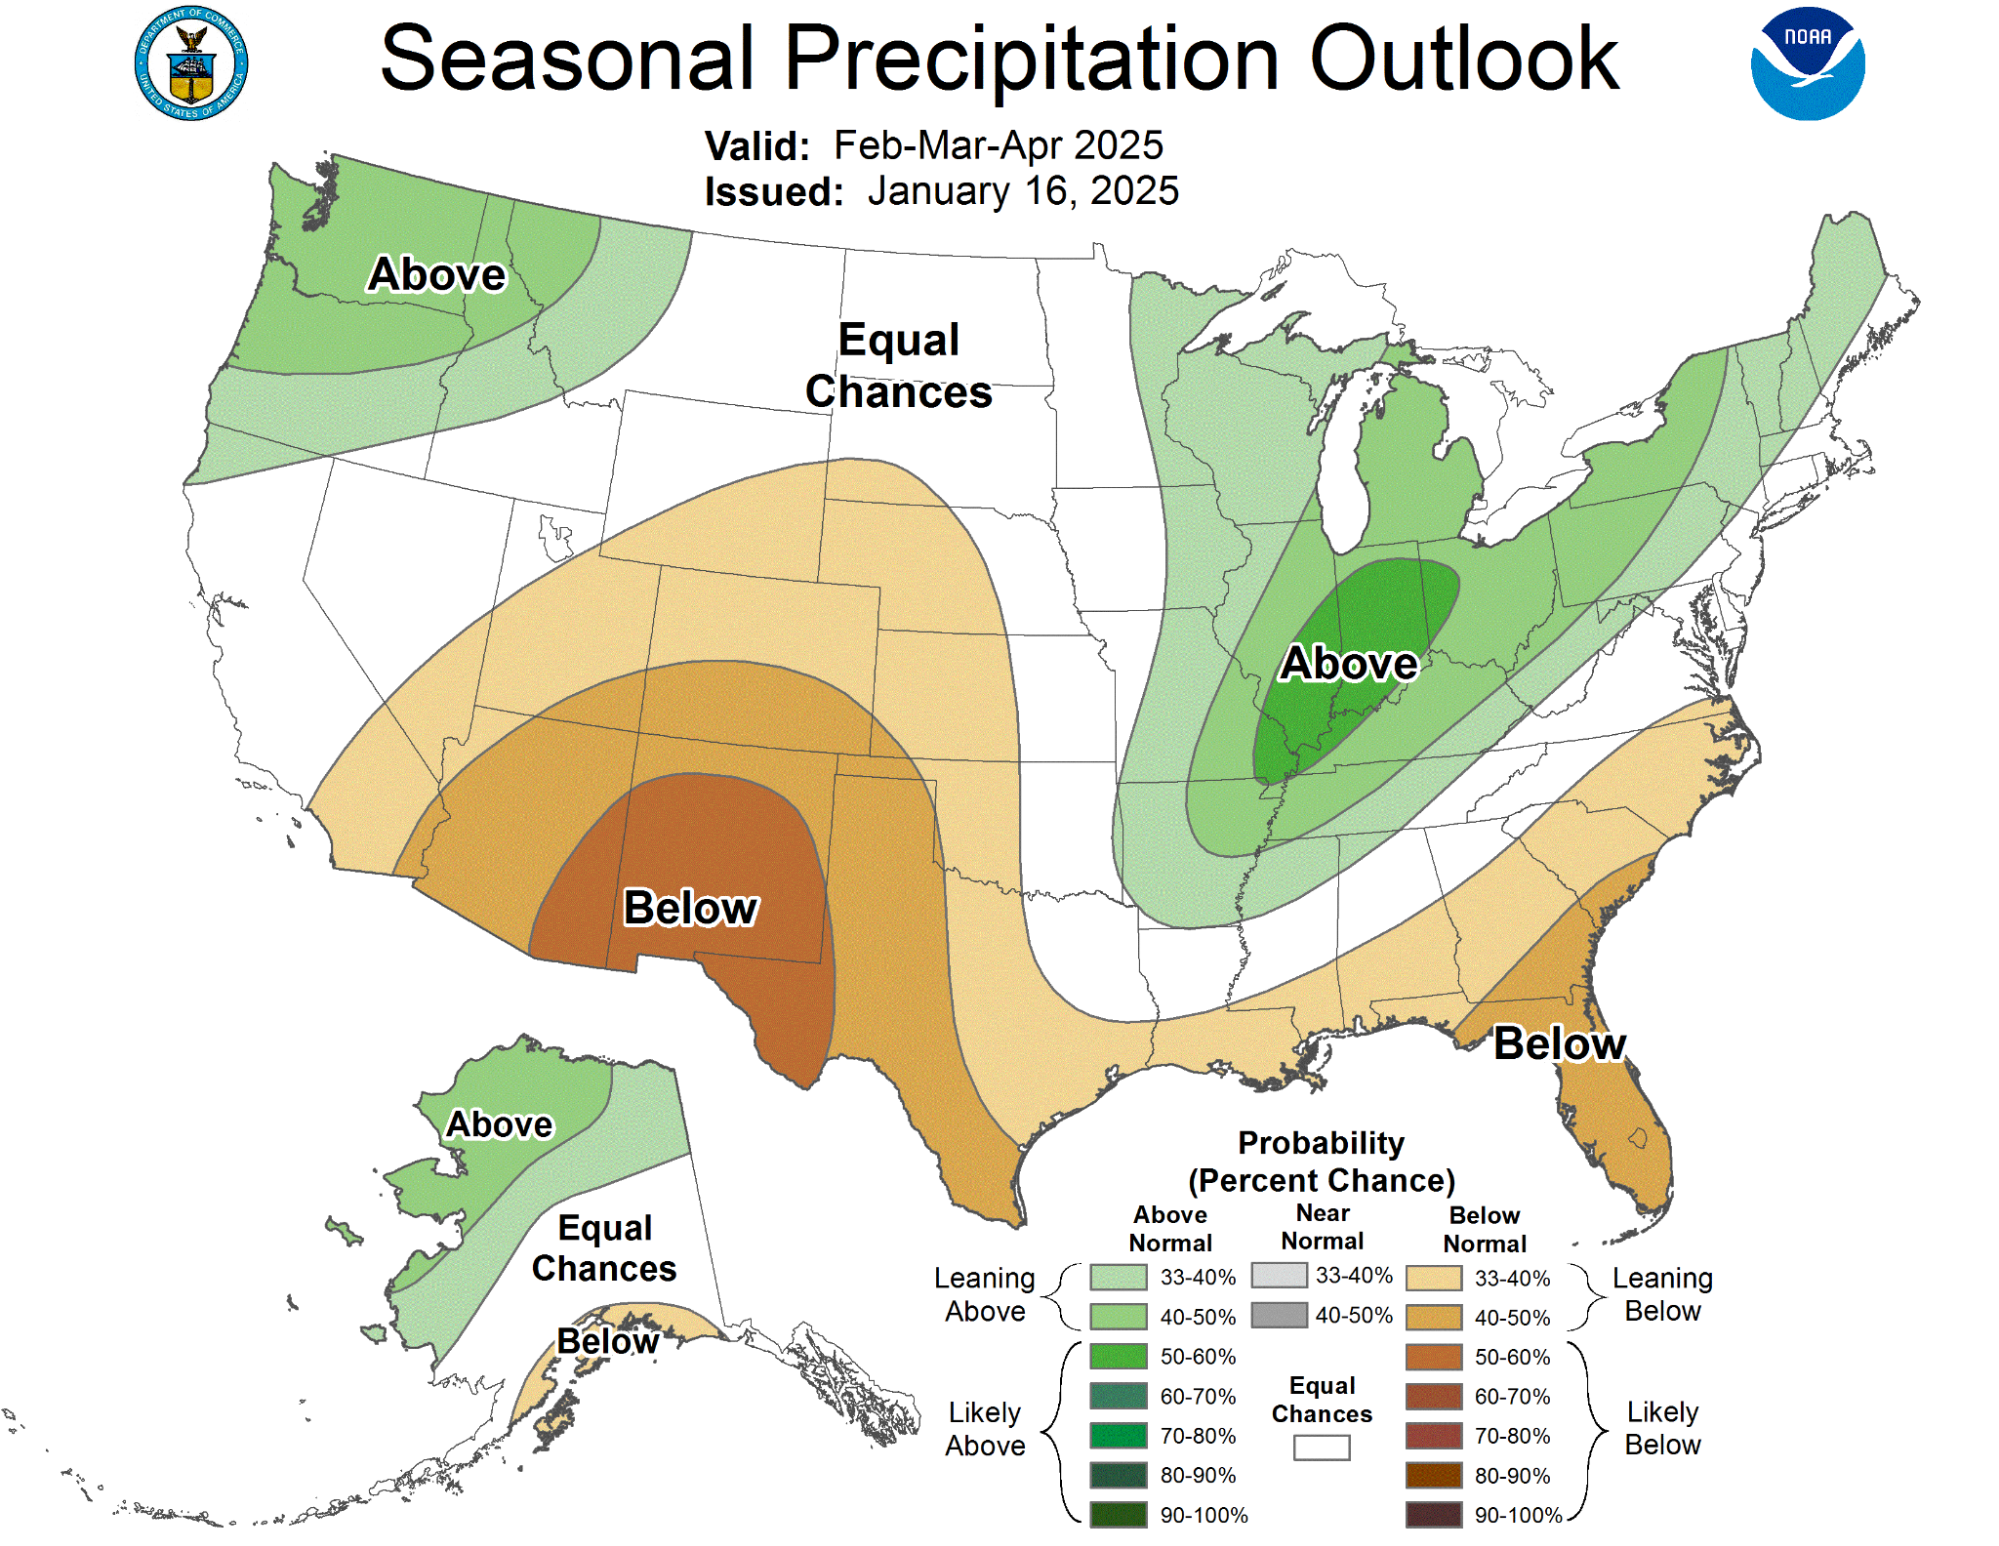
Beyond the current storm, the longer range forecasts are not indicating a strong trend in either direction, wet or dry. According to CPC, the week 3-4 period generally has equal chances over CA/NV, and the seasonal (Feb-Apr) outlook has a similar trend.
*source NOAA Climate Prediction Center
*source NOAA Climate Prediction Center
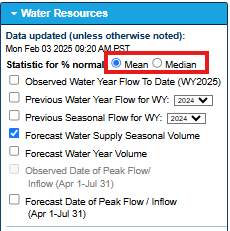
Lastley, we’d like to mention an enhancement we’ve made to our water resources page. Some partners have asked for the option to display map-based values as percent of median along with the percent of average. These options can now be controlled through buttons in the Water Resources expandable menu (see below).