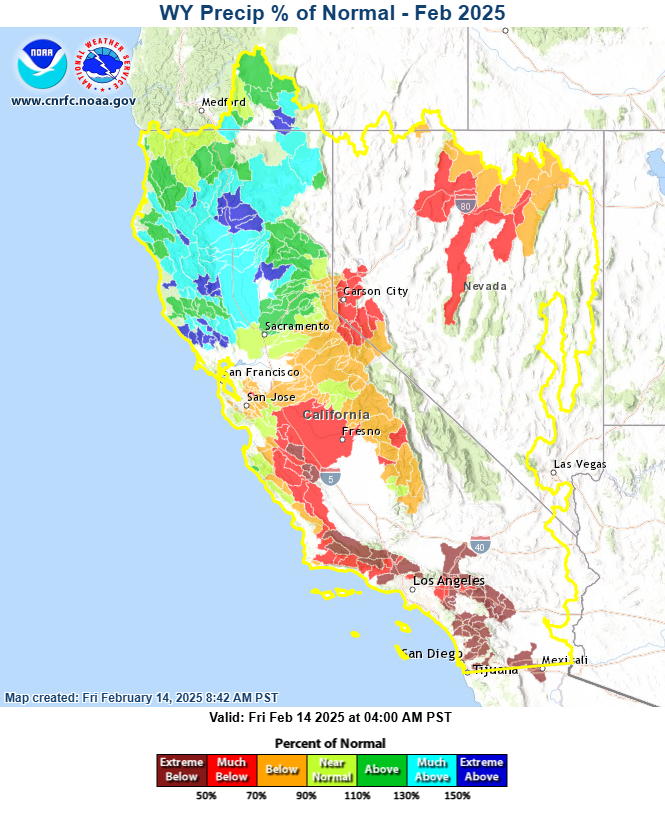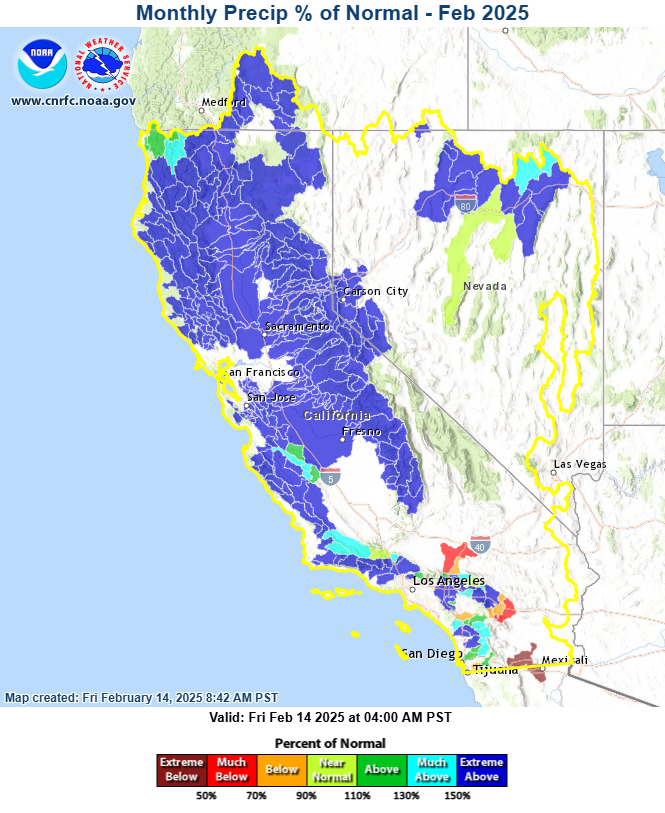
February precipitation during the first 13 days has been well above average in most regions.
Figure 1a February-to-date precipitation through February 14, 2025 at 4 AM PST. Source: CNRFC
Despite the good start to February, most of Central and Southern watersheds are still below average for the water year.
Figure 1b WY-to-date precipitation through February 14, 2024 at 4 AM PST. Source: CNRFC
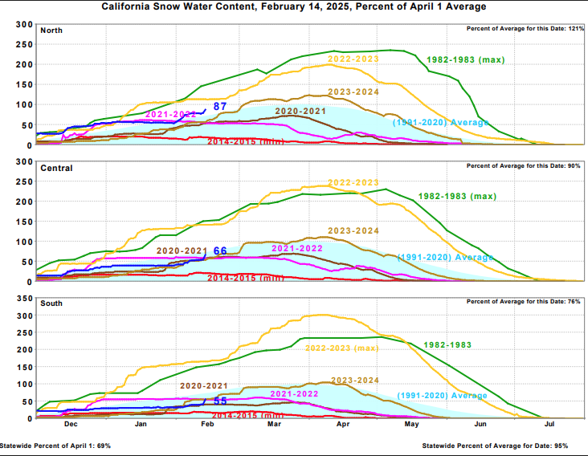
On Jan 31, Statewide water content stood at 10.7 inches (66% of average). The first 13 days of February brought the statewide value up to 18.1 inches (95%of average), an increase of 29%!
Figure 2 CA snow water content by region. Source: CA Department of Water Resources
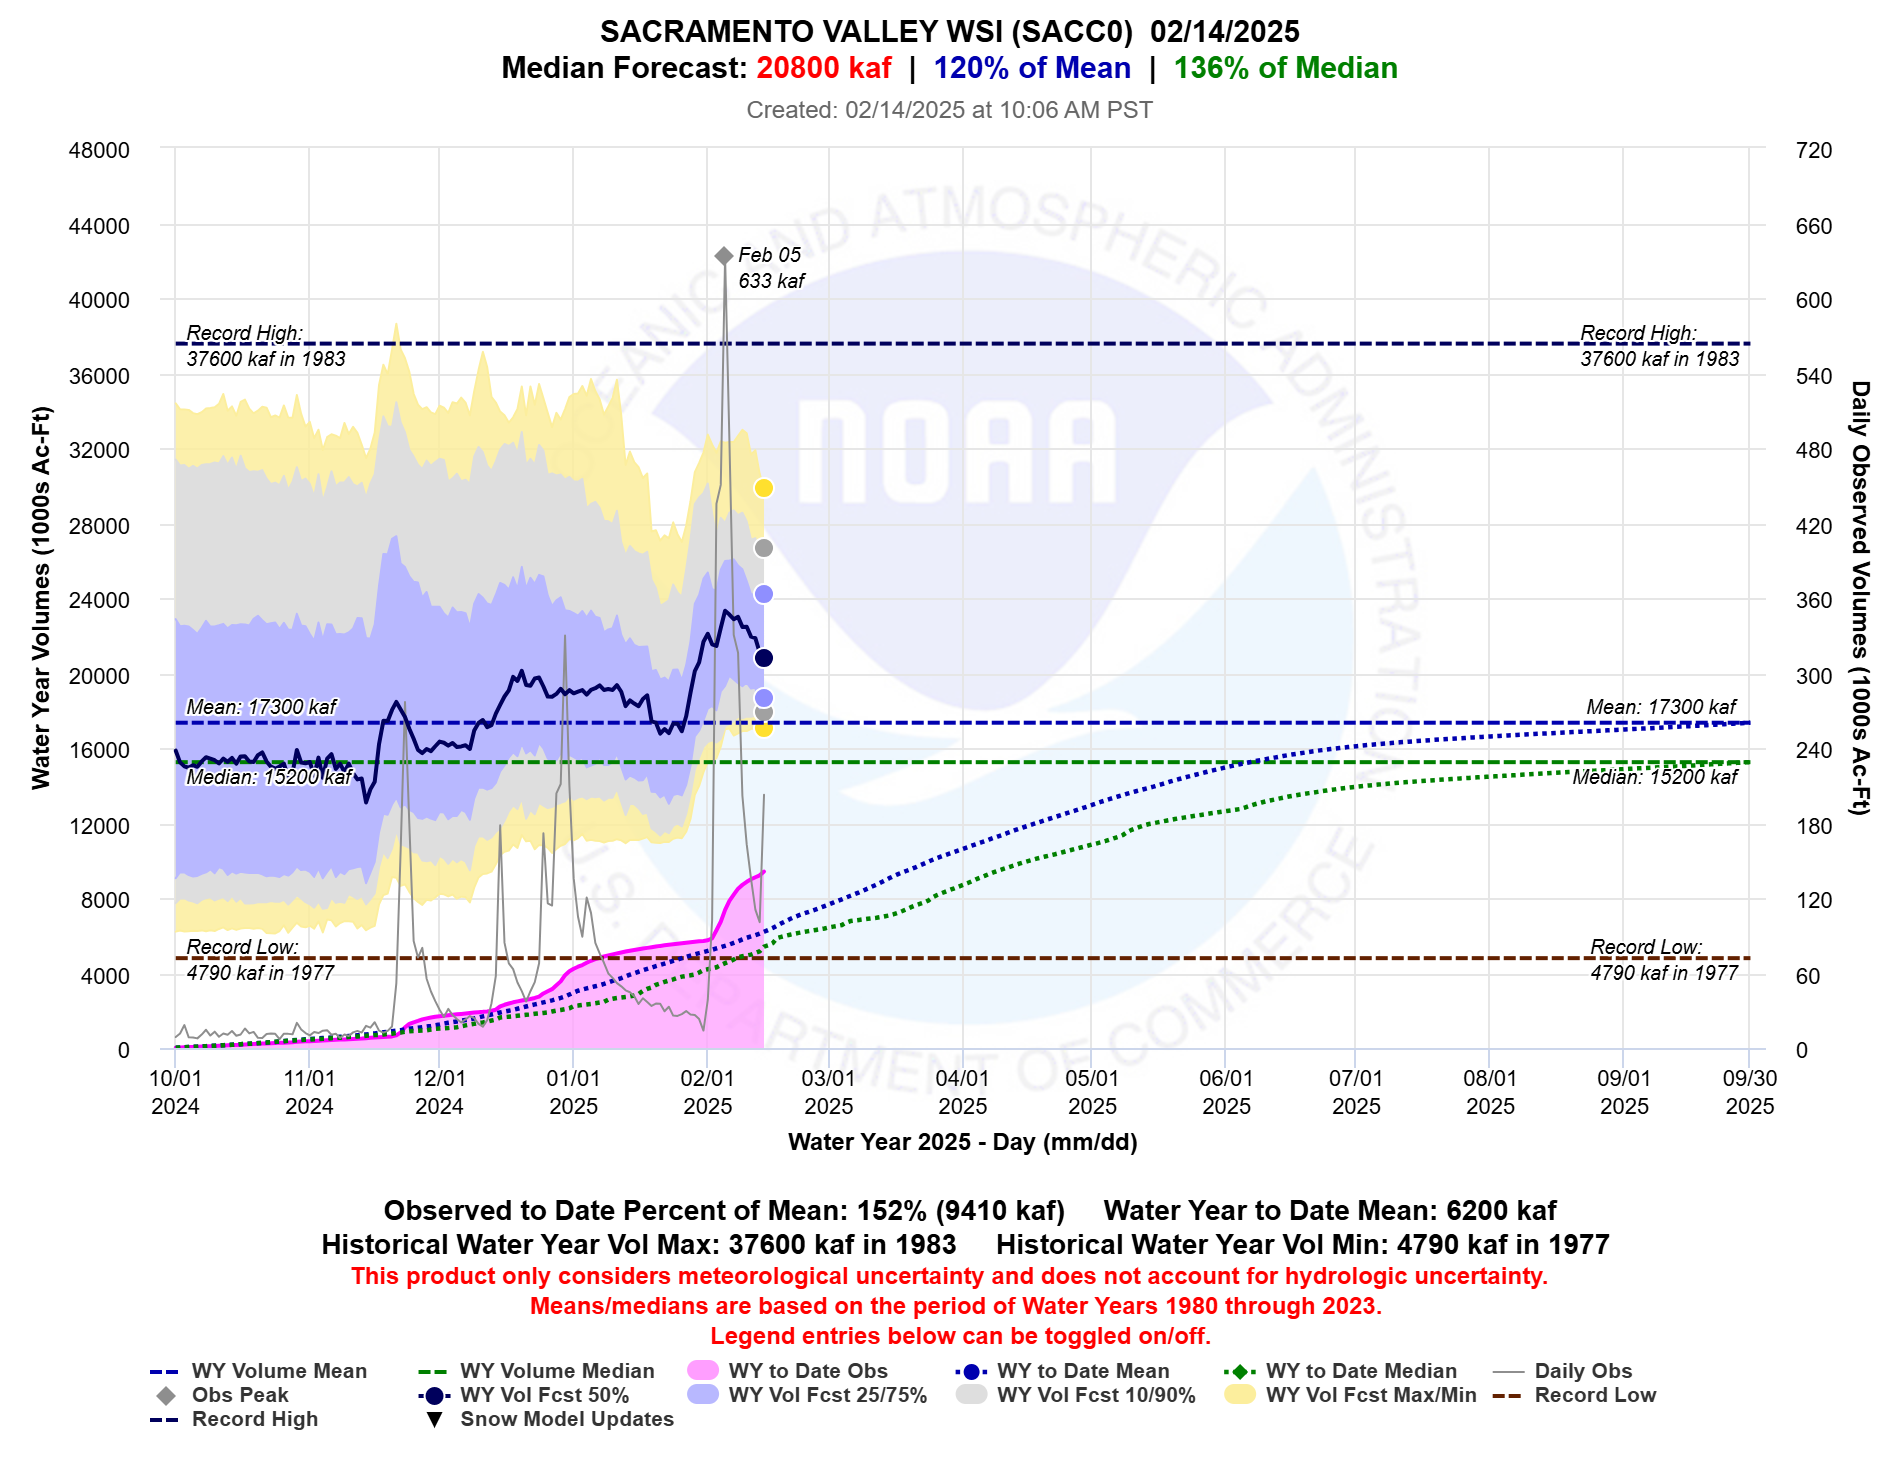
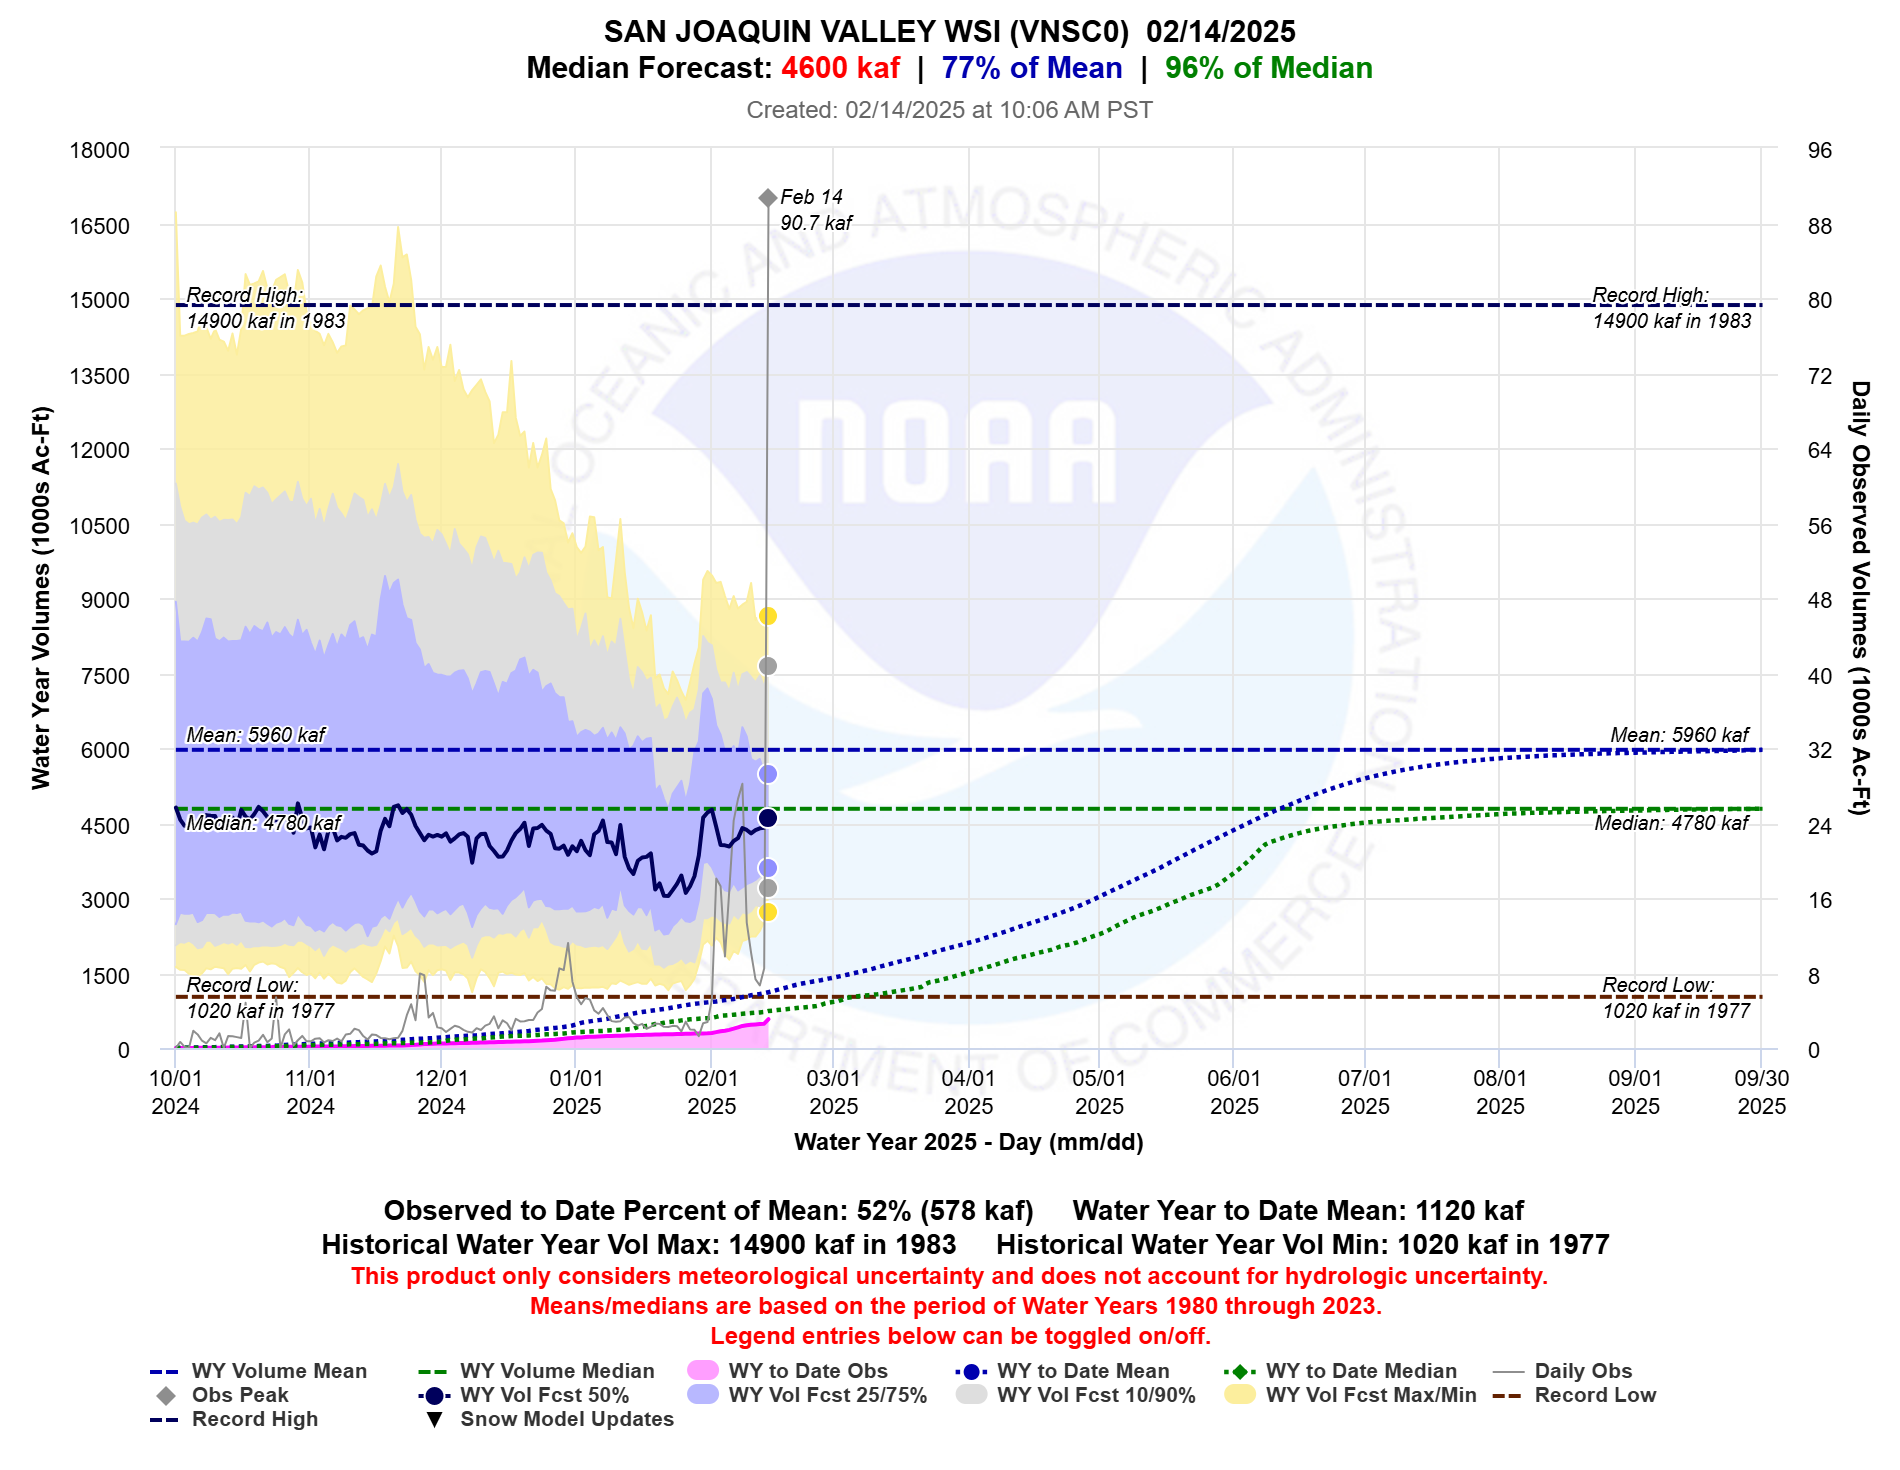
Trends in the water year forecasts for the Sacramento and San Joaquin Valley Water Resources Index locations are trending upward. Today the Sacramento Water Supply Index forecast reached 120% of average, but the San Joaquin Index is only at 77% of average.
Figure 3a Water year forecast trends for the Sacramento Valley Water Supply Index. Source: CNRFC
Figure 3 Water year forecast trends for the San Joaquin Valley Water Supply Index. Source: CNRFC
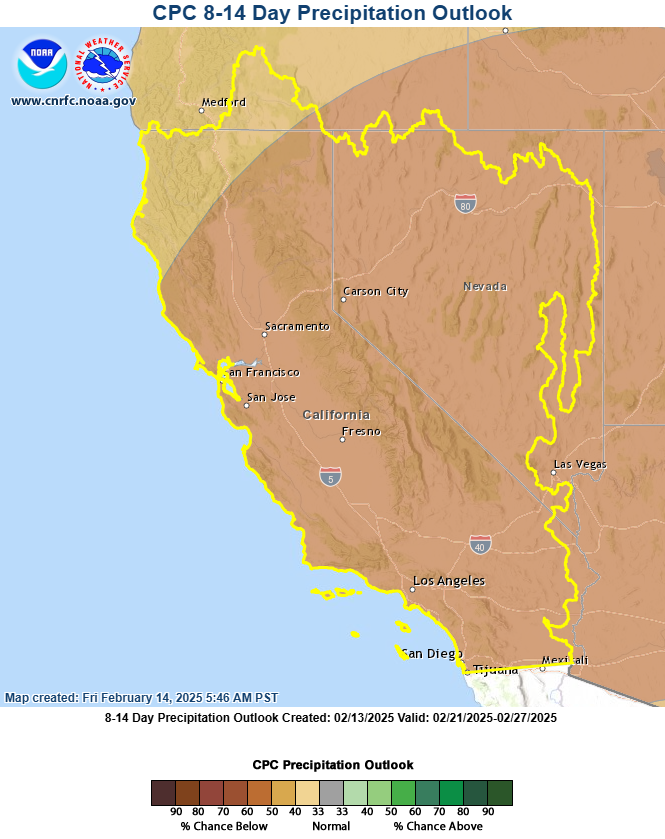
The second half of February is expected to be much drier than average according to the Climate Prediction Center.
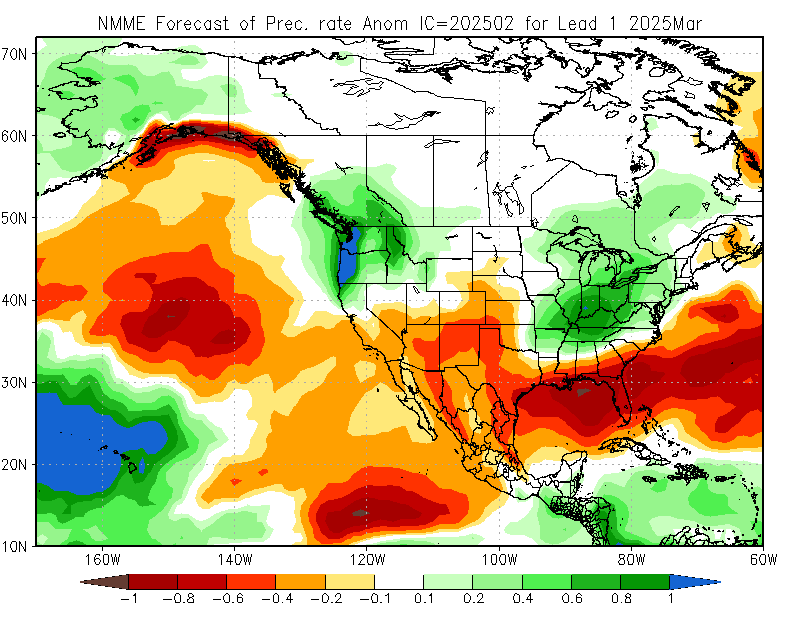
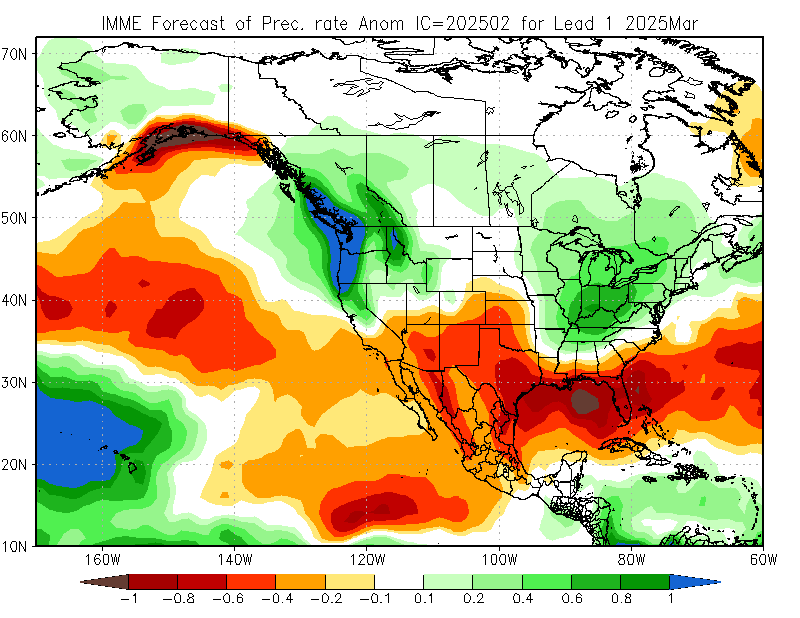
The outlook for March is trending wet in the northern basins, with the North American Multi-Model Ensemble (NMME) showing wet in the North and dry in the South, as has been the trend during this year. The same is true for the International Multi-Model Ensemble (IMME). This would align well with the general La Nina pattern for California and Nevada precipitation.
However, it is very rare to have two consecutive wet months during a La Nina event, even for the northern basins (i.e., as measured by the 8-Station Index). For the 8 water years when La Nina’s produced a wet February (8 cases), only one case also had a wet March (WY1975), but 4 years were near normal.
It would be a low probability event if March turns out to be much above average.
Most of the precipitation this year has been focused in the northern tier of the CNRFC region. Only with this last storm (Feb 13-14th) have we seen much snowpack built up in the Central and Southern Sierras.
La Nina conditions are currently present, but will not likely last much longer into the water year. Given the current trend to this year, I’d expect the remainder of the water year to follow a similar pattern.
CNRFC