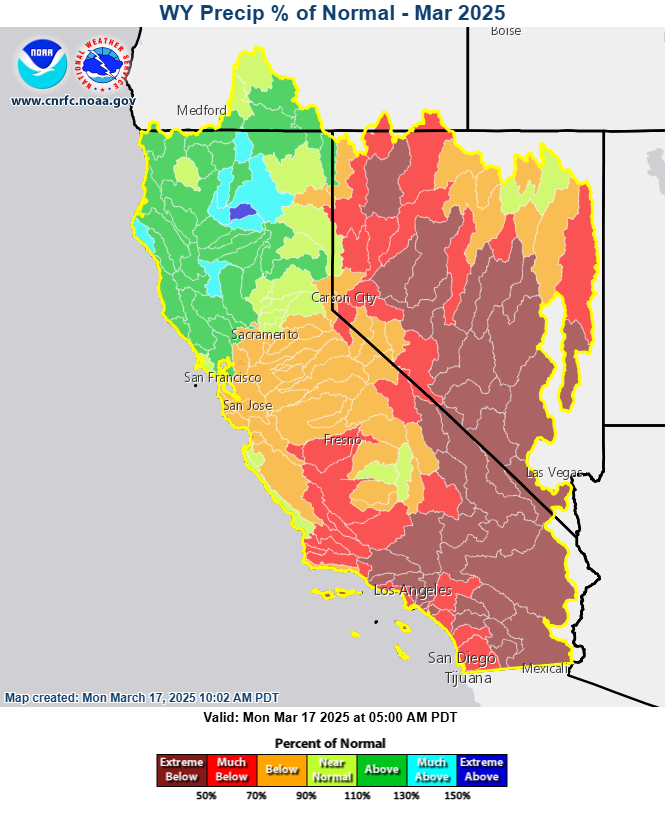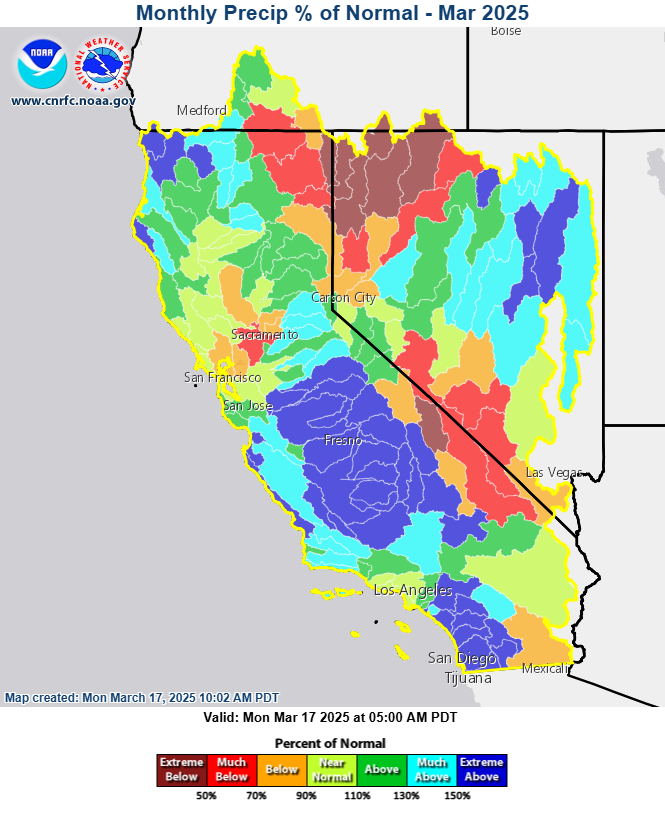
The second half of February and much of early March featured only some weak storms that had little impact on snowpack in the region. Beginning March 12, more substantial precipitation returned to the region as a series of fairly cold systems impacted the area. The figure below shows March precipitation percent of normal through the early morning of March 17. Wettest conditions compared to average have been in NW California, central and southern California, and NE Nevada.
Image above: March 1-17, 2025 percent of average precipitation. Source: CNRFC
Looking at the 2025 water year to date, the percent of normal precipitation pattern looks similar to a month ago. Northern California continues to be above normal, with most other areas below normal.
Image above: October 1, 2024 through March 17, 2025 percent of average precipitation. Source: CNRFC
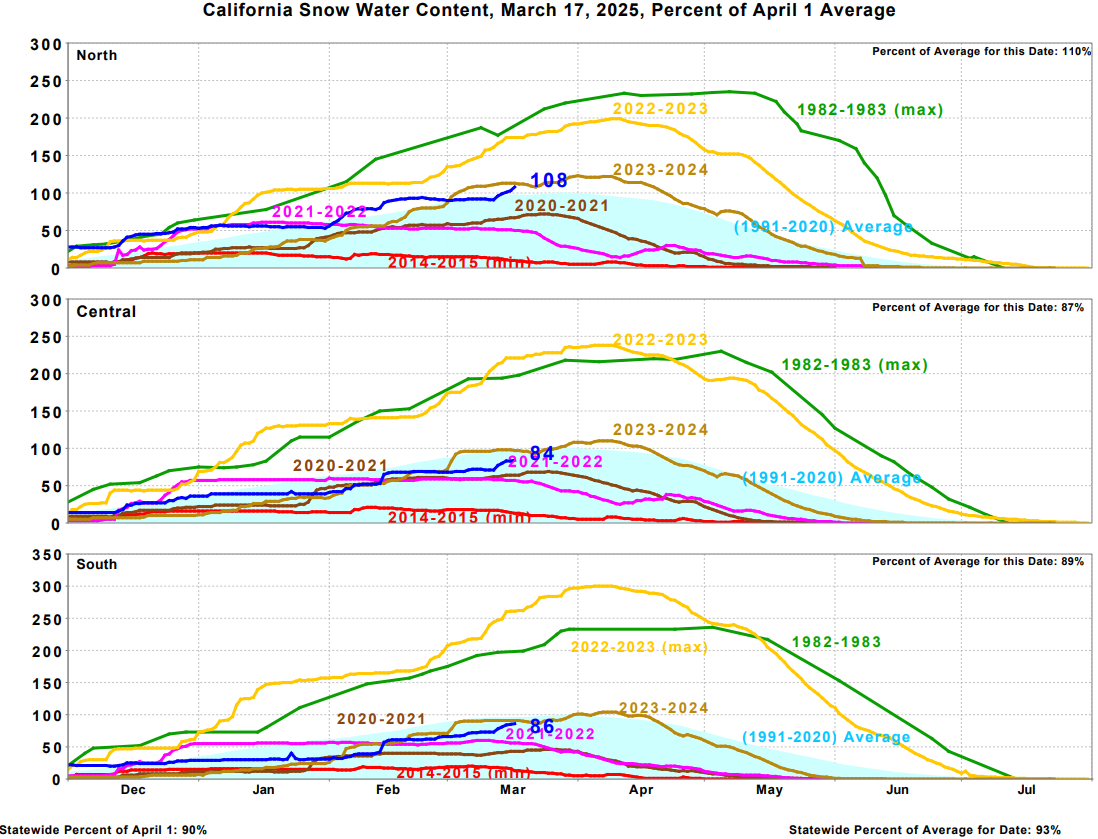
Snow content across California did not change much for the second half of February through early March, with noticeable increases in snow content across the state beginning last week. The snowpack across northern California is at 110% of normal, while the central Sierra, southern Sierra, and statewide averages are near 90% of normal.
Image above: Percent of average snow for various CA regions. Source: CA DWR
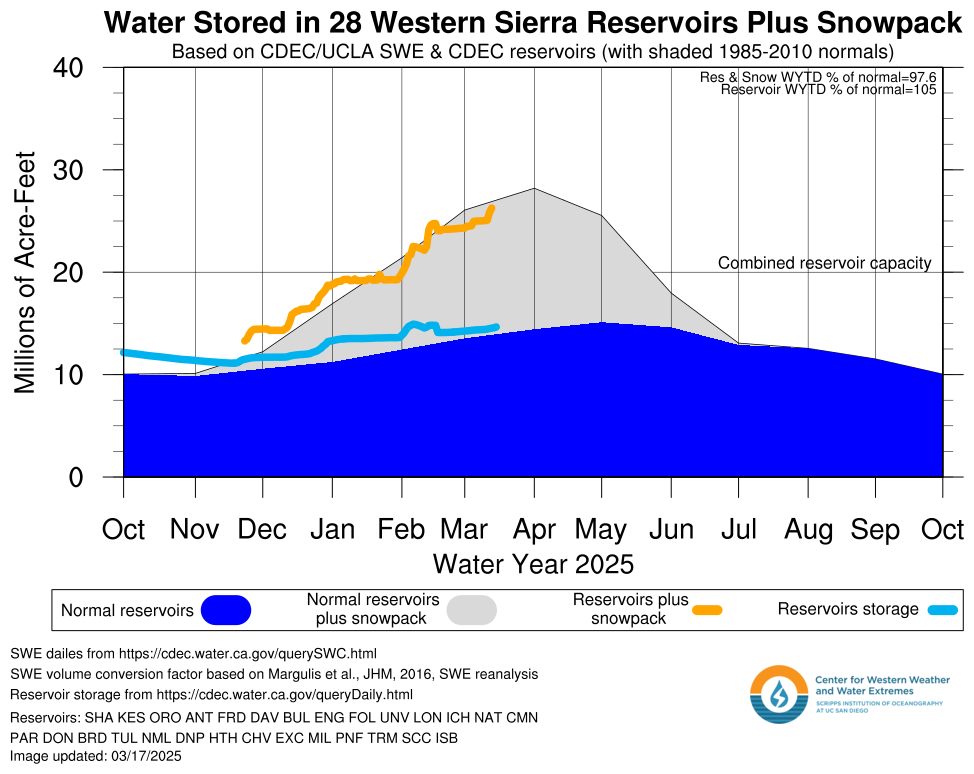
The graphic below from CW3E shows combined reservoir capacity as well as reservoir capacity plus snowpack across the western Sierra, with comparisons to normal. This data tells a similar story as above, with statewide values for both variables near normal for this time of year.
Image above: Percent of average reservoir storage and reservoir storage plus snowmelt the western Sierra. Source: CW3E
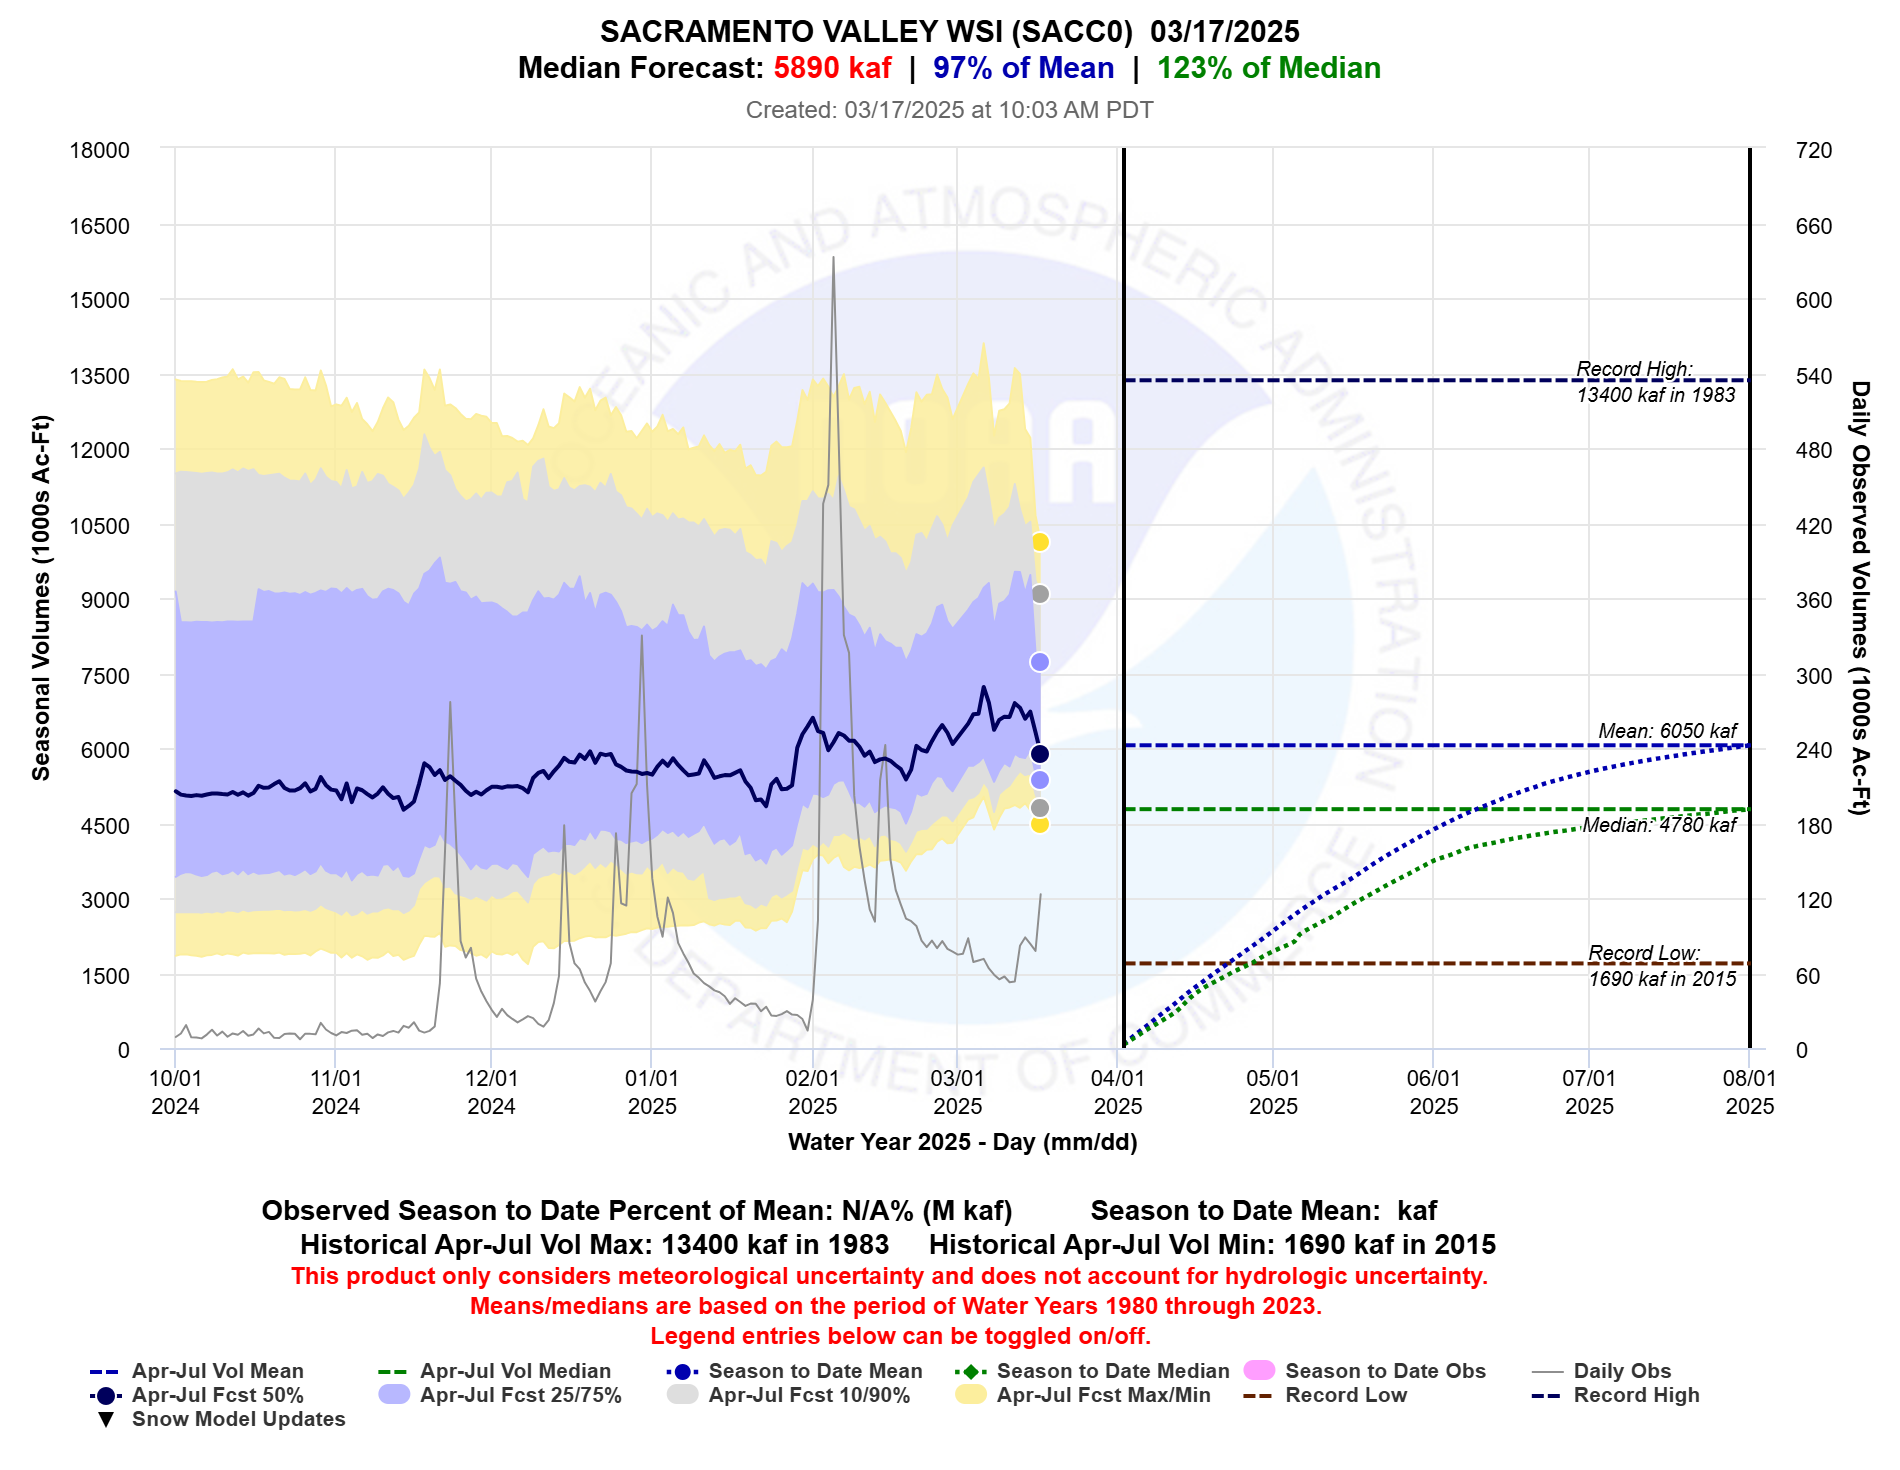
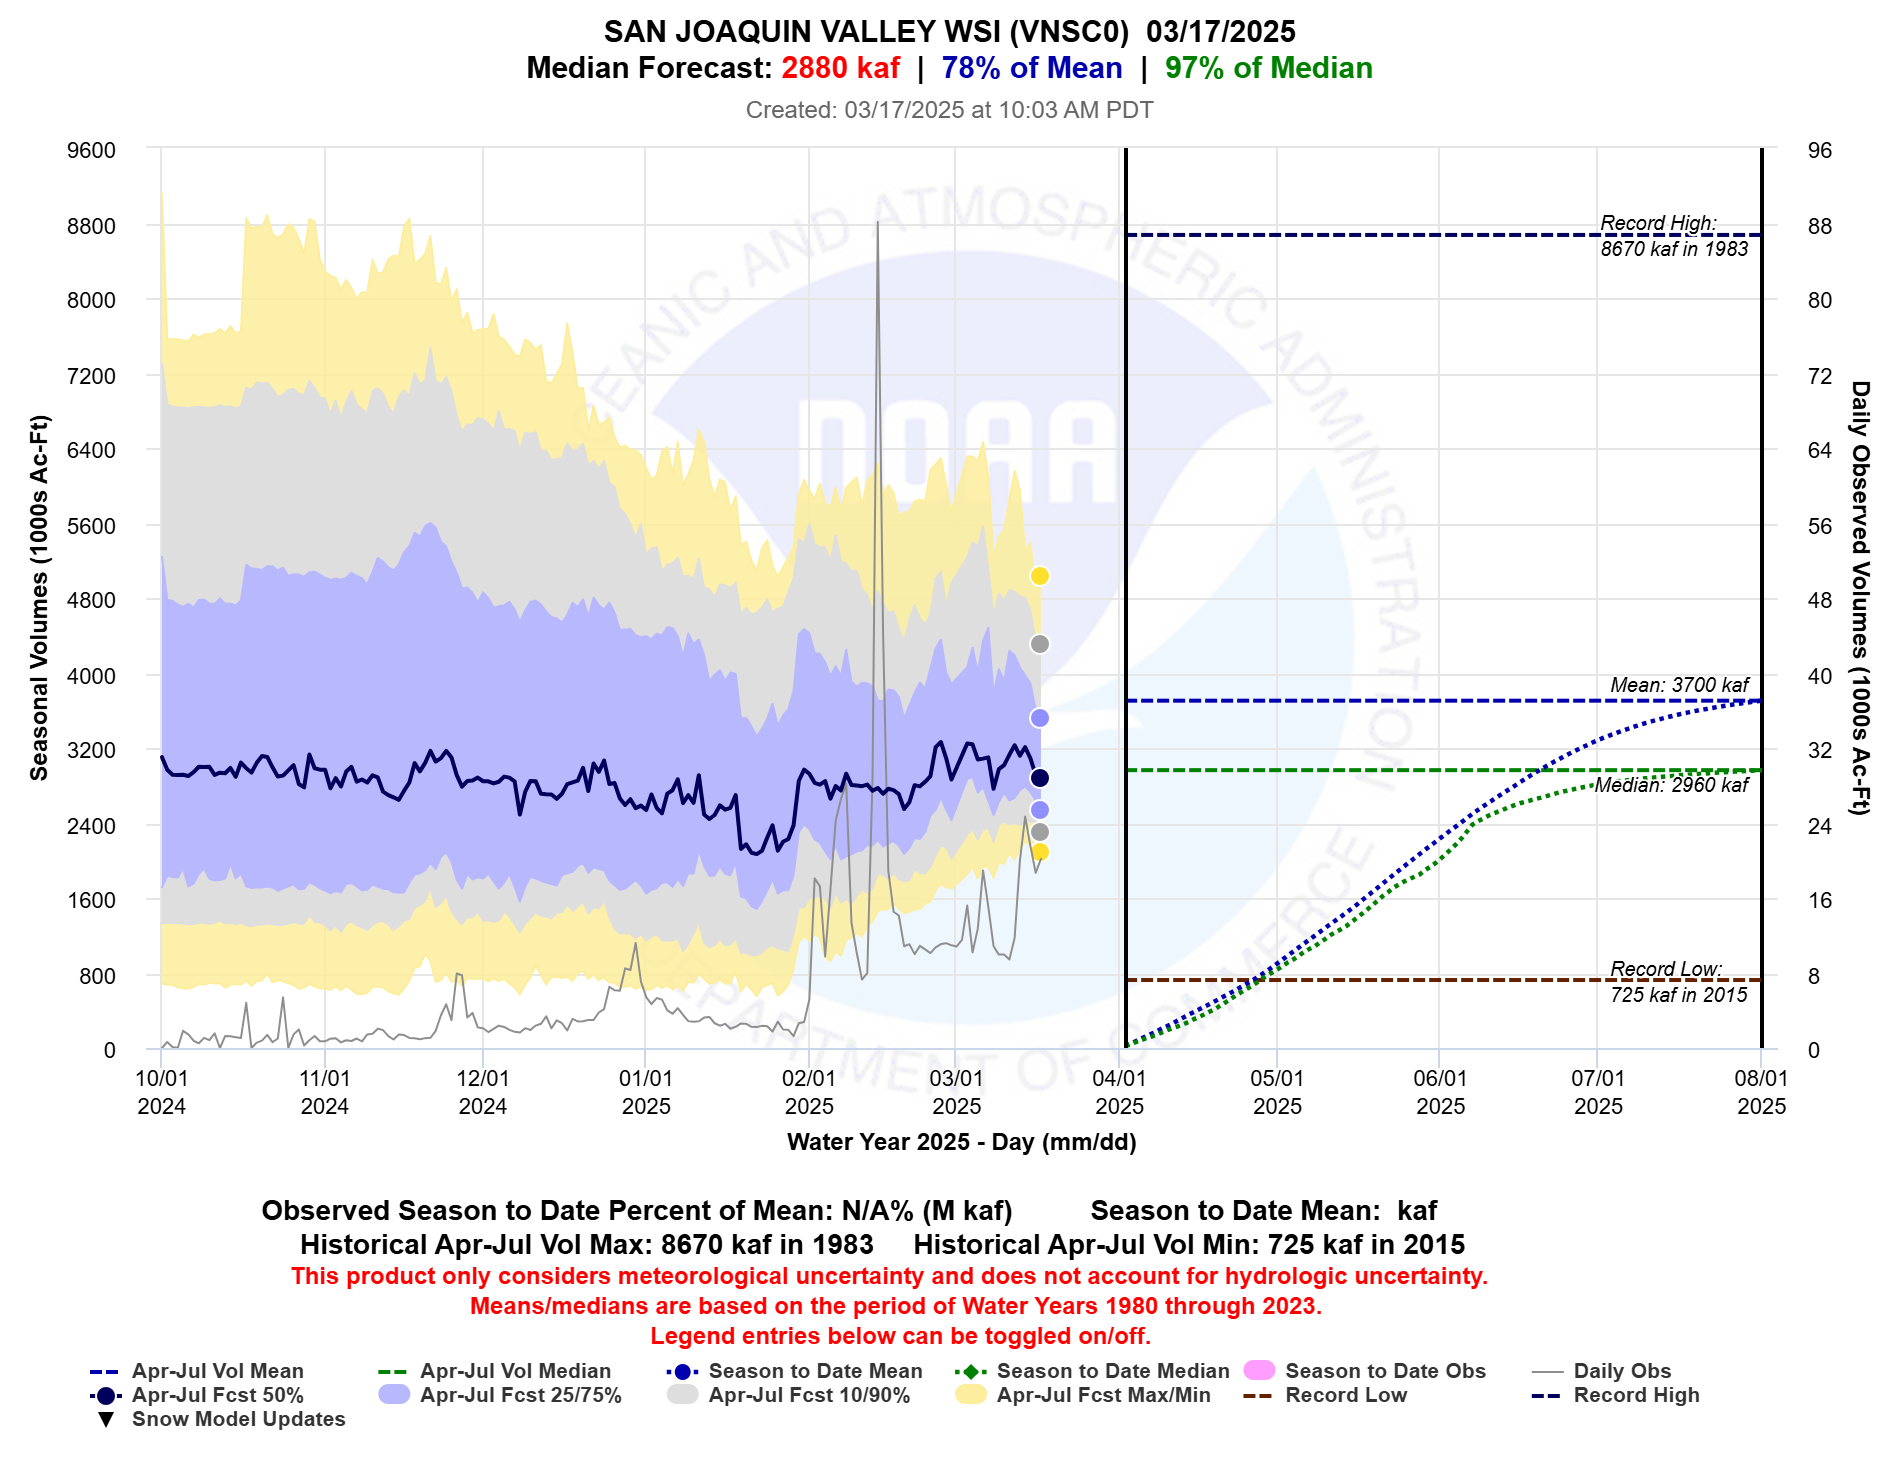
The Sacramento Valley Water Supply Index plot shows fluctuations in April through July runoff forecast over the past month or so, with current values similar to a month ago. The current forecast is near 100% of average and 125% of median. A similar trend was noted for the San Joaquin Valley Water Supply Index plot (second plot below), where the latest forecast is near 80% of average and 100% of median.
Image above: Trend in April-July volume forecasts for the Sacramento Valley Water Resources Index. Source: CNRFC
Image above: Trend in April-July volume forecasts for the San Joaquin Valley Water Resources Index. Source: CNRFC
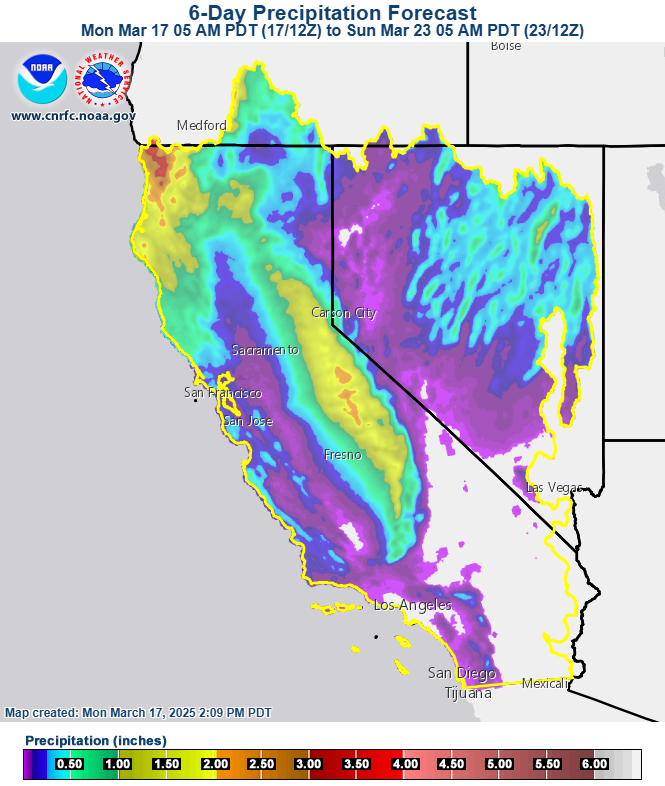
The precipitation forecast for the next 6 days features 1-2 inches of liquid-equivalent amounts in much of the higher terrain of CA and 0.5-1” in NE NV with moderate to low snow levels. Most of the precipitation across the higher terrain is expected to fall by Tue morning.
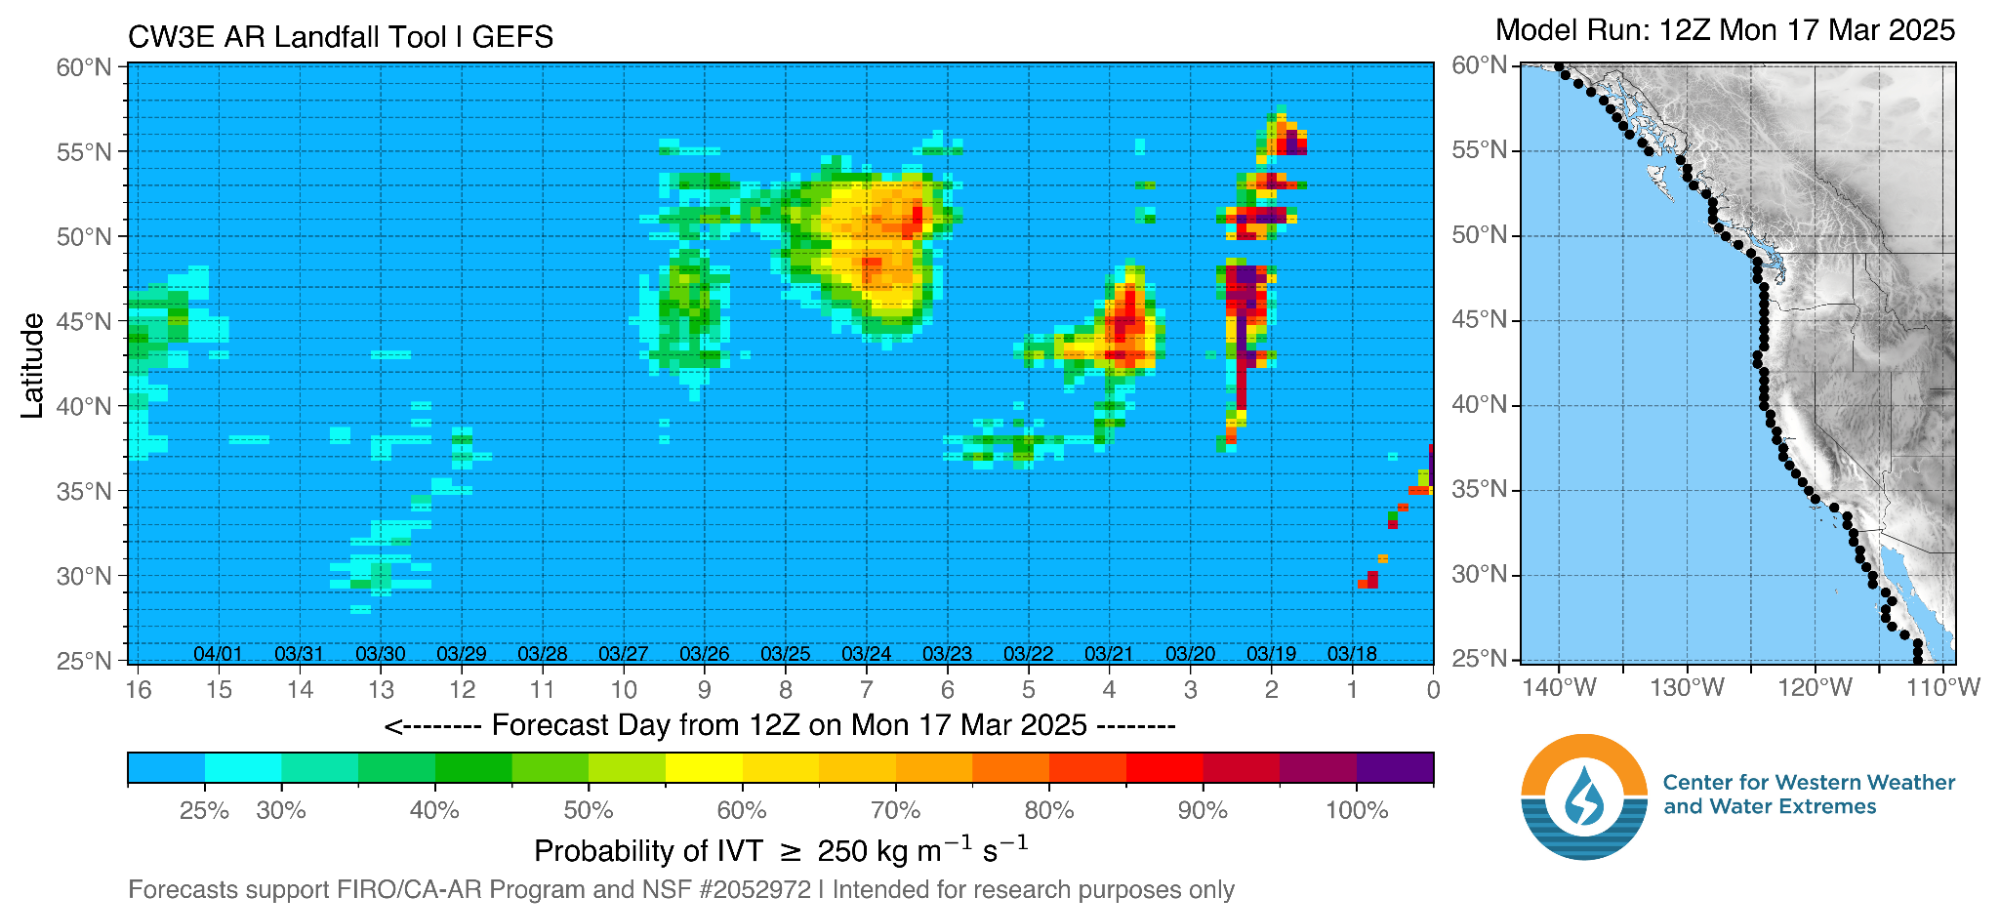
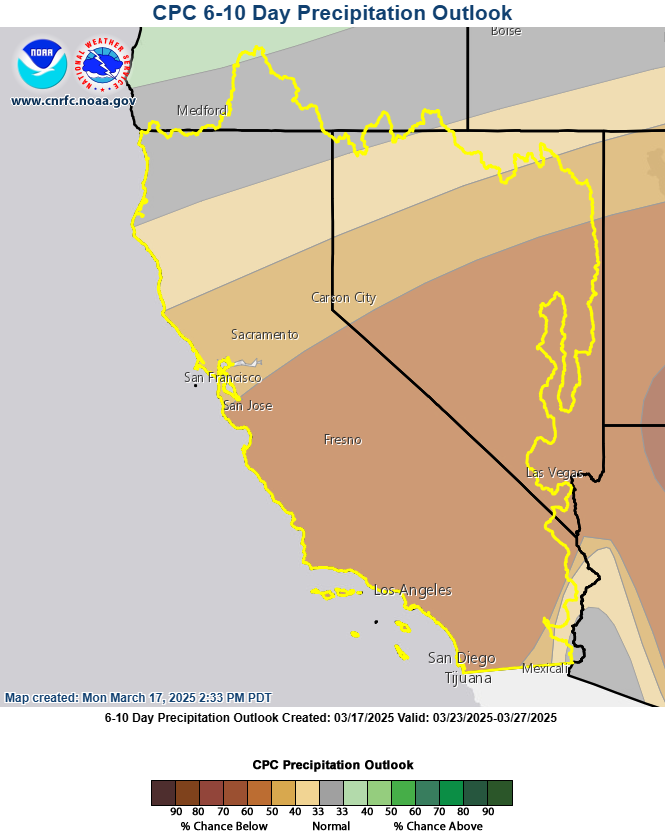
This atmospheric river landfall tool below shows possibilities for atmospheric river landfalls in northern CA later this week and this weekend, with largely quiet conditions for the rest of March. The precipitation outlook from the Climate Prediction Center for March 23-27 (second graphic below) favors below-average precipitation for the southern half of the region and transitioning to equal chances of above- or below-normal precipitation in far northern CA/NV.
Image above: GEFS-based atmospheric river landfall probabilities through April 2. Source: CW3E
Image above: Precipitation outlook for March 23-27. Image source: CNRFC Data source: CPC
For water resources information that is updated daily, visit our main Water Resources page.