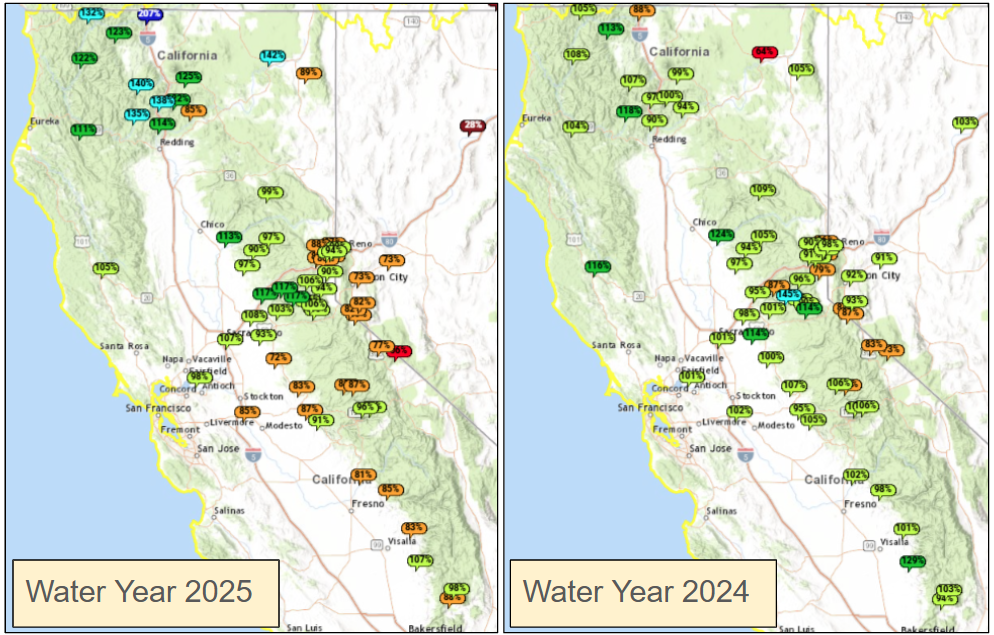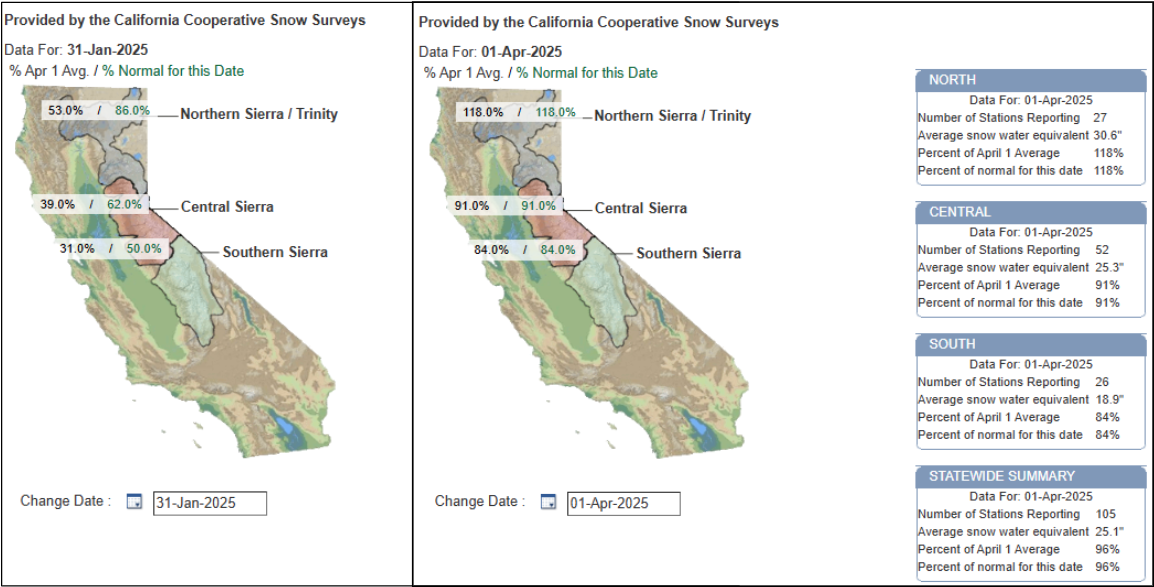
Water year 2025 precipitation has been tracking above average for most of the water year for Northern California. Heavy precipitation hit the region in late November, followed by above normal precipitation in December. January was pretty dry, but February came in as the 10th wettest in history for the 8-Station Index. The Central/Southern Sierra has not fared as well. The December storms were focused mainly north of I-80, and by the end of January the 6 and 5-Station Indices were roughly 50% of average. However, February and March have been more fruitful for the Central/Southern Sierra. The Tulare 6-Station Index is 92% of normal, and the San Joaquin 5-Station Index is 74% of normal as of April 1st. As a result, snowpack percentages have also come up over the winter. The Northern Sierra April 1st snowpack increased from 86% at the end of January to 118% by April 1st. The Central Sierra increased from 62% to 91%, and the Southern Sierra jumped from 50% up to 84% in the same period (see below).
*source CA Department of Water Resources CDEC website
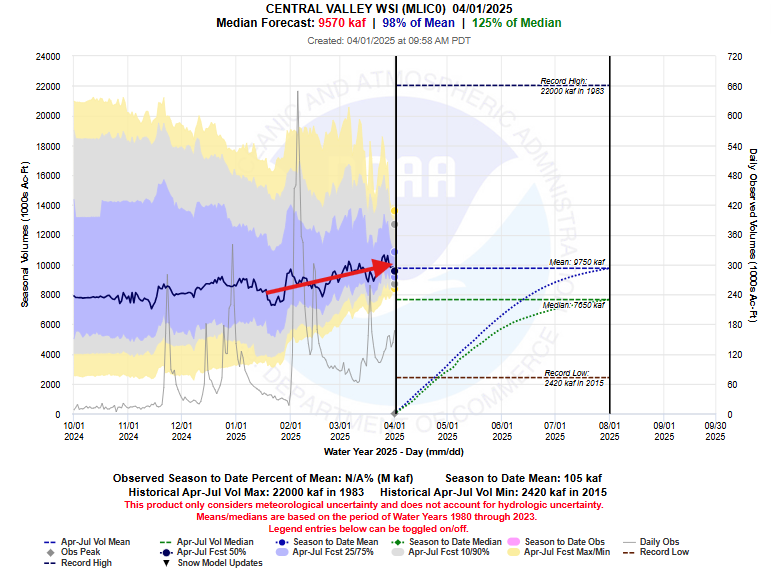
Similarly, the April-July runoff forecasts have trended upward over the last two thirds of the winter. The Central Valley index median April July runoff forecast was 74% of average after the first third of winter, but since then, the forecasts have continued to trend upwards, and currently is forecasted to be 98% of average as of April 1st. There has been some noise in the median projections over this period mainly due to variability in the near-term weather forecasts, but the general trend has been upward. We have noticed that adding GEFS weather information in the week 3-4 period in the HEFS simulations has added more noise in the A-J projections. Mike Imgarten looked into this in more detail over the winter, and compared A-J forecast projections with and without the GEFS influence in the 15-28 day period of the HEFS. It was concluded that the GEFS influence in the week 3-4 period was adding more noise than value to the seasonal runoff projections, and so we have scaled back the use of the GEFS in our HEFS runs. We now only extend the use of the GEFS out to day 14. After day 14, the spread in the ensembles is based purely on climatology.
*source CNRFC Water Supply Forecast website.
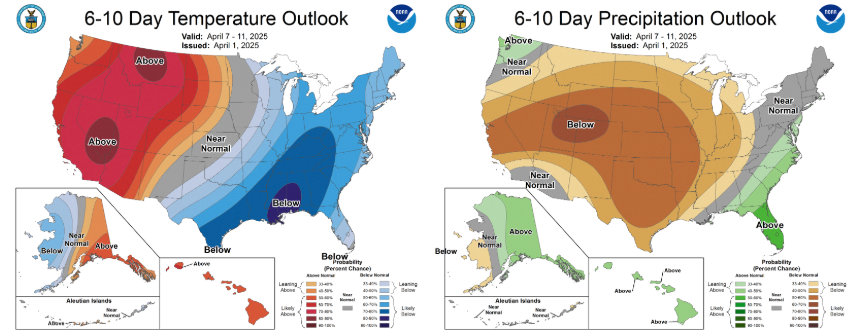
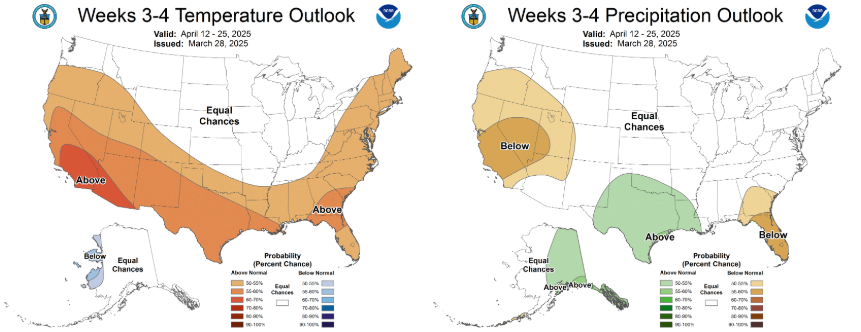
April is looking warm and dry based on CPC’s latest outlooks. Below are CPC’s projections from early April out towards the end of the month. Both outlook horizons point towards above normal temperatures and below normal precipitation.
*source NOAA Climate Prediction Center
Overall, this water year’s April 1st projections are looking fairly normal for much of the region. Last water year was the “abnormally normal” year, and this year is not too different with the exception of portions of the far north being much above normal this year, and the Southern Sierra being slightly below normal. The Central Valley Index was 101% of normal last year, and is forecasted to be 98% this water year.