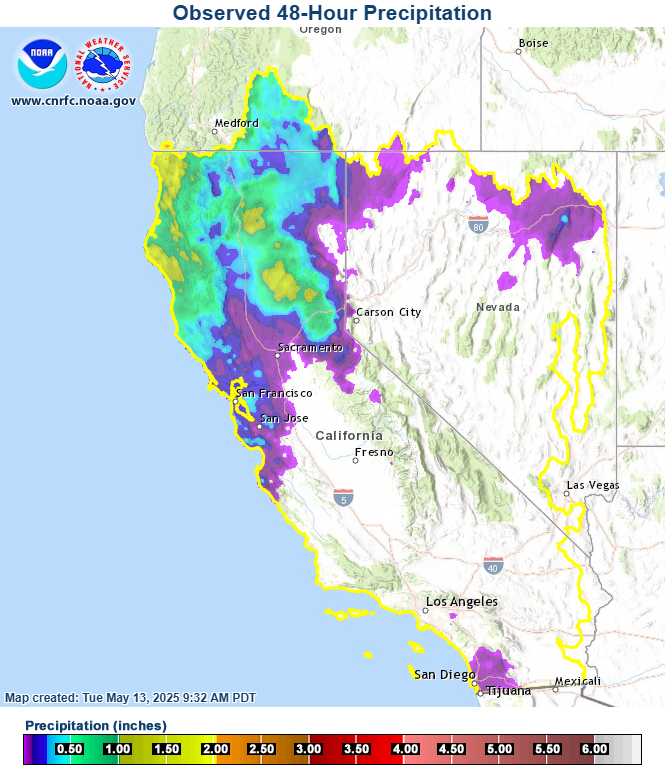
A large area of low pressure moved across the area to start off the week, bringing with it a relief from the near record temperatures many locations experienced on Friday and Saturday. Light precipitation fell across much of the northern two-thirds of California, with the highest amounts of 1-2in along the north coast and across the Shasta and Feather watersheds. Figure 1 shows the 2-day accumulation totals as of 5AM Tuesday morning.
Figure 1: Observed 2-day accumulated precipitation. Source: CNRFC
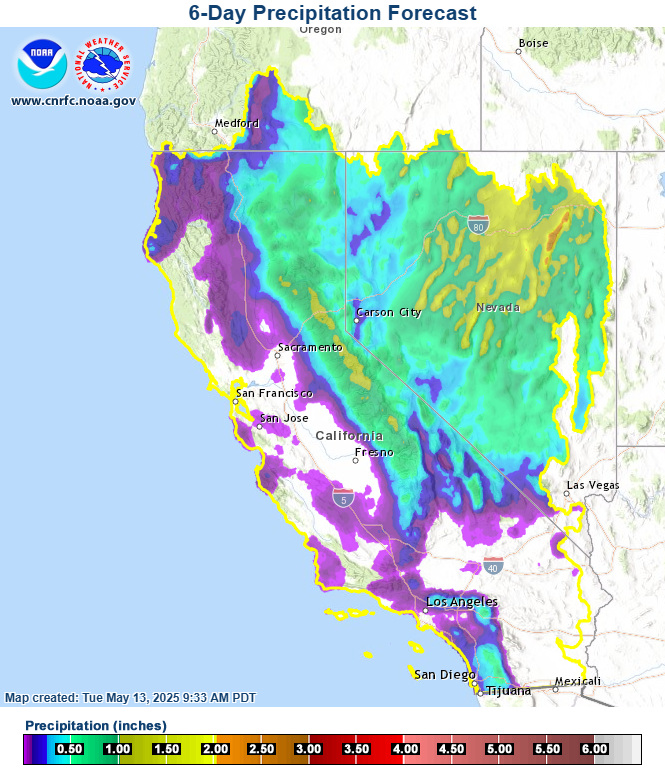
Models are indicating we may be in for yet another cool down and more precipitation this weekend, making it the 4 straight weekend with below normal temperatures across much of our forecast area. Figure 2 shows the current 6-day forecast precipitation, with widespread 1-2in totals along the Sierra and throughout the Humboldt watershed in northern Nevada.
Figure 2: 6-day precipitation forecast. Source: CNRFC
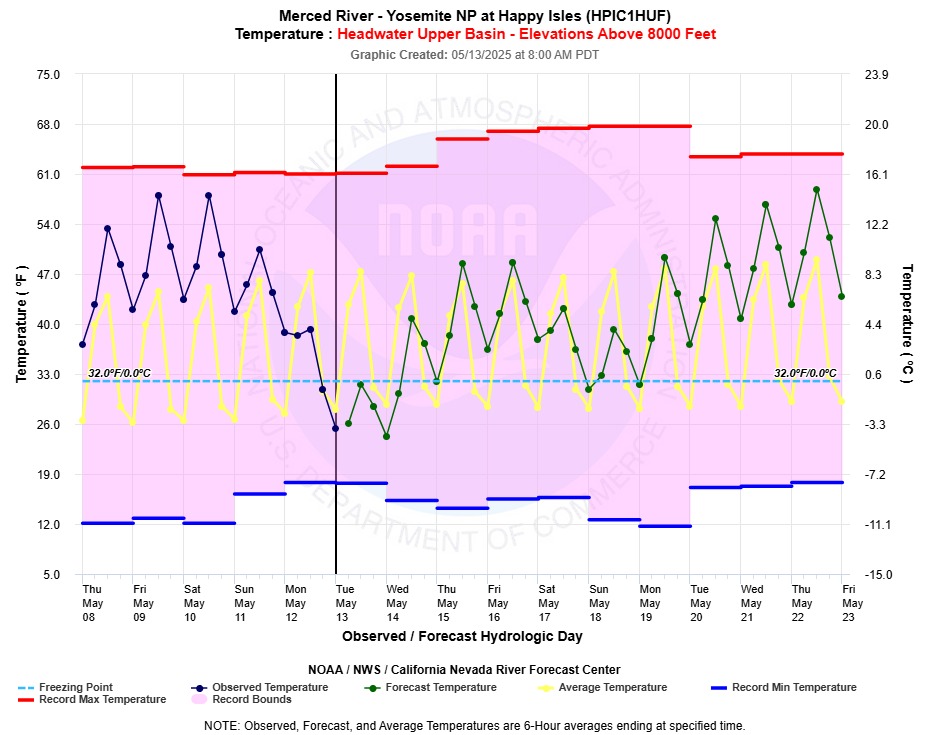
Beyond the weekend, models are showing increasing odds of a steady warming trend with above normal temperatures lasting through next week and into the last week of May. This scenario would keep snowmelt going strong for watersheds with sufficient snowpacks. Figure 3 shows the 10-day forecast temperature trend in the Happy Isle watershed in Yosemite.
Figure 3: 10-day forecast temperature trend at Happy Isle showing below normal temperatures this weekend, with above normal temperatures starting next week. Source: CNRFC
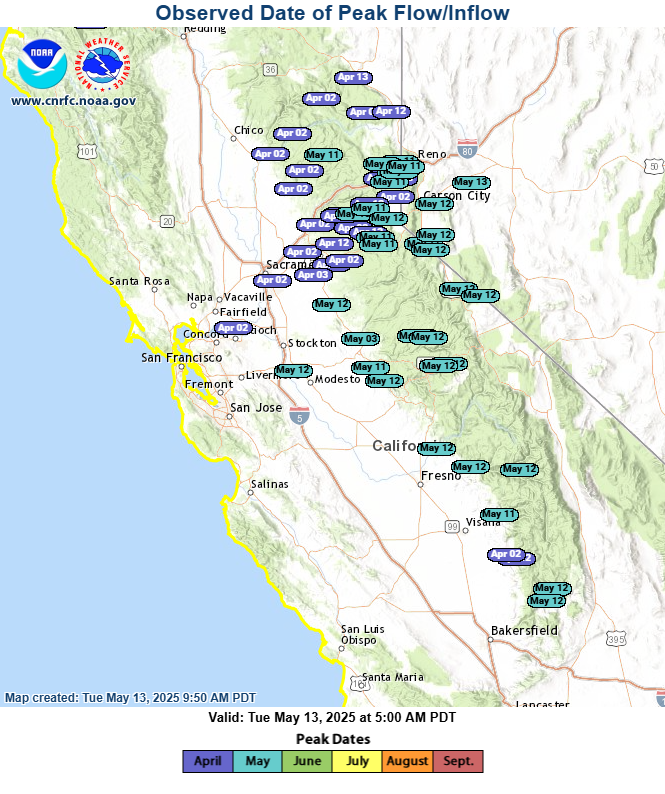
Seasonal snowmelt peaks may have occurred over the weekend in many watersheds as a result of high temperatures and mostly clear skies across the area. Basins in the central and southern Sierra, particularly those at high elevation, will likely make another run at setting new snowmelt peaks late next week. A few of the highest elevation basins, such as the Walker in the east Sierra and the Kern, have likely not yet reached their seasonal snowmelt peaks and may reach new snowmelt peaks by late next week into the last week of May. Figure 4 shows the current peak runoff dates for the April through July period. Note that some basins, particularly those in the American watershed, and those at lower elevations, peaked during the rainfall event that occurred during the first few days of April.
Figure 4: To-date peak runoff for the April through July period. Not all peaks were snowmelt driven, with many near and north of the I-80 corridor having occurred as the result of rainfall. Source: CNRFC
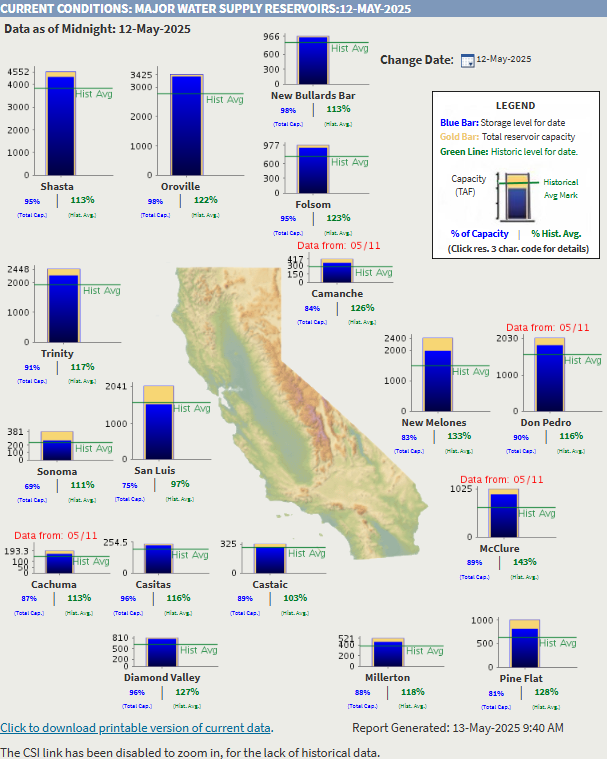
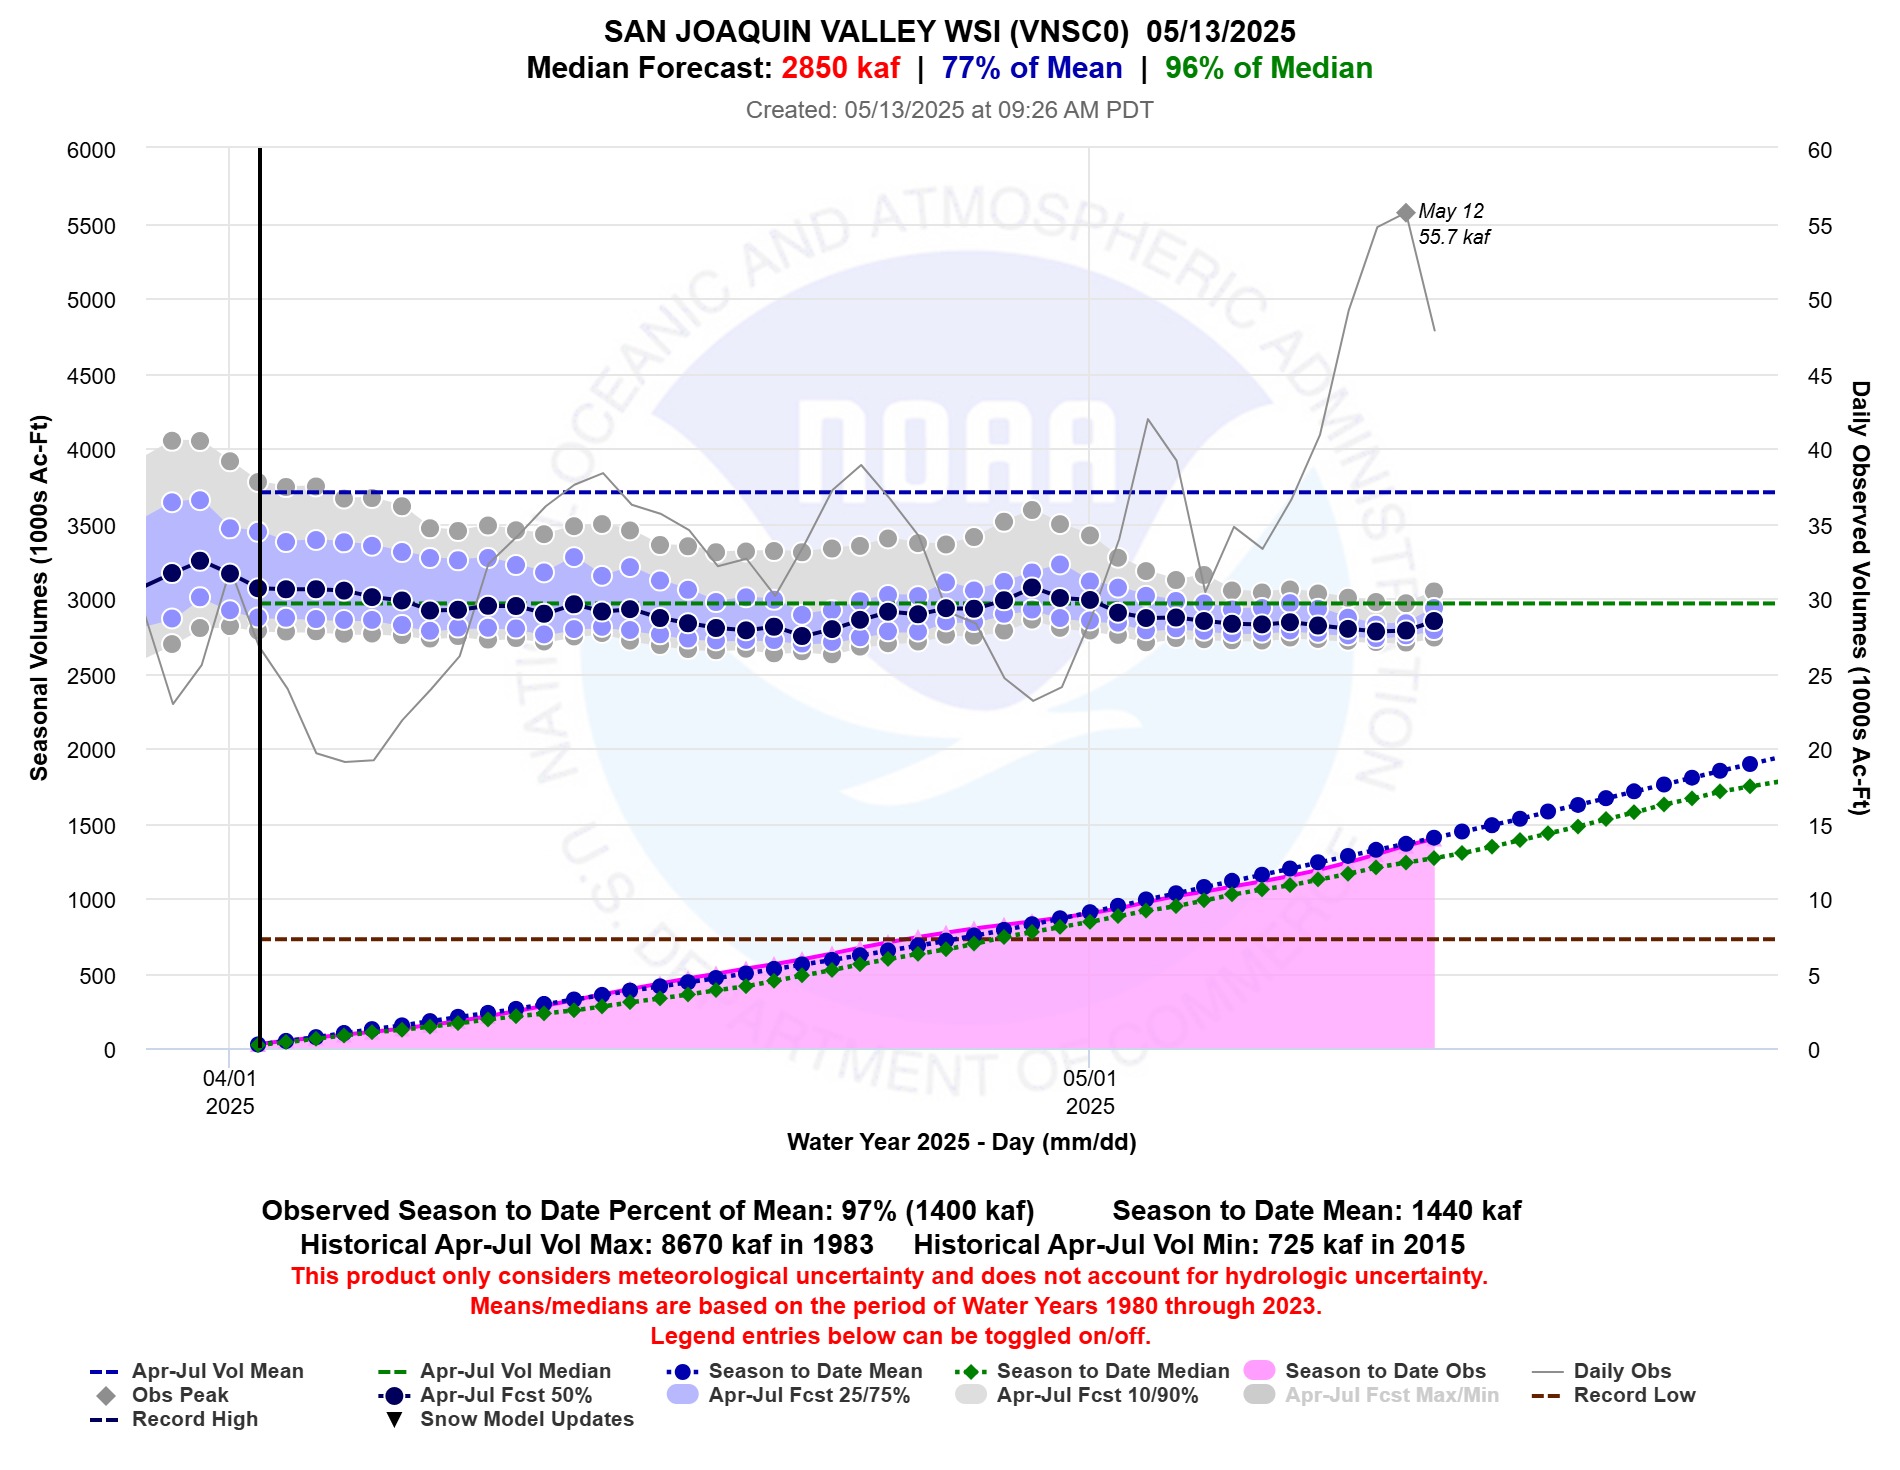
Water supply conditions across the region are looking quite good, despite the drier than average conditions this spring. Many of the water supply reservoirs across the State of California are near capacity, as shown in Figure 5. With the dry spring conditions, water supply forecasts have slowly dropped since the first week of April. Many locations have now fallen into the 75-90% probability range of the early April forecast. Figure 6 shows the April-July forecast trend plot for the San Joaquin Index, which is the accumulated full natural flow volume forecast from the San Joaquin, Merced, Tuolumne and Stanislaus river systems. The current April-July 50% forecast volume is 2.8 million ac-ft, which aligns closely with the 75% forecasts at the beginning of April.
Figure 5: Current water supply conditions for area reservoirs. Source: CA Department of Water Resources
Figure 6: Trend plot for the San Joaquin water supply index. Source: CNRFC