Monthly Streamflow Volume (1000s of Acre-Feet)
Data Updated: Jul 07 2025 at 8:16 AM PDT |
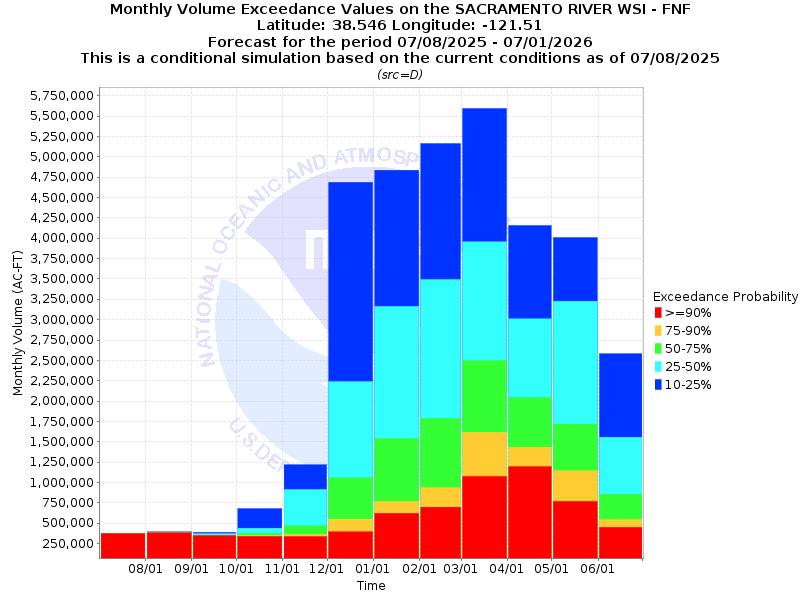
| Prob | Jul* | Aug | Sep | Oct | Nov | Dec |
| 10% | 490.8 | 393.0 | 388.1 | 679.0 | 1217.7 | 4686.7 |
| 25% | 489.4 | 386.0 | 371.4 | 439.4 | 914.0 | 2238.4 |
| 50% | 488.1 | 382.4 | 354.5 | 375.2 | 469.3 | 1058.6 |
| 75% | 487.7 | 381.0 | 348.6 | 350.7 | 362.0 | 552.1 |
| 90% | 487.5 | 380.8 | 348.1 | 338.1 | 335.4 | 393.5 |
|
| Mean | 518.7 | 368.8 | 372.8 | 468.7 | 767.6 | 1708.8 |
| %Mean | 94.1 | 103.7 | 95.1 | 80.1 | 61.1 | 61.9 |
| Prob | Jan | Feb | Mar | Apr | May | Jun |
| 10% | 4835.8 | 5162.9 | 5595.1 | 4156.1 | 4008.3 | 2581.1 |
| 25% | 3162.7 | 3492.8 | 3954.9 | 3009.1 | 3227.3 | 1556.6 |
| 50% | 1539.0 | 1788.3 | 2496.1 | 2045.0 | 1718.6 | 858.4 |
| 75% | 769.2 | 935.6 | 1618.5 | 1434.5 | 1142.9 | 545.2 |
| 90% | 621.4 | 697.8 | 1075.0 | 1194.7 | 768.0 | 449.1 |
|
| Mean | 2213.4 | 2478.9 | 2962.8 | 2351.8 | 1999.1 | 1117.0 |
| %Mean | 69.5 | 72.1 | 84.2 | 87.0 | 86.0 | 76.8 |
| Note 1: %Mean is the "Median forecast monthly value (50%)" divided by the "monthly mean" (displayed as a %) |
| Note 2: For current month, graphic represents remaining forecast only, text represents observed + remaining forecast. |