
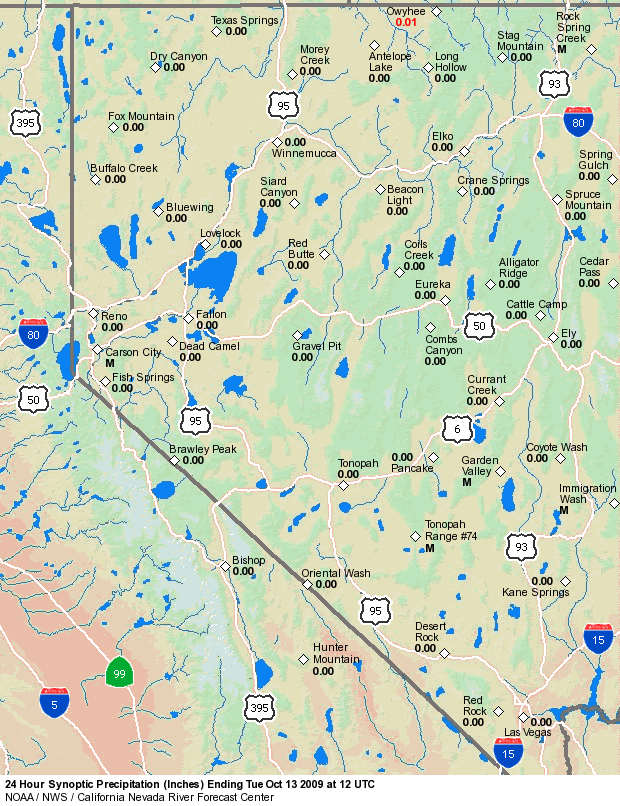
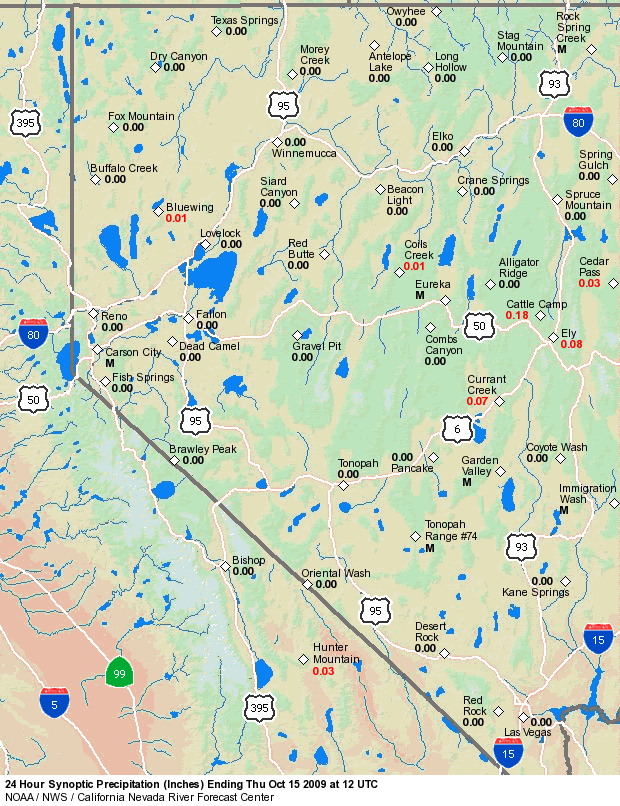
Early-Season Heavy Precipitation Event Navigation: General Summary | Precipitation | Weather Synopsis | Hydrologic Impacts A very wet and windy storm struck California on the 13th of October, the day after Columbus Day and nearly fifty years since the infamous Columbus Day storm of 1962. The 2009 storm was fueled by unseasonably-strong upper-jet energy across the Pacific and a surge of tropical moisture from former super typhoon Melor, which struck Japan earlier on the 8th of October. While not a very long duration storm in comparison to the 1962 storm, it still managed to drop locally over 15 inches of rain in the Santa Lucia Mountains on California's central coast and over 10 inches in the Santa Cruz Mountains. Heavy rains spread throughout much of northern and central California as well as across the Santa Ynez mountains just south and east of Point Conception in southern California. The storm was accompanied by strong winds with gusts in excess of 50 mph noted along much of the coast and in the central valley of California. With such an early fall storm, deciduous trees still had most of their leaves resulting in many reports of tree damage; downed limbs and branches and some trees blown over. There were also negative impacts on California agriculture, notably affecting the wine grape harvest and raisin drying. With advanced warning as early as the prior Thursday before the storm, many growers were able to take measures to prepare for the upcoming storm. One aspect of this storm that added an additional element of interest was the opportunity to witness the hydrologic response to such intense rainfall on dry soils, given that this was the first significant precipitation event of the rainy season. Of greatest concern were debris flows and flash floods in the fresh burn areas and burn scars from recent years' fires. [ Click here for an interactive map of precipitation from this event ] The table below shows links to the daily precipitation totals at various scales, and includes both gridded and actual gage data. While the greatest precipitation totals occurred in the 24-hour period ending 5 AM PDT Wednesday, Oct 14th (14/1200 UTC), the days prior and after the 14th were included to account for the total duration of the event.
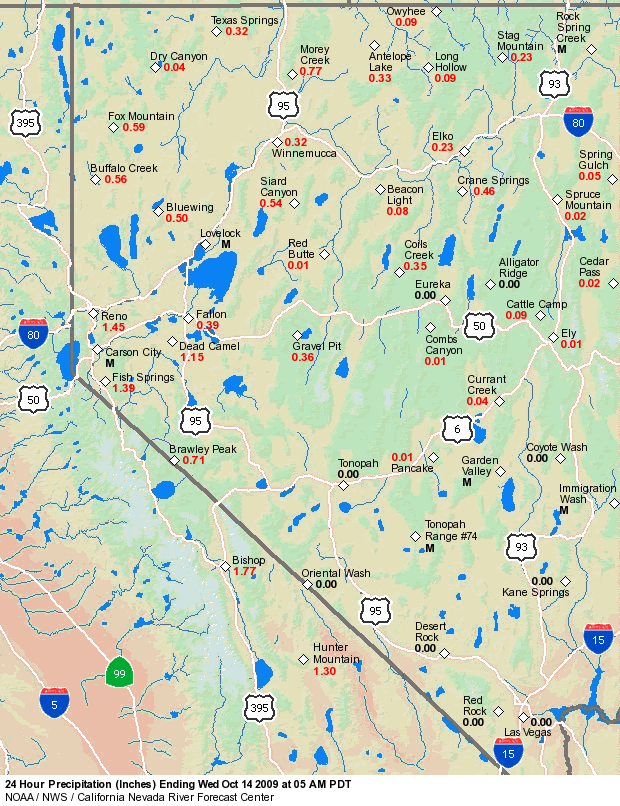
The storm's most intense precipitation generally occurred in a 12- to 18-hour period on the 13th of October between 5 AM PDT (13/1200 UTC) and 11 PM PDT (14/0600 UTC). The table below shows a sampling of precipitation trace plots and hourly rates for a few gages representative of the some of the wetter locations throughout California and western Nevada. Peak hourly rates up to 1 to 1.5 inches/hour for several hours were noted along the central coast of California with 0.5 inches/hour in the central valley. Note that these plots contain raw data that have not been verified for accuracy. As evidenced on the radar data and rain gage reports, moderate precipitation crossed the northern Sierra Nevada crest to the eastern slopes and into western Nevada valleys. Most notable were 1.77 inches in Bishop, CA and 1.45 inches measured at the Reno airport for the 24-hour period ending 5 AM PDT (14/1200 UTC) on the 14th.
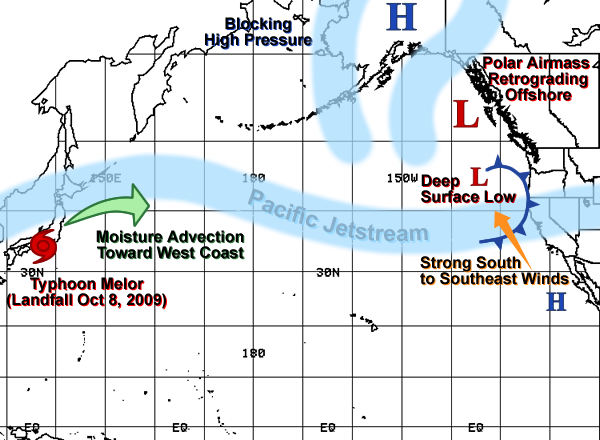
The synoptic pattern affecting the weather along the west coast for the first 10 days of October 2009 was dominated by strong ridging off the west coast with an axis near 140°-150°W. An upper-level low dropped south from British Columbia, through the Pacific Northwest, and into California around the 3rd, bringing showers and light rainfall amounts to the area. Otherwise, the two-week period leading up to the storm on the 13th and 14th was essentially dry area-wide. The ingredients for the early-season rain event in California began to take shape about 10 days earlier on the other side of the Pacific. Around October 3rd, the jet stream over the western Pacific began to strengthen to around 150 knots in a zonal flow. Meanwhile, Typhoon Melor was taking shape near the island of Guam. Melor eventually made landfall in Japan on October 8th, and shortly thereafter was absorbed into the jet stream. The jet began to strengthen and expand eastward across the Pacific, carrying with it the entrained tropical moisture from Melor. Two features acted together to end the influence of the ridge over the west coast and allowed an upper low to affect the west coast. A shortwave trough moved eastward into the base of the ridge on Oct 10th to help weaken the ridge. On the 11th and 12th, a polar airmass retrograded across British Columbia and impinged on the ridge on the eastern side. The combination of these two factors effectively pinched off the ridge over Alaska, leaving the door open for the upper lows to take control of the pattern. The two upper-level features mentioned previously began to interact with each other around 5 AM PDT on Oct 13th (13/1200 UTC). As they began to merge together, the overall system became more negatively tilted, and the surface low associated with the system already offshore began to deepen, reaching around 968 millibars (mb) near 46°N/143°W by 5 PM PDT on the 13th (14/0000 UTC). The surface low's proximity to higher pressure off the Baja California coast tightened the pressure gradient, resulting in strong gusty winds across California. Around 11 AM PDT (13/1800 UTC) on the 13th, several factors came together on the central coast of California to initiate a period of intense precipitation - the arrival of a 115-knot jet (with a max of 140+ knots just offshore), a moisture plume with precipitable water values near 1.5 inches, and strong winds in excess of 50 knots at 850 mb. Peak rainfall rates along the central coast were observed during the 12 hour period between 5AM (13/1200 UTC) and 5PM (14/0000 UTC) Oct 13th. As the system evolved, the moisture plume edged south toward southern California through the day on Oct 13th while the jet stream lifted further to the north. The combination of increased moisture and 850 mb winds of around 25-35 knots resulted in maximum rainfall rates in southern California during the next 12-hour period between 5 PM PDT (14/0000 UTC) on the 13th and 5 AM PDT (14/1200 UTC) on the 14th. See Figure 1 below for a schematic view of the key ingredients leading to the rain event on October 13th-14th.
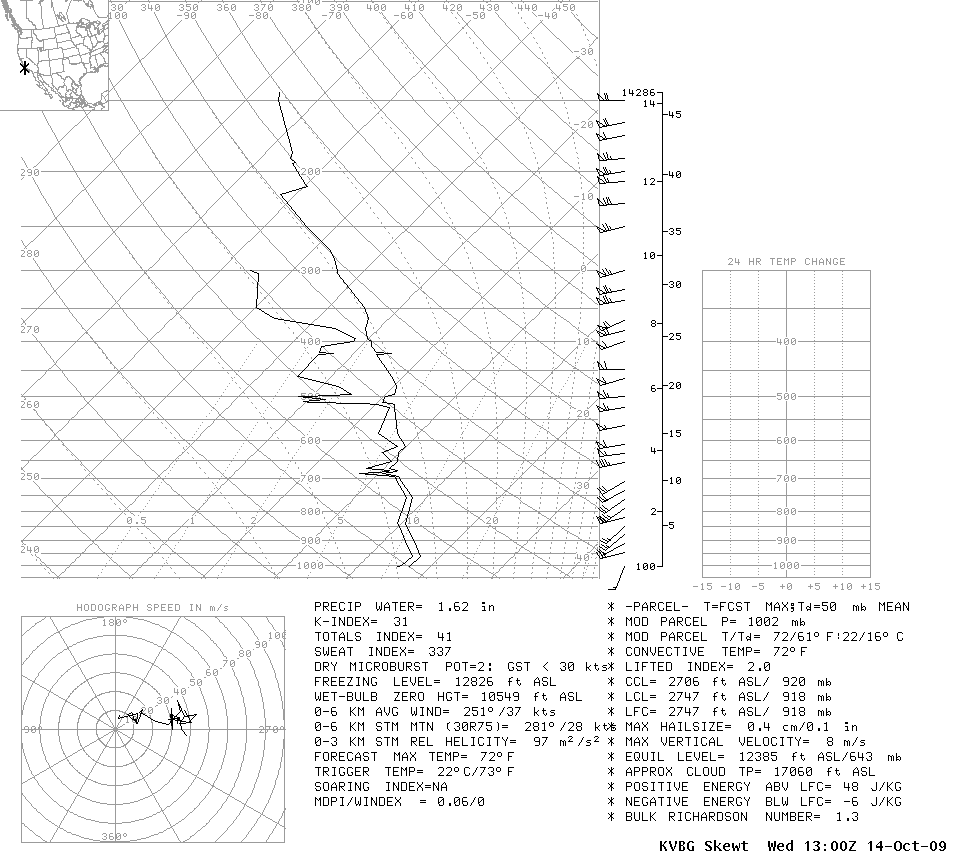
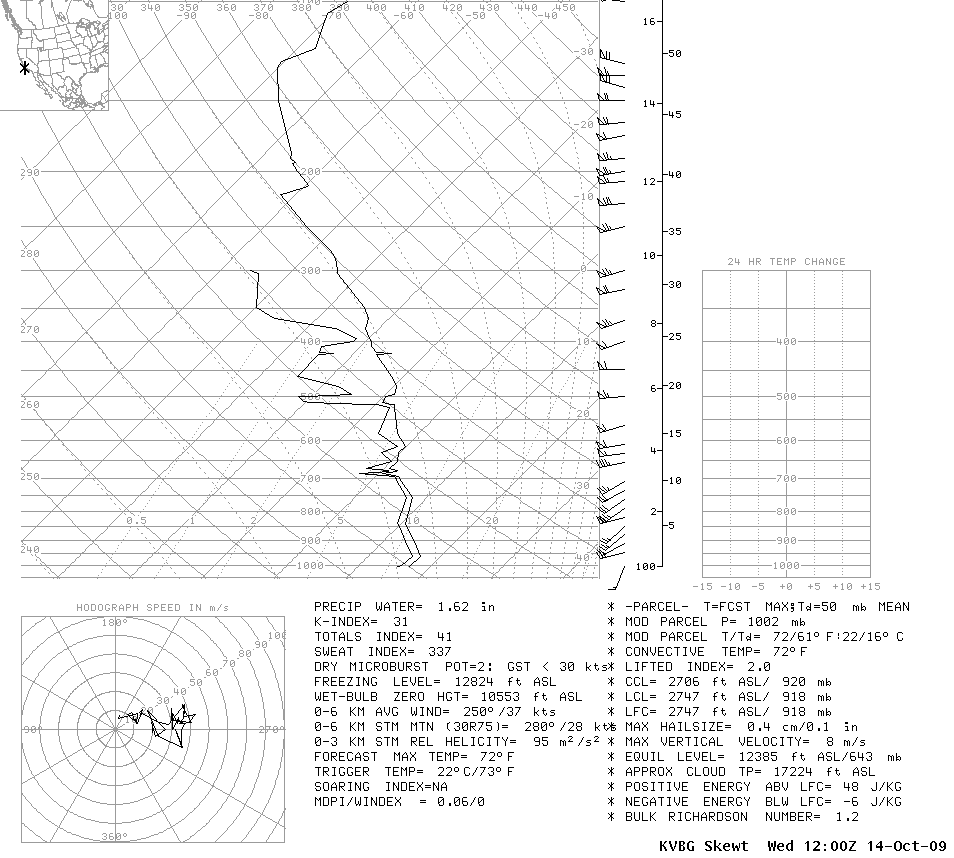
Figure 1. General weather pattern affecting the West Coast Oct 13, 2009 Moisture values associated with this storm were quite impressive. Upper air soundings along the California coast showed a peak precipitable water (PW) value of 1.54 inches at KOAK (Oakland) at 5 PM PDT (14/0000 UTC) on the 13th, and 1.62 inches at KVBG (Vandenberg AFB) 13 hours later as the moisture plume dropped south. AMSU satellite data showed this moisture plume extending nearly all the way across the Pacific in a quasi-zonal flow, with PW values around 1.6-1.7 inches east of 130°W and in excess of 2 inches near and west of the date line. Although PW values in this range would be impressive any time of the year, they were even more significant considering it was such an early-season storm. Peak PW values observed at KOAK and KVBG (as noted above) were approximately 267% of the seasonal normal for each site. GFS standardized anomaly charts indicated that the PW plume just off the California coast was around 4-4.5 standard anomalies above normal, while at the same time, 500 mb heights off the west coast were 4 standard anomalies below normal. These values give an indication of how unseasonable the moisture plume and the deep upper low off the coast actually were. In addition, KREV (Reno) and KLKN (Elko) soundings also indicated PW values in excess of 200% of normal at 5 PM PDT (14/0000 UTC) on Oct 13th, giving an indication of the inland extent of the moisture plume in northern Nevada. NOAA/GSD ground-based GPS-MET water vapor sensors showed the peak integrated precipitable water estimates ranging from 0.7 inches at Truckee to 1.8 inches at Vandenberg AFB. Another remarkable aspect of this event was how well the medium-range models handled the QPF, starting as early as the Oct 8/00 UTC model runs. Although earlier runs had highlighted the north coast of California as the area most likely to receive the highest rainfall amounts, by Oct 8th, models began to focus in on the central coast as the primary target. The Oct 8/00 UTC runs of both the GFS and ECMWF models showed a bullseye of maximum QPF between 7 and 9 inches storm total located between San Francisco and Monterey Bay, with even higher amounts in the central and southern Sierra Nevada. In addition, the Rhea orographic aid based on the GFS and ECMWF both began to consistently show about 7-8 inches storm total precipitation for the Santa Cruz Mountains and Santa Lucia Range beginning with the Oct 8/00 UTC runs. The graphic here shows the GFS run-accumulated QPF from the October 8/00 UTC run. Although the image shows an 8-day total, virtually all of the precipitation shown in the graphic was from the Oct 13-14 storm. Notice in the image that the main focus of precipitation was across the central portion of California, including a bullseye in the central coast region, where some of the highest totals were observed. The ECMWF forecast from the same time showed a similar result. As would be expected in an event with a source of tropical moisture, snow levels were relatively high across the region during this storm. The Chico profiler (in the central Sacramento Valley) indicated snow levels starting around 6500 feet on Oct 13th at 5 AM PDT (13/1200 UTC). The snow levels then rose to around 8000-9000 feet and remained there for the bulk of the event. Further south, in the San Joaquin Valley, the Chowchilla profiler indicated snow levels starting around 8000-9000 feet at 5 AM PDT (13/1200 UTC) on Oct 13th. Snow levels rose to around 11,000 feet by 2 PM PDT (13/2100 UTC) and remained there for at least several hours. In southern California, the KVBG sounding indicated freezing levels (which are typically 1000-1500 feet higher than snow levels) close to 13,000 feet from 5 PM PDT (14/0000 UTC) on the 13th to 6 AM PDT (14/1300 UTC) on Oct 14th. High snow levels such as these meant that efficient warm rain processes dominated the precipitation production, and also that most of the precipitation fell as rain, resulting in higher runoff. The following table shows snow level graphics from vertical profiler data in California.
The drop-down boxes below will display decoded METAR surface observations for several locations, mainly in California. They are divided up by region.
The following links display the evolution of the event from a satellite perspective. The infrared imagery depicts the cold, enhanced cloud tops bringing rain to CA and NV, as well as the upper low offshore with convective clouds near the core. The water vapor loop is effective at showing the plume of moisture aimed at the west coast, as well as the upper low offshore. The AMSU PW imagery shows the vast extent of the moisture across the Pacific Ocean and the remarkably high values contained within the moisture plume.
The following image loops are taken from NCEP reanalysis data of the event:
No monitor or flood stages were reported with this storm event, although a few river gages on the central coast of California approached monitor stage. As mentioned earlier in the general summary, one of the main reasons for preparing this storm summary is to document the hydrologic response to an early season storm of such magnitude on essentially dry antecedent soil conditions. Certainly the impacts would have been much different if this storm had occurred on basins that were primed from earlier storms. The table below shows the observed hydrographs for the official forecast points, arranged by forecast groups.
Hydrographs of some of the creeks and smaller rivers, such as San Lorenzo Creek-Big Trees near Santa Cruz and the Big Sur River at Big Sur exhibited sharp rises as a result of the intense rainfall on the coast of central California Tuesday. These rivers responded quickly, with peaks reached by early Tuesday evening, essentially within about 12 hours from initial base flow conditions. The larger reservoirs were minimally impacted by the event, as shown in the table below. Most notable was Shasta Lake, which showed a brief peak inflow just under 40,000 cfs and a net reservoir elevation rise of about 3 feet.
| |||||||||||||||||||||||||||||||||||||||||||||||||||||||||||||||||||||||||||||||||||||||||||||||||||||||||||||||||||||||||||||||||||||||||||||||||||||||||||||||||||||||||||||||||||||||||||||||||||||||||||||||||||||||||||||||||||||||||||||||||||||||||||||||||||||||||||||||||||||||||||||||||||||||||||||||||||||||||||||||||||||||||||||||||||||||||||||||||||||||||||||||||||||||||||||||||||