|
Historical Graphical River Forecast Learn More About Results and the Interface
The Interface The Historical Graphical River Forecast Interface provides tremendous flexibility in deriving products and information from our historical database of hydrologic forecasts. A thorough understanding of the results is important, as potential for misinterpretation can be quite high. This document provides guidance on how to use the Historical Graphical River Forecast Interface, and how to interpret the resulting graphical representation of the forecast. This interface represents Version 3.0 for obtaining verification information from our archive database. We welcome any feedback and/or suggestions to improve the interface. Feel free to contact our CNRFC Webmaster with any recommendations. Thank you. The user interface allows for custom product and information generation based on the following selections: Users are encouraged to thoroughly review this document before proceeding. If you would like interpretative assistance, please send an email to the CNRFC Webmaster or call us at the number provided at the bottom of every page.
Historical Graphical River Forecast information is only available at selected specific locations where river guidance is generated. These locations represent points that typically have defined critical stages (monitor, flood, and/or danger stages). The CNRFC refers to these locations as "Flood Forecast Points".
The CNRFC database that archives historical hydrologic forecasts was established in January 2003. As a result, historical data prior to this date are not available. Also, depending on when each river guidance location was established, the availability of historical information will vary.
Depending on the date, there may be a choice of up to four possible forecast time cycles. These include: 00z-06z, 06z-12z, 12z-18z, and 18z-00z. During the "rainy season" (October 15 - April 15), river guidance is generated twice daily on weekdays (12z-18z and 18z-00z) and once daily on weekends (12z-18z). This represents typical routine operations. However, during high water periods, the frequency of forecasts can increase to four times daily (once for each forecast time cycle). During the "dry season" (April 15 - October 15), river guidance is generated once daily (12z-18z), Monday through Sunday. In rare cases, data may not be available due to technical problems.
This option allows the user to return either a single image or a loop of images. The loop is centered on the selected date with the option to display either 4, 8, or 12 graphical RVF images preceding and following the selected date. The loop will display all available images and will find the closest previous match to the selected date if an exact match isn't found. The default is set to Single Plot. Please note when looping images that the vertical scale of the Stage/Discharge and Rain+Melt may shift since they are individually scaled to fit the data.
Once the user has selected the desired input from the previous three steps, the user will push
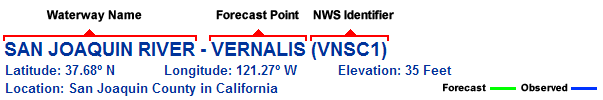
The "Help" button links to this page, a reference guide on how to use the Historical Graphical River Forecast Interface and how to interpret the displayed results. About the Results The historical graphical river forecast product is similar to the graphical river forecast product issued each day, updated more frequently during significant runoff events. The information represents the output of the NWSRFS modeling system as adjusted by the operational hydrologists. The forecast is specific for the river and location identified in bold letters across the top of the graphic. Other locator information about the specific point is displayed on the next two lines (latitude, longitude, elevation, county, and state).
The next section provides the ability to step forward and backward through the archive database one forecast issuance at a time. The date and times of the next and previous forecasts are displayed for your convenience. The bottom liine shows the date/time of the displayed graphical RVF.
The top porton of the historical graphical RVF once again lists the gage ID, river, and location selected. Also, the critical stages that were in effect at the time of the forecast issuance are shown in parentheses. Finally, the exact date and time (Pacific Local Time) is listed for reference.
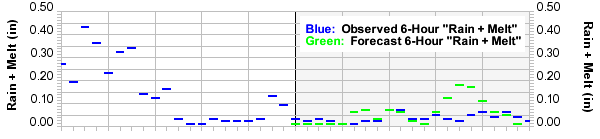
The top graphic plot depicts 10 days of rain plus snowmelt (rain+melt) in inches. Unless labeled otherwise, the values on this graph are reflective of the average over the entire watershed above this location on the river. The blue lines represent 10 days of observed "rain+melt", while the green lines represent 5 days of forecast "rain+melt" from the time of forecast issuance. Observed "rain+melt" is computed from observed precipitation and air temperature. Forecast "rain+melt" is computed from forecast precipitation, air temperature, and snowline elevation. Rain+melt is different from precipitation because, depending upon the air temperature, precipitation can fall as either rain or snow and can also include snowmelt. When the air temperature is cold, precipitation that falls as snow will not appear in this graph. Instead, it will be stored in the modeled snowpack and will show up sometime later when it melts. Alternatively, a ripe snowpack and warm air temperatures will result in rain+melt even though no precipitation was observed or forecast. When a storm system brings a mixture of rain and snow over a watershed, the rain portion (and any associated melt) will appear on this graph.
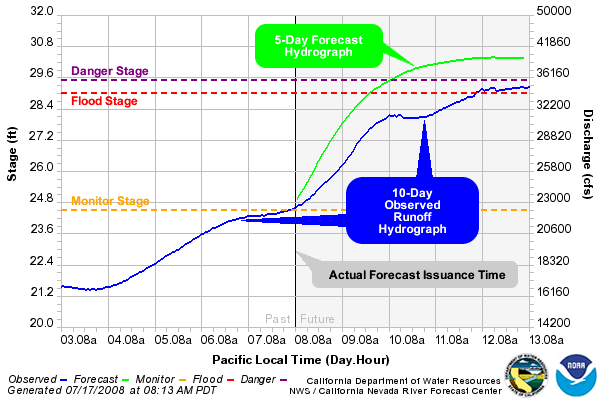
This "rain+melt" input is then processed through a soil moisture model which accounts for surface and subsurface features and dryness. When the soil profile is dry, observed or forecast "rain+melt" may not appear as runoff. Once the soil profile becomes wet, "rain+melt" input will result in runoff. The amount and timing of that runoff is a function of the individual watershed characteristics. Changes in runoff are shown in the bottom half of the graphic. The lower graphic shows a total of 10 days of streamflow comprised of observed (blue), and forecast (green) periods. The axis on the left is stage in feet and the axis on the right is discharge in cubic feet per second (cfs). The observed period covers 10 days, with 5 days prior to the forecast issuance and 5 days following the forecast issuance (which is used for verification purposes on these historical graphical river forecasts). The future period covers 5 days from the actual forecast issuance. On typical graphical river forecasts, this is comprised of a forecast (green) and guidance (magenta) period. For the historical graphical river forecasts, the forecast and guidance periods are combined into one line (green).
|
||||||||||||||||||||||||||||||