
Heavy Precipitation Event Navigation: General Summary | Precipitation | Weather Synopsis | Hydrologic Impacts In the span of one week, a series of mid-December storms in rapid succession rather quickly discredited climate predictions of a drier-than-average La Niña winter in southern California, southern Nevada and much of the the Southwest, producing in some cases record-setting rain and snowfall. The first rains and snow hit California December 16th and subsequent periods of heavy rains continued almost unabated for a week with heavy snowfall in the Sierra Nevada Mountains. The emphasis of the heavier precipitation gradually shifted from northern California southward with each successive wave, punctuated by a final day of heavy rains, thunderstorms, and snow at the higher elevations of southern California/Nevada on the 22nd of December, when a cold upper trough shifted inland from the Pacific and brought an abrupt and welcome end to the wet pattern. Historically with major long-duration West Coast storms involving warm subtropical Pacific moisture, snow levels can often rise to 10,000 feet or higher. The combination of elevated snow levels with very efficient warm rain processes and enhanced orographic precipitation produces signficant runoff contributions from even the highest elevation watersheds that can lead to major flooding. However in this case, a gradual southward shift of the storm track countered this tendency, restraining snow levels in the northern river basins from climbing much above 7,000-8,000 feet in the progressively colder air with each wave. This moderation of snow levels averted any flooding concerns in northern California and northern Nevada, effectively limiting runoff to more manageable levels in northern California watersheds and those along the east slopes of the northern Sierra Nevada that flow into western Nevada. In fact, the storm's impact was mostly beneficial in terms of bolstering snowpack for water supply. [ Click here for an interactive map of precipitation from this event ] A stable and highly-amplified weather pattern across the central and eastern Pacific allowed for copious amounts of subtropical moisture to reach the California coast during the 7-day period ending December 23rd. Widespread precipitation shifted across the entire region with the most impressive totals affecting the southern half of California and Nevada. Locations at the crest of the far southern Sierra, along with the eastern San Gabriel and western San Bernardino mountains saw precipitation totals in excess of 20 inches. Also noteworthy was the plume of moisture that stretched inland across a climatologically dry regime, the Mojave Desert and southern Nevada. Precipitation amounts at certain locations in this arid region surpassed annual average totals in just a 7-day period. Northern California precipitation, although heavy during the 7-day period ending at 4 AM PST on December 23rd, did not match the impressive totals across the southern half of the region. The greatest amounts across this area of the state were in the northern Sierra from the Feather River basin south to the American River basin with totals slightly suprassing 10 inches at the wettest locations. Coastal mountains between the California-Oregon border south to the Russian River basin experienced lighter totals generally from 3 to 6 inches with some locally higher amounts surpassing 8 inches. Similar amounts were recorded over the Shasta Lake drainage. The Sacramento Valley varied from 1 to 3 inches. From north to south, Redding saw 2.54 inches, Red Bluff recorded 1.58 inches, Marysville totaled 2.86 inches, and Sacramento measured 2.68 inches. The least amount of precipitation across northern California was the northeast plateau, which generally ranged from just shy of 1 inch to just over 2 inches. One of the driest locations over the far northeast portion of the state was Alturas, which recorded 0.79 inch for the duration of the heavy precipitation event. Farther inland at this latitude, greatest amounts east of the northern Sierra crest were recorded on the leeside slopes of the mountain range near the California-Nevada border. Totals were generally between 2 and 4 inches with some local amounts reaching 6 inches. Across the rest of northern Nevada, precipitation was much less with the driest valley locations between 0.25 and 0.50 inches, while the wettest locations over the Ruby Mountains ranged between 2 and 3 inches. For the most part, amounts along the Interstate 80 corridor of Nevada averaged near 1 inch. Central California locations were wetter the farther to the south one travelled. For the southern Sierra, widespread precipitation totals of 10 to 20 inches were measured from Yosemite National Park southward. However, near the crest of the southern Sierra between Kings Canyon National Park and Sequoia National Park overall amounts surpassed 20 inches. Along the coast, the Santa Cruz and Santa Lucia Mountains received totals approaching 10 inches. However, across San Luis Obispo County, at the south end of the Santa Lucia Mountains, several locations exceeded 10 inches. The same north-to-south gradient was also true for the San Joaquin Valley. From Stockton, south through Fresno, and eventually to Bakersfield the 7-day precipitation totals ending on December 23rd at 4 AM PST were 1.48 inches, 3.26 inches, and 4.58 inches respectively. In fact, the 4.58 inches at Bakersfield represented 603 percent of a normal December (0.76 inch) and 71 percent of a normal yearly total (6.49 inches). Coastal and mountainous locations of southern California experienced widespread precipitation, heavy to excessive at times as each wave of rain and snow moved onshore. The focus of the most impressive precipitation totals was over the south-facing slopes of the eastern San Gabriel and western San Bernardino Mountains, where amounts exceeding 20 inches were recorded. However, precipitation totals across the Santa Ynez, San Rafael, Santa Ana, San Jacinto, and Laguna Mountains were also well above normal for the time of year, generally ranging from 10 to 20 inches. At coastal stations between Santa Barbara and San Diego, amounts were for the most part between 4 and 8 inches (locally higher). The table below shows precipitation data from select locations and a comparison to a normal December, as well as an average year.
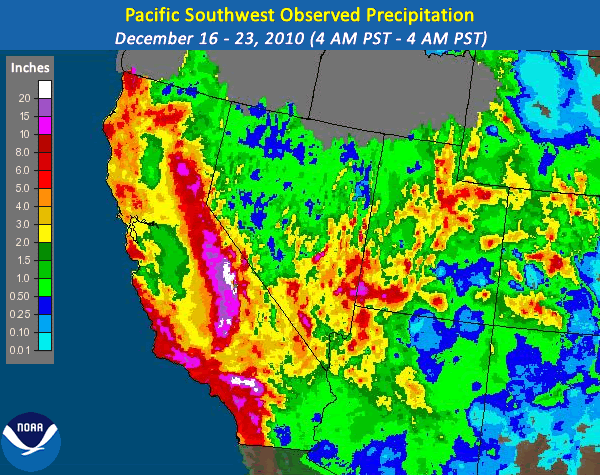
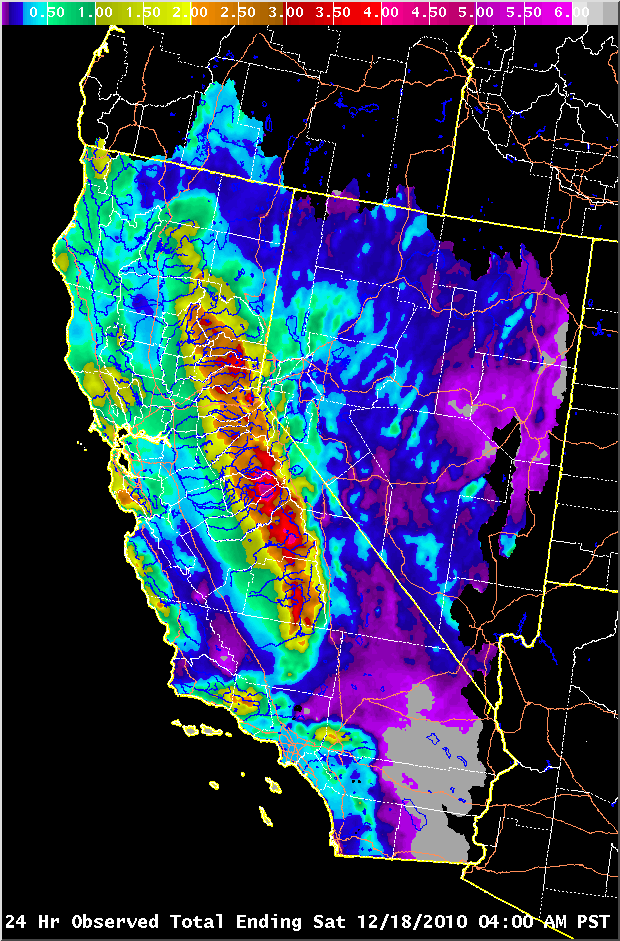
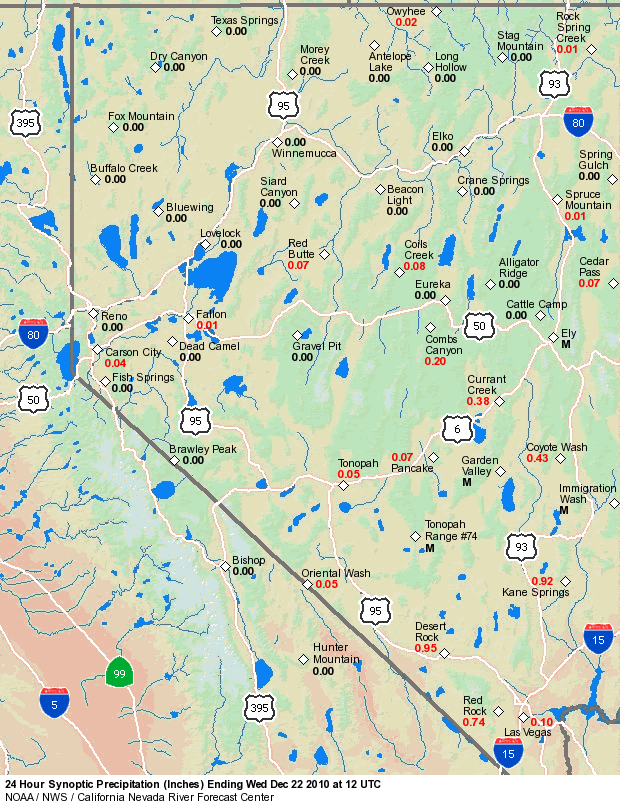
Copious amounts of moisture advected inland in a swath from southwest to northeast and affected areas from the Mojave Desert to southern Nevada before reaching the Wasatch Mountains of Utah. Heavy to excessive precipitation totals were recorded over these locations, well above typical amounts for this time of year. For instance, the precipitation gage located at Apple Valley (just east of Victorville) in the Mojave Desert recorded 6.09 inches of precipitation for the 7-day period ending December 23rd at 4 AM PST. The climatological normal for the entire month of December is 0.51 inches, while a normal year only sees 4.44 inches. In fact, during the 6-hour period from 4 AM PST to 10 AM PST on December 22nd, Apple Valley recorded an amazing 1.35 inches (265 percent of a normal December and 30 percent of a normal year). Further inland, the Spring Mountains just west of Las Vegas recorded precipitation totals in excess of 10 inches and approaching 15 inches for this same 7-day period. These mountains typically receive 2 to 4 inches of liquid equivalent precipitation in December, while seasonal totals range from 15 to 25 inches. Figure 1 below depicts observed precipitation across the Pacific Southwest for the 7-day period ending December 23rd at 4 AM PST, which encompasses the entirety of the heavy precipitation event. The precipitation represented below includes a level of quality control by the National Weather Service River Forecast Centers responsible for these areas. Please note, the image below is missing the observed precipitation across the Pacific Northwest (dark grey areas).
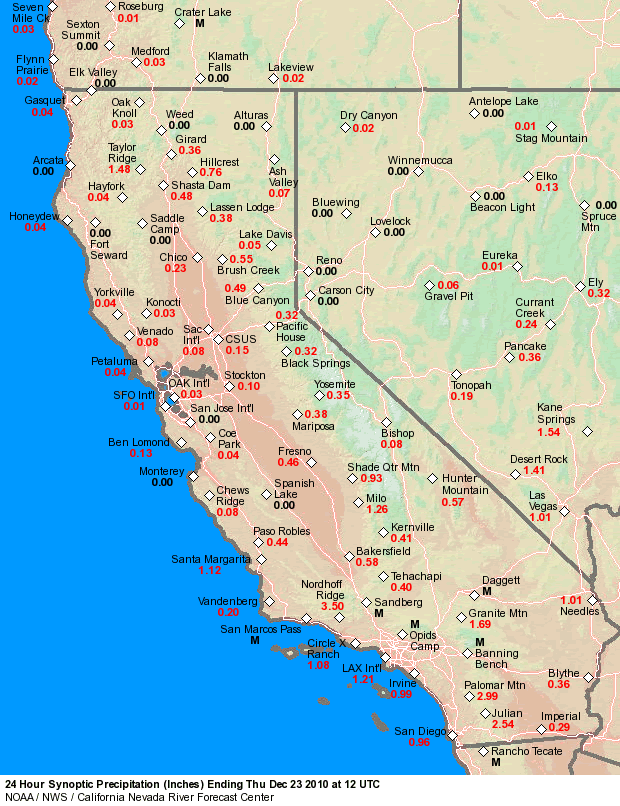
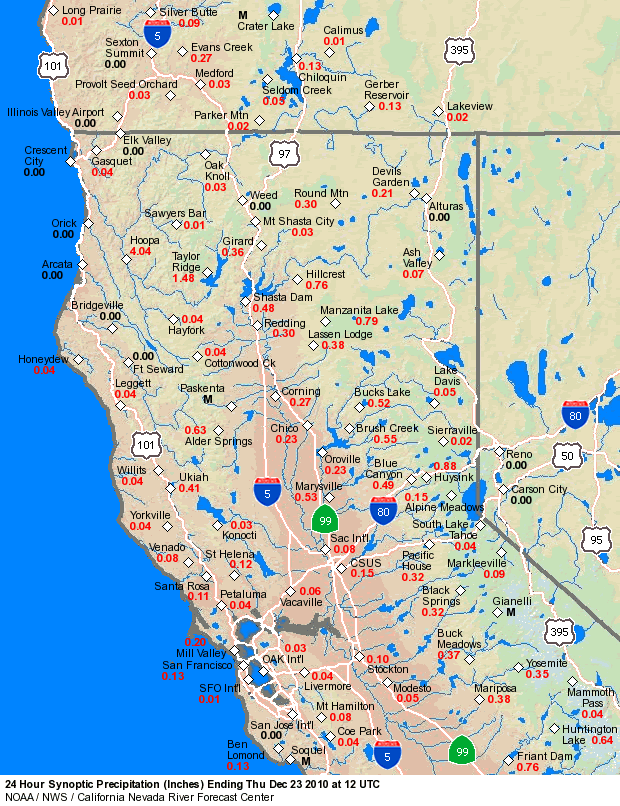
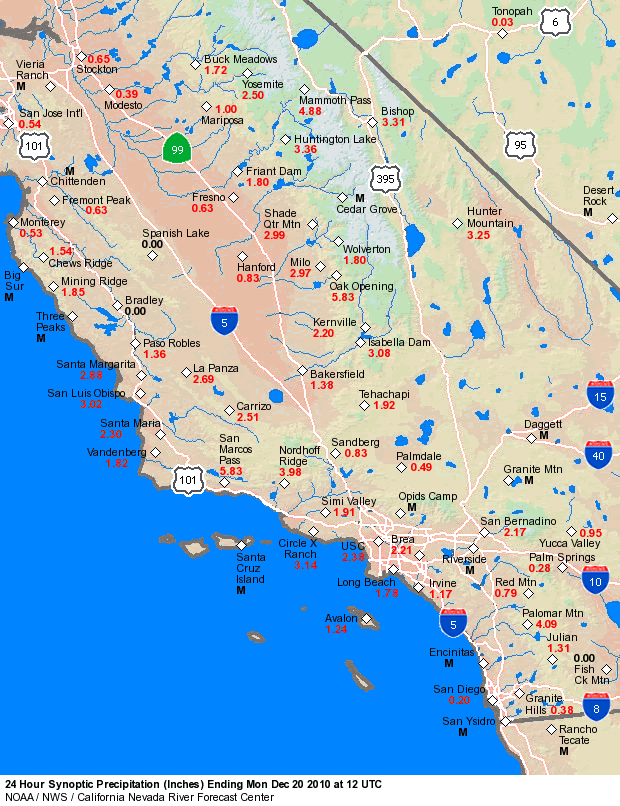
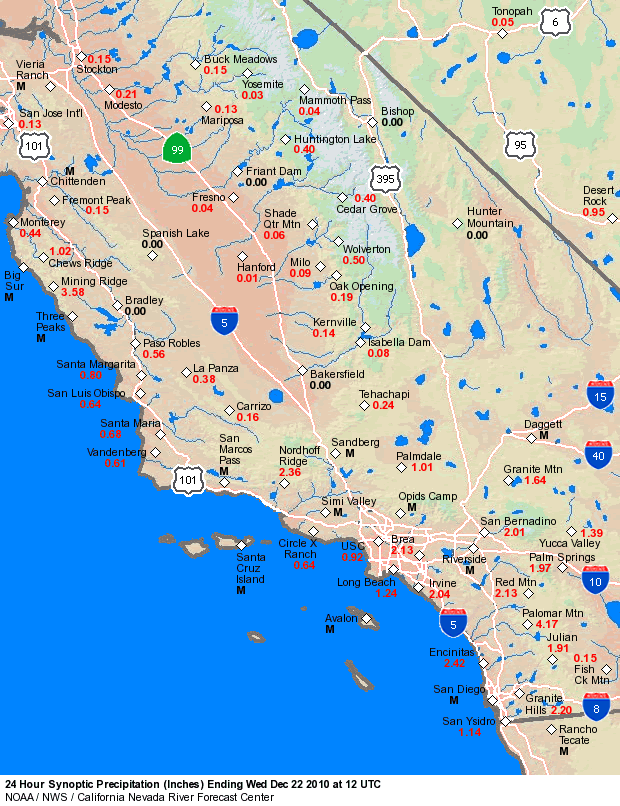
Figure 1. Pacific Southwest 7-Day Observed Precipitation Dec 16 - 23, 2010 (4 AM PST - 4 AM PST). The table below contains links to the daily precipitation totals in gridded (quality controlled), gage (raw data), and KML format (raw data for Google™ Earth) for the 7-day period between Dec 16th at 4 AM PST and Dec 23rd at 4 AM PST. The initial 24-hour period (ending Dec 17th at 4 AM PST) was included to show the light precipitation that moved onshore during the late evening hours on Dec 16th along coastal sections from the San Francisco Bay Area south to the US/Mexico border. This spelled the beginning of the heavy precipitation event.
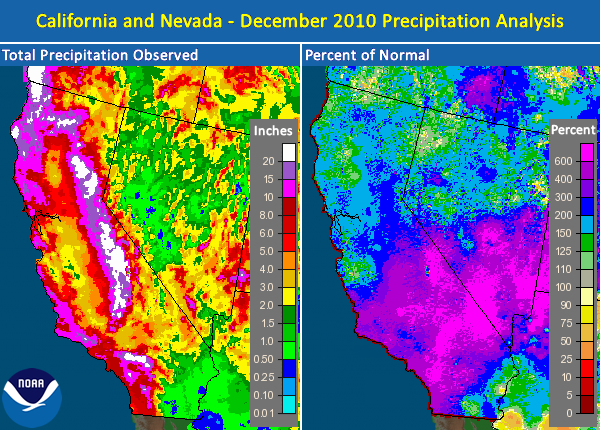
Monthly precipitation totals for December 2010 were above normal across most locations of California and Nevada. While the entire month ended up being wet across the region, a major contributor was the heavy precipitation recorded from December 16th through December 23rd. This was especially true across the southern half of California inland toward southern Nevada. Many of these locations ranged from 300 to 600 percent of normal for the entire month. Figure 2 below shows the total precipitation observed for December 2010 and the corresponding percent of normal. The higher terrain of California showed a large area above 10 inches with several locations along the length of the state surpassing 20 inches. Lower elevations were generally between 3 and 6 inches (locally higher for coastal locations of southern California) with the exception being the lower Colorado River basin where amounts were closer to seasonal normals (0.5 to 1.0 inch). Precipitation across Nevada varied greatly with the most anomalous precipitation values recorded across the southern half of the state.
Figure 2. December 2010 observed precipitation and percent of normal. The California Department of Water Resources 8-Station (Northern Sierra) and 5-Station (San Joaquin) Indices recorded a 3rd straight month of above normal precipitation, rounding out a wet end to calendar year 2010. Approximately 50 percent of the December precipitation total was contributed by the heavy rain and snow observed from December 16th through December 23rd. The table below shows the December 2010 precipitation totals for the 8-Station and 5-Station Indices as compared to normal and how these numbers ranked amongst the historical period of record.
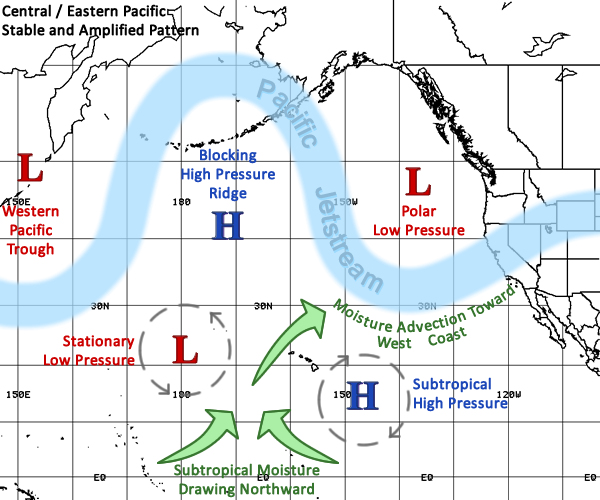
The first week and a half of December was characterized by a series of shortwave troughs affecting the Pacific Northwest. Most of the precipitation from these systems was confined to northern California and northern Nevada and points north, although precipitation on the 5th reached as far south as southern California. A ridge developed off the west coast on the 10th and amplified as it moved over the western states by the 12th. A trough dropping out of the Gulf of Alaska near 160°W impinged on the western side of the ridge and helped to flatten the ridge and push it eastward. The southern end of the trough eventually tracked across northern California on the 14th and brought widespread precipitation as far south as Pt. Conception and the southern Sierras. Meanwhile, a shortwave trough dropped south out of the Arctic Ocean on the 13th and formed a cutoff low over southern Alaska by December 15th at 00Z (December 14th at 4pm PST). This upper low would eventually settle off the Pacific Northwest coast and remain nearly stationary through much of the heavy precipitation event. In addition, a vertically-stacked low pressure system west of Hawaii near the International Date Line remained nearly stationary and drew high precipitable water (PW) values northward from the tropics into the subtropics. This "kona" low advected moisture across the Hawaiian islands and was responsible for minor flooding problems on Oahu on the 19th. [Please see the December 2010 Precipitation Summary from NWS Honolulu for more information.] The subtropical moisture was picked up by the westerly flow on the southern side of the northeast Pacific upper low and directed into California and Nevada and continued streaming into the region for the duration of the event. See Figure 3 below for a schematic of the weather pattern in the central and eastern Pacific from December 16-23.
Figure 3. Weather pattern across central/eastern Pacific and west coast for December 16-23, 2010. Precipitation began to spread into central California during the evening of December 16th. This first wave generally featured scattered showers of moderate intensity and mainly affected portions of California from Los Angeles northward to the northern Sierras through late afternoon on the 17th. Precipitation began to increase in both intensity and aerial coverage by the evening of the 17th as a shortwave moved into the Pacific Northwest and a frontal boundary approached the California coast, with the bulk of the precipitation affecting California from Pt. Conception northward. The front coincided with the arrival of higher PW air originating from the central Pacific. The focus of heaviest precipitation shifted into southern California by morning on the 18th as the front worked its way across the region, while locations north of the front were left with scattered showers. This pattern continued through much of the day on the 18th, with most of the precipitation confined to areas between Los Angeles and the southern Sierras with scattered showers further north. Precipitation increased again over northern and central California by early morning on the 19th as yet another shortwave and associated front dropped into the region. Moderate to heavy precipitation along the front pushed into southern California near Pt. Conception by late afternoon and left scattered showers in its wake further to the north. As the front entered southern California, it became more parallel to the mid-level flow and became nearly stationary. The front oscillated between Pt. Conception in the north and the U.S./Mexico border in the south through the afternoon of the 21st, bringing rounds of moderate to heavy precipitation as the PW plume remained aligned along the front. Moderate precipitation streamed across the southeast California desert areas and across southern Nevada as well. By the evening of the 21st, a shortwave was rounding the base of the cutoff low off the Pacific Northwest coast. The wave intensified overnight as it approached the southern CA coast. The combination of the strong shortwave, an associated cold front, high PW values, and good upper-level divergence led to a period of heavy precipitation along the southern California coast, particularly from the San Bernadino Mountains southward beginning around midnight. Heavy rainfall also fell in the Mojave River basin and into southern Nevada early morning on the 22nd. Moderate to locally heavy precipitation also fell further north across most of California and into southern Oregon as well. Scattered showers and isolated thunderstorms continued across southern California and southern Nevada into the afternoon before finally winding down in the evening. Following is a link to a loop of radar data covering California and Nevada for the entire storm period. Each image is a mosaic of several National Weather Service radars, and together the images in the loop show the multiple waves of precipitation that moved across the region from the evening of December 16th through early morning on the 23rd.
For most of the duration of the storm period, AMSU satellite data showed PW values up to around 1.5 inches in the moisture plume originating from west of Hawaii. With the first wave of heavy precipitation from the 17th into the 18th, PW values topped out around 1-1.3 inches along coastal locations as indicated by upper air soundings (RAOBs) and GPS-MET sensors (see table below for links). PW values dropped off behind the cold front most dramatically in northern California, while portions of central and southern California saw moisture levels remain consistently high following the initial front. PW values spiked to near 1 inch again on the north coast of California on the 19th with the arrival of the next front and dropped to around 0.5 inches by late afternoon following frontal passage. Central California coastal stations topped out around 1-1.4 inches of PW and then fell by late afternoon as well. Moisture levels would remain relatively low for northern and central California for the remainder of the event. However, as the moisture plume parked over southern California beginning on the 19th, PW values near the coast remained in the 1-1.4 inch range through early on the 22nd, when they finally dropped off during the afternoon following the passage of the shortwave aloft. At their peak, PW values reached 150-235% of normal for virtually all RAOB sites in California and Nevada. In addition, winds near and ahead of the frontal boundaries were out of the SW up to 40 knots at 850 mb and out of the WSW at 40-60 knots at 700 mb. This combination of high PW values and strong winds led to modelled 850 mb moisture flux standarized anomalies of +3 to +6 along the central and southern California coast. The following table displays links to various types of satellite depictions that follow the evolution of the heavy precipitation event. The infrared imagery shows the enhanced cold cloud tops associated with the waves of precipitation moving into California and Nevada, and also shows several surface and upper-level low pressure systems off the Pacific Northwest coast. The water vapor imagery reveals the upper-level lows as well as the deep subtropical moisture plume streaming into the area. The AMSU precipitable water imagery depicts the tropical moisture tap west of Hawaii and the advection of this moisture eastward into California and Nevada, with peak values in excess of 1.5 inches.
Freezing levels started off relatively high in the warm sector ahead of the initial cold front. Freezing levels on the 18th were as high as 7,000-8,500 feet in northern California and western Nevada, 8,000-10,000 feet in central California, and 10,000-11,000 feet in southern California. Freezing levels fell about 2,000 feet in northern and central Calfornia behind this front, before rebounding a bit before the next front came ashore. The front largely dissipated before reaching southern California, and freezing levels did not lower much following the first wave of precipitation. With the second front on the 19th, freezing levels started off around 6,000-8,000 feet in northern California, 7,000-9,000 feet in central California, and 8,000-11,000 feet in southern California. Behind this front, freezing levels fell to around 4,000-6,000 feet across northern and central California and remained relatively low for the remainder of the storm event. As the front became nearly stationary over southern California, the freezing levels remained near 9,000 feet at San Diego while falling to 6,000-8,000 feet further north at Vandenberg AFB. Somewhat cooler air finally made it to San Diego and lowered the freezing levels following the passage of the final cold front early morning on the 22nd. The following table provides links to snow level plots as measured by radar wind profilers:
The table below contains links to upper air soundings from across the region from near the onset of the precipitation through the duration of the event. Note that Oakland and Reno soundings are available every 6 hours on December 18-19 due to supplemental soundings in support of the Hydrometeorological Testbed (HMT) project. Some items of note in these soundings are as follows:
The following table summarizes the performance of the GFS-based Rhea orographic aid guidance beginning with the December 14 00Z (December 13 4 PM PST) run and continuing through the December 22 12Z (4 AM PST) run for several basins in the central and southern Sierras and southern California along with corresponding verification data. In general, the orographic aid was too light in forecasts made a few days prior to the onset of precipitation. The forecast from the orographic aid started to improve significantly in the Sierras beginning around the 15th at 00Z (14th at 4 PM PST), while improvement was noted in southern California basins around the 17th at 00Z or 12Z (16th at 4 PM PST or 17th at 4 AM PST), depending on the location.
The following table provides links to 6-hourly NCEP/NCAR Reanalysis data composites for the period of December 15, 2010 at 00Z (December 14 at 4 PM PST) through December 23, 2010 at 12Z (4 AM PST). This time range encompasses a few days leading up to the event and the duration of the heavy precipitaiton.
The final table below lists the daily Hydrometeorological Discussions issued for the 16th through the 23rd of December. These narrative discussions begin with a summary of the past 24 hours of precipitation, and continue with an analysis of current and forecast weather focusing on QPF, a summary of daily QPF for the next three days, and end with a general summary of current and forecast hydrologic conditions.
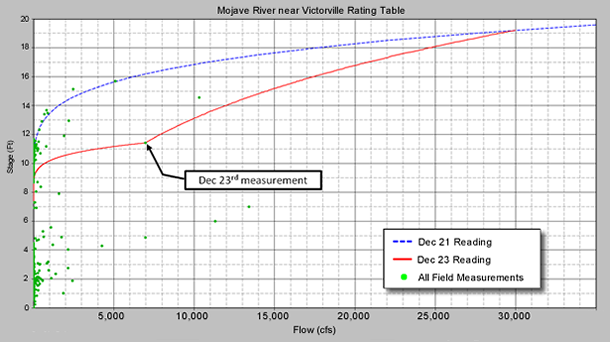
The precipitation that fell over California from December 16th through the 23rd did not cause any river flooding in Northern California and the Central Valley. However, Southern California experienced severe flash flooding and river flooding including the Santa Margarita, San Diego, and Mojave Rivers. The San Diego River at Fashion Valley (FSNC1) exceeded flood stage by almost three feet and crested right at 14 feet, the highest in 29 years. Access roads to residential and commercial buildings including the Fashion Valley Mall were flooded stranding many people. Flooding could have been even worse if it weren’t for the help of El Capitan and St. Vicente reservoirs upstream. They both absorbed all the runoff for their respective watersheds (approximately 60% of total drainage area at Fashion Valley). The following graphic link shows the forecast progression and river observations over the course of the event at FSNC1. The Santa Margarita River at Ysidora (YDRC1) was another Southern California location that is believed to have exceeded flood stage. This gage actually was damaged during the evening of December 20th which was well before the peak. This definitely impacted the forecast accuracy during the period in which Ysidora exceeded flood stage. The upstream gage on the Santa Margarita River near Fallbrook crested at approximately 25,500 cfs in the early morning hours of December 22nd. So Ysidora most likely crested a few hours later in the 25,000-30,000 cfs range. The following graphic link shows the river forecasts (green) and what are believed to be best estimates of the observations (blue). The Mojave River at Victorville (MVVC1) exceeded flood stage by nearly three feet during the early morning hours of December 21st, cresting at 18.84 feet, and nearly hit flood stage again during the morning of December 22nd. A levee also failed farther downstream near the town of Barstow that caused flooding along Marks and Soap Mine Road. Flood forecasting accuracy was challenging at Victorville for a few reasons at this location. For one, the flow/stage relationship is marginal at best for flood flow conditions. There was a tremendous amount of scour that occurred in the main channel during the event which made rating curve estimates problematic. The following graphic link shows our forecasts along with the observed values. You can see in this looping image that the observed values for the second rise that occurred on December 22nd dropped by a couple of feet. This was due to updated rating curve information from the USGS which was based on new flow measurement data. The following graphic shows how variable the flow/stage relationship can be at Victorville. Almost the exact same flow value that was estimated on Dec 23rd at a stage of 11.4 feet was also estimated back in January of 1993 at a stage of 4.85 feet. As you can see, there is roughly an 8 to 10 foot spread in the measurement data for a given flow. The blue line represented the rating curve coming into the December event, and the red line represents the updated rating curve after the December 23rd flow measurement was accounted for.
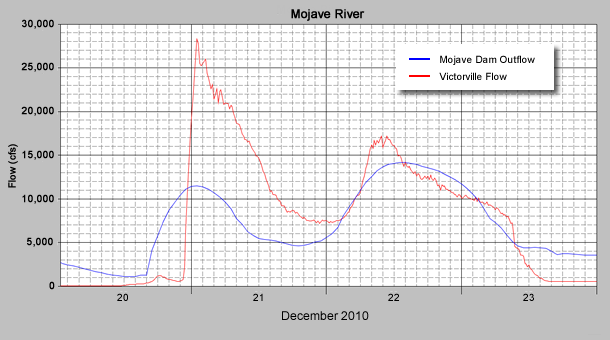
Another factor that added to the forecasting difficulty was the large amount of precipitation that fell in the ungaged drainage area below Mojave Dam, and upstream of Victorville. Nearly six inches of rain fell at the Oro Grande gage(OGDC1) through the early morning hours of the 21st. Rainfall intensity could have been even greater closer to the Victorville stream gage, but it is hard to say given the sparse precipitation network in this area. As you can see in the following plot, the outflow from Mojave Dam did not even account for half of the flow estimated at Victorville.
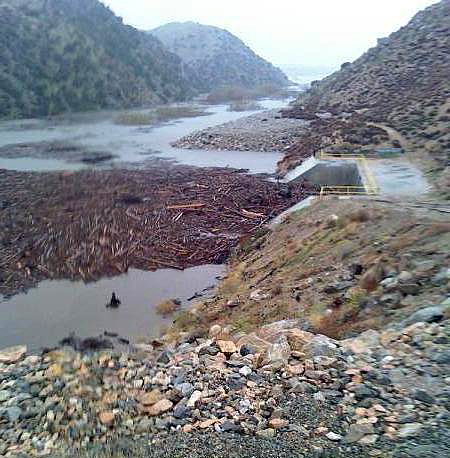
However, the flow estimates at Victorville have to be taken with caution given the amount of uncertainty in the rating curve. Another forecasting challenge for Victorville was estimating a reasonable outflow from Mojave Dam. There can be a substantial amount of debris build-up at both the intake and the downstream side of the Mojave Dam outlet. The following pictures were provided by the U.S. Army Corps of Engineers - Los Angeles District.
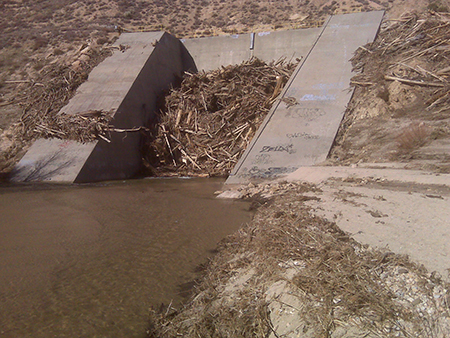 Mojave Dam Outlet Plugged with Debris - Post December 2010 Event Since there is no outflow gage at Mojave Dam, an outlet rating curve is used to calculate the discharge; however, no debris is assumed in this estimate. So the actual outflows could have been a bit muted from what was shown in the previous Mojave River hydrograph plot. There were a couple of other Southern California forecast locations that saw significant rises, but did not reach flood stage. The Sisquoc River near Garey (GARC1) crested above monitor stage at 12.5 feet - about 3.5 feet below flood stage. The San Luis Rey River near Oceanside (SLOC1) peaked at 17 feet - 4 feet below flood stage. The Sierra Nevada saw significant snow pack accumulations during the event, but only modest rises on the Sacramento and San Joaquin Rivers with nothing that exceeded monitor stage. The Sacramento River System experienced weir flow at Colusa, Tisdale, and Fremont Weirs sending minor flows into the Sutter and Yolo Bypasses. Inflows to the major flood control reservoirs were not very significant, and ranged from 10-40 kcfs (see tables below). Starting storage levels at these reservoirs varied from well below to right at the bottom of the flood control resulting in ample storage space to absorb the inflow volumes and maintain safe releases downstream.
The one Central Valley river system that did see monitor stages exceeded was the Cosumnes/Mokelumne River. The most upstream forecast point on the Cosumnes, Michigan Bar (MHBC1), crested at 9.7 feet – about 2.5 feet below flood stage. Downstream at McConnell (MCNC1), the river crested at 44.6 feet – about 1.5 feet below flood stage. And down on the Mokelumne River at Benson Ferry (THTC1), the river crested at 12.9 feet – about 4 feet below flood stage. The table below includes hydrographs for the "Flood Forecast Points" that exceeded a critical stage during the high water event from December 16 - 23, 2010. The majority of these points have been mentioned previously in more detail in this report.
|
|||||||||||||||||||||||||||||||||||||||||||||||||||||||||||||||||||||||||||||||||||||||||||||||||||||||||||||||||||||||||||||||||||||||||||||||||||||||||||||||||||||||||||||||||||||||||||||||||||||||||||||||||||||||||||||||||||||||||||||||||||||||||||||||||||||||||||||||||||||||||||||||||||||||||||||||||||||||||||||||||||||||||||||||||||||||||||||||||||||||||||||||||||||||||||||||||||||||||||||||||||||||||||||||||||||||||||||||||||||||||||||||||||||||||||||||||||||||||||||||||||||||||||||||||||||||||||||||||||||||||||||