
Late November / Early December 2012 Heavy Precipitation Event Navigation: General Summary | Precipitation | Weather Synopsis | Hydrologic Impacts The final three days of November and the first two days of December saw a series of mild Pacific storms hit California in rapid succession, unleashing heavy precipitation across mainly the northern half of California and into western Nevada. Although the hydrologic impacts were relatively minor in relation to some past events, it was deemed worthy of documentation as this series of storms contained many of the same classic ingredients that often lead to disastrous flooding along the West Coast. Most notable characteristics in this particular series of storms were some of the extreme 6-hour rainfall intensities that occurred, and the high degree of forecast confidence as models were able to accurately detect this event several days in advance. That high degree of forecaster confidence translated into better-detailed advanced warning with long lead times, providing public officials and the general public critical time to prepare. Following a week of wet weather just prior to Thanksgiving (November 22nd), longer-range models began to raise awareness to the increasing potential of another prolonged heavy precipitation event towards late November. The prospects for a more significant hydrologic event in northern California heading into late November were recognized early on, factoring in the wet antecedent conditions from this earlier storm period. From that earlier week-long series of storms, precipitation totals generally ranged between 6 and 10 inches in the wetter location across much of northern California. Fortunately from a flooding perspective, a ridge of high pressure provided an intervening stretch of dry weather that lasted from the day after Thanksgiving until the 28th, when the first in the series of late November-early December storms arrived. While that first storm on Wednesday the 28th was not all that impressive on its own merits both in terms of precipitation and runoff, it resaturated basins that had a chance to dry out since the earlier week of wet weather prior to Thanksgiving. The subsequent string of storms that followed was bolstered by a mid-latitude stream of mild Pacific air and deep moisture transported first northward, then eastward along a moisture plume that connected the subtropical Pacific between the dateline and Hawaii with northern California. The merger of this warm subtropical air and colder arctic air from a broad low pressure system in the Gulf of Alaska formed a strong upper jet across the eastern Pacific, but this area was located far enough offshore leaving northern California in a milder southwest flow pattern on the warm side of the upper jet. As a result, snow levels were elevated above the highest basins throughout much of the event, lowering only at the last moment as a final strong cold front signaled an abrupt end to the 5-day event on Sunday, December 2nd. As the second round of heavier precipitation rolled into northern California late Thursday, December 29th and continued into Friday, December 30th, rivers responded much more sharply but held below any critical levels with the exception of the Navarro River on the north coast. Precipitation rates were impressive, exceeding 3 inches in 6 hours at times in a few locations including Brandy Creek in the Sacramento River basin, and rain gages at Venado and Angwin in the Russian and Napa basins. Precipitation then ramped up again later on Saturday afternoon and evening on the north coast of California as another surge of moist subtropical air combined with strong onshore winds, all well in advance of a strong cold front due early Sunday. It was interesting to note that temperatures at this time were very mild with nighttime readings in the upper 50s to low 60s across the area. As anticipated well in advance, the final round of heaviest precipitation was associated with the approach of a strong cold front whose back edge would reach the coast of northern California around 5 AM PST Sunday, Dec 2nd. This final round of heavy precipitation caused many rivers to spike briefly above either monitor or flood stage levels from the north coast southward to the Russian and Napa basins. Again, 6-hour precipitation rates were equally impressive with a report of over 5 inches at Brandy Creek occurring between 10 PM PST Saturday night and 4 AM PST Sunday morning, as just one example. On the east side of the Sierra Nevada, the Truckee River system was spared of any flooding on that Sunday, even as the final period of heaviest spillover precipitation occurred across the eastern slopes into western Nevada. In this case, the extreme sensitivity in the snow level/runoff relationship in the Truckee basin was clearly demonstrated as heavy rainfall changed over to snow in the upper basin, inhibiting runoff during the most critical precipitation period of the event. More about the impacts of snow levels on runoff in these high elevation basins can be found in the paper "An Automated Brightband Height Detection Algorithm for Use with Dopper Radar Spectral Moments". The lower elevation Susan River basin to the north didn't fare as well with flood stage exceeded by about a foot Sunday morning. The intense precipitation observed over the northern half of the region during this period helped to push seasonal precipitation totals to well above normal for early December, setting a critical base for what would end up being a well-below-average period to follow. During the 5-day period from Nov 27 10 PM PST to Dec 2 10 PM PST, widespread precipitation totals along the coast from the Napa basin northward were in excess of 10 inches of precipitation, while totals over mountain locations were in the range of 10 to 15 inches. The second and fourth storms to pass through the region brought the highest precipitation totals to the area, driven by strong pulses in the jet stream and anomalously high precipitable water amounts. Favorable orographics also played a role in enhancing totals over coastal and mountain locations during these events, as is detailed in the Weather Synopsis section. The following link contains an interactive map of storm-specific and overall storm-total precipitation for the period encompassing the late evening of November 27th through the late evening of December 2nd. Data contained on the map has been quality controlled by CNRFC staff. The table below contains links to the daily precipitation totals in gridded (quality controlled), gage (raw data), and KML format (raw data for Google™ Earth) for the 5-day period between Nov 28th at 4 AM PST and Dec 3rd at 4 AM PST, which encompassed the rounds of heavy precipitation during this significant event.
The California Department of Water Resources (CADWR) has been tracking precipitation data over the mountains of Northern CA since 1920, using data from eight precipitation gages located from Shasta Lake south into the American River basin. The 8-Station Index, as it is referred to, received anomalously high precipitation totals, nearly 13 inches, during this period of time, as can be seen in the table below. This 5-day total is 26% of the average seasonal precipitation tallied by the 8-Station Index over the course of an entire water year. A similar index has been developed by the CADWR for quantifying precipitation over the San Joaquin basin, and is referred to as the 5-Station Index. While overall precipitation totals fell off as the series of systems pushed southward, the table below shows nearly 7 inches of accumulated precipitation during the 5-day period. This accounts for 17% of the average total seasonal precipitation over the 5-Station Index area.
Following a wet period from November 15th through the 22nd, high pressure began to build aloft across the region later in the day on the 22nd. This provided mainly dry conditions across the region for several days leading up to the late November into early December storm event, with the exception of some minor precipitation amounts near the southern Oregon border.
Figure 1. General weather pattern across the Eastern Pacific Ocean and West Coast Integrated Precipitable Water (IPW) from numerous GPS-MET sensors across northern and central California and northern Nevada indicate three periods of elevated moisture levels, which correspond to each of the main waves of precipitation. The first system showed peak IPW values around 1.1 to 1.2 inches overnight on November 29th into the 30th near the Russian and Napa basins, the San Francisco Bay Area, and the San Joaquin Valley. The next round of moisture was a little more impressive, with IPW values topping out around 1.2 to 1.4 inches later on the 30th over much the same areas as the first system. The wave of precipitation in the northern portion of the region on the night of November 30th into December 1st did not feature a noticeable increase in IPW values, with most of the locations receiving precipitation remaining below 1 inch of IPW. In general, moisture levels were the highest with the final wave of precipitation, when many locations reported IPW values near 1.4 inches from the north coast all the way to the San Joaquin Valley later on the 1st into the 2nd. IPW dropped off dramatically behind the final cold front later on December 2nd. As noted earlier, snow levels played a particularly critical role during this storm event, especially with the last storm in the series. The table below summarizes the evolution of snow levels as depicted by vertically-pointing radars at Lake Shasta, Oroville (at the base of the far northern Sierra Nevada), and Sugar Pine (located in the northern Sierra Nevada near I-80 at 3,500 ft elevation). As shown by these radars, snow levels generally started out around 6,000 to 8,000 feet with the first system on the 28th. Snow levels were more consistently around 8,000 feet on the 29th and fell to around 6,000 to 7,000 feet in the far northern Sierra Nevada and Lake Shasta area on the 30th near and behind the cold front. In the relative lull in precipitation on December 1st, snow levels were harder for the radars to identify, and generally ranged from 6,000 to 7,000 feet near Lake Shasta and 7,000 to 9,000 feet in the northern Sierra Nevada. Finally, snow levels rose again to 8,000-10,000 feet on the morning of December 2nd ahead of the final cold front. Snow levels rapidly fell as low as 7,000 feet according to the radar sensors later on the 2nd as the sharp cold front moved across the region, thus turning heavy rain into heavy snow in the higher elevations of the northern Sierra Nevada.
Following is a link to a loop of radar data covering California and Nevada for the entire storm period. Each image is a mosaic of several National Weather Service radars, and together the images in the loop show the multiple waves of precipitation that moved across the region from the afternoon of November 28th through early morning on December 3rd.
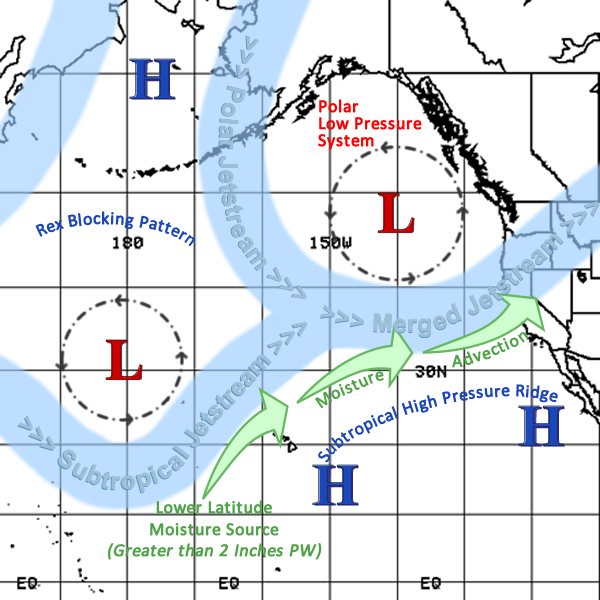
The following table displays links to various types of satellite depictions that follow the evolution of the heavy precipitation event. The AMSU precipitable water imagery depicts the development of the tropical moisture tap near Hawaii and the advection of this moisture eastward into California and Nevada, with peak values in excess of 1.8 inches.The infrared imagery shows the enhanced cold cloud tops associated with the waves of precipitation moving into California and Nevada, and also shows several surface and upper-level low pressure systems off the west coast. The water vapor imagery reveals the upper-level lows as well as the deep subtropical moisture plume streaming into the area.
The following table provides links to 6-hourly NCEP/NCAR Reanalysis data composites for the period of November 27, 2012 at 12Z (4 AM PST) through December 3, 2012 at 12Z (4 AM PST). This time range encompasses the entire duration of the heavy precipitaiton. A few of the fields also include departures from normal as well.
The table below contains links to upper-air soundings from across the region from just prior to the onset of the precipitation and continuing through the duration of the event. Some items of note in these soundings are as follows:
North Coast Heavy precipitation north of Arcata brought numerous rivers in this area above their defined monitor stages as soils became saturated and runoff increased with each subsequent storm. However, flows along the Scott, Klamath, and Smith Rivers were not high enough to surpass defined flood stages. Slides and localized flooding were reported along area roadways, but impacts from these rising rivers was minimal. Along the Mad River, soils increasingly became saturated with each period of precipitation during this significant event. The rounds of heavy precipitation culminated later Saturday into early Sunday with the river at Arcata (ARCC1) rapidly rising above monitor stage and peaking slightly above flood stage just before noon on December 2. The primary impact was the flooding of roads. In particular, Humboldt County Public Works closed Mad River Road to Tyee City due to the high waters. Also, flooding was reported on the road by Hammond Creek Bridge. Much of the flooding associated with the rising Eel River was near the town of Ferndale and near the river's mouth in the Eel River Delta. The gage at Fernbridge (FRNC1) topped out 3 feet above (23 feet) its defined flood stage (20 feet) on Sunday evening. Farther upstream, two locations in the Eel River basin topped their defined monitor stage. Along the Van Duzen River at Bridgeville (BRGC1), the river topped out just over 16 feet (approximately 3 feet above monitor stage). On the South Fork of the Eel River at Miranda (MRNC1), the river clipped its monitor stage. No significant impacts were reported at these locations. The table below includes links to hydrographs for river locations along the North Coast rivers. These hydrographs show river conditions before the periods of heavy precipition, the peaks during the event, and the recessions when the weather turned drier.
The two significant rises on the Russian, Napa, and Navarro Rivers were the result of intense precipitation that initially fell from Thursday night (Nov 29) into Friday morning (Nov 30), and a second round Sunday morning (Dec 2). The Russian River was able to manage the increased runoff with the only critical stage threshold surpassed at Hopland (HOPC1), where the second rise crested just shy of 20 feet (monitor stage is 18 feet). There were some questions as to the validity of the data at the Hopland gage, but a USGS real-time measurement just prior to the highest peak verified stage and flow data at that time. No significant impacts were reported along the Russian River. Heavy precipitation over the Napa River basin led to two sharp rises along the river with the second period of intense rainfall occurring less than 48 hours after the first round of heavy precipitation. With the basin becoming increasingly saturated, the Napa River at Saint Helena (SHEC1) peaked just above its flood stage on Sunday (Dec 2). The lower stretches of the river at Napa (APCC1) just clipped its monitor stage. Overall impacts were minimal. At Saint Helena flooding in the downtown area was localized, with no significant damage reported. A double crest also occurred along the Navarro River with both peaks surpassing flood stage at Navarro (NVRC1). The first peak was on Friday morning (Nov 30) just above flood stage, while the second rise topped out approximately 7 feet above flood stage. The primary impact during this event was the closure of State Highway 128 due to flooding. The table below includes links to hydrographs for river locations along the Russian, Napa, and Navarro Rivers. These hydrographs show river conditions before the periods of heavy precipition, the peaks during the event, and the recessions when the weather turned drier.
The majority of the increase in flows along the Sacramento River was due to contributions from the creeks below Shasta Dam. Since Shasta Lake had plenty of flood control space remaining in the reservoir going into this heavy precipitation event, releases were able to be kept at a minimum (4,700 cfs) throughout its duration. This muted the peaks on the Sacramento River. Several locations below the dam approached or surpassed their defined monitor stage, but only Tehama Bridge (TEHC1) exceeded its flood stage (213.0 feet) by 0.5 feet. The video in the link below was taken on the morning of Sunday December 2nd near the time of the peak flow on Battle Creek at the Coleman National Fish Hatchery (operated by the US Fish and Wildlife Service). The nearby stream gage near Cottonwood (COTC1) recorded a peak stage of 10.1 feet, which corresponds to a flow of 11,842 cfs. This example represents well the contribution of the creeks below Shasta Dam to the flows in the Sacramento River.
Figure 2. Battle Creek at Cottonwood (COTC1) observed hydrograph for Nov 25th to Dec 10th. Overall, the Sacramento River Flood Control Project was able to easily handle the increase in flows. Three of the five weirs on the Sacramento River saw overflow during the heavy precipitation event. The first weir from north to south is Moulton Weir. Flows in the Sacramento River were never high enough for water to spill over the concrete structure toward the Butte Basin. Just downstream at Colusa Weir (1 mile north of the town of Colusa), just over 4 feet of overflow was observed during the peak of the event. Water from this structure also flows toward the Butte Sink. Further downstream, Tisdale Weir (10 miles southeast of the town of Meridian) is typically the first to see overflow conditions. In fact, several peaks were observed as water overflowed into the Sutter Bypass between the evening of December 1 through the evening of December 8. Farther downstream at Fremont Weir, overflow into the Yolo Bypass was minimal as water reached just above the lip of the weir (0.4 foot). Finally, the Sacramento Weir (the only weir "opened" or "closed" on the flood control project), which consists of 48 gates, was not utilized during this heavy precipitation event as flows were not expected to reach a critical threshold at the I Street Bridge (downstream of the confluence of the Sacramento and American Rivers). The table below includes links to hydrographs for river locations along the Sacramento River. These hydrographs show river conditions before the periods of heavy precipition, the peaks during the event, and the recessions when the weather turned drier.
Heavy precipitation and high snow levels resulted in increased runoff over foothill river basins east of Sacramento. The Cosumnes River saw several rises during this event with the peak occurring during the evening hours on Sunday (Dec 2), as the heaviest precipitation fell and soils became saturated. At both Michigan Bar (MHBC1) and McConnell (MCNC1) the river surpassed monitor stage. Unfortunately, an incorrect reading at McConnell showed the river level lower than what actually was being observed. The table below includes links to hydrographs for river locations along the Cosumnes River. These hydrographs show river conditions before the periods of heavy precipition, the peaks during the event, and the recessions when the weather turned drier.
The heightened potential for flooding across eastern Sierra Nevada and extreme western Nevada river basins peaked Sunday morning as a warm moist environment brought raised snow levels and heavy spillover precipitation to the area. Lassen County personnel (including the city of Susanville) were appreciative of the accurate river forecasts well ahead of the event, which allowed for much needed preparations (2 to 3 days in advance) to limit the flood impacts along the Susan River. Debris was cleared from the channel and above bridges that cause backups, while sandbags and plastic sheeting were placed at low points along the river. Some minor flooding of yards along the Susan River in Susanville was reported during the peak of the event. County officials also stated it was fortunate that McCoy and Hog Flat Reservoirs were empty with Lake Leavitt being low, as these took a large portion of the runoff. Also, timing of this event was fortunate since soils in the basin were yet to freeze and the ground was barren of significant snow cover. A bit farther south, river forecasts were less accurate along the Truckee River with projections of potential flooding. This was especially true in the city of Sparks and its industrial area, where expansive sandbagging efforts took place well ahead of the event. As forecast, heavy precipitation did spillover across the crest of the Sierra Nevada into extreme western Nevada. However, the key parameter that spared the Reno area from the expected flooding was a more rapid drop in the snow levels as the frontal boundary ushered in colder air. During the later morning hours of Sunday December 2, 2012, the forecast snow levels were between 8,000 and 9,000 feet. However by 10 AM PST, snow was being reported along California State Highway 89 next to the Truckee River, signaling that snow levels had already fallen to at least 6,000 feet. With the phase of the precipitation being primarily frozen in the Truckee River basin, flooding concerns subsided. Snow levels are just as important as precipitation when forecasting hydrology over eastern Sierra Nevada and extreme western Nevada river basins. If snow levels had remained between 8,000 and 9,000 feet during the period of heaviest precipitation, somewhere between 85 and 95 percent of the Truckee River basin would have received liquid precipitation. However, with the snow level down to approximately 6,000 feet by the later Sunday morning hours, only roughly 15 percent of the river basin was receiving liquid precipitation during the peak of the event. The table below includes links to hydrographs for river locations along the Susan and Truckee Rivers. These hydrographs show river conditions before the periods of heavy precipition, the peaks during the event, and the recessions when the weather turned drier.
Heading into the period of heavy precipitation, the three major northern California reservoirs sat well below the top of their conservation space with Shasta Lake 77% below, Lake Oroville 298% below, and Folsom Lake 53% below for November 25, 2012. As a result, releases from these flood control projects remained low and manageable. Shasta Lake was able to reduce its releases in response to added flows from the creeks below the dam making their way into the Sacramento River. Given the large amount of conservation space in Lake Oroville, releases were held nearly steady throughout the duration of the heavy precipitation event. At Folsom Lake, releases were increased to 5,000 cfs (from 1,850 cfs) for just over two days at the beginning of December as the reservoir approached its top of conservation space. For the period of November 25 to December 10, 2012 these three reservoirs added just over 1.3 million acre-feet of storage. Shasta Lake saw the biggest jump of ~580,000 acre-feet, while Lake Oroville was a close second with ~503,000 acre-feet. Folsom Lake added ~222,000 acre-feet. As a result, all three flood control projects were closer to their top of conservation space. In fact, Folsom Lake became slightly encroached. On December 10, 2012, Shasta Lake was now 17% below, Lake Oroville 67% below, and Folsom Lake 3% above the top of conservation space. In the table below are links to individual graphs for each of the three major northern California reservoirs, indicating: Inflows (cfs), Releases (cfs), and Storages (Ac-Ft) / Elevations (Ft).
|
|||||||||||||||||||||||||||||||||||||||||||||||||||||||||||||||||||||||||||||||||||||||||||||||||||||||||||||||||||||||||||||||||||||||||||||||||||||||||||||||||||||||||||||||||||||||||||||||||||||||||||||||||||||||||||||||||||||||||||||||||||||||||||||||||||||||||||||||||||||||||||||||||||||||||||||||||||||||||||||||||||||||||||||||||||||||||||||||||||||||||||||||||||||||||||||||||||||||||||||||||||||||||||||||||||||||||||||||||||||||||||||||||||||||||||||||||||||||||||||||||||||||||||||||||||||||||||||||||||||||||||||||||||||||||||||||||||||||||||||||||||||||||||||||||||||||||||||||||||||||||||||||||||||||||||||||||||||||||||||||||||||||||||||||||||||||||||||||||||||||||||||||||||||||||||||||||||||||||||||||||||||||||||||||||||||||||||||||||||||||||||||||||||||||||||||||||||||||||||||||||||||||||||||||||||||||||||||||||||||||||||||||||||||||||||||||||||||||||||||||||||||||||||||||||||||||||||||||||||||||||||||||||||||||||||||||||||||||||||||||||||||||||||||||||||||||||||||||||||||||
