|
 |
||
 |
| HOME |
|
HAS QPF Process Mountain
Mapper
|
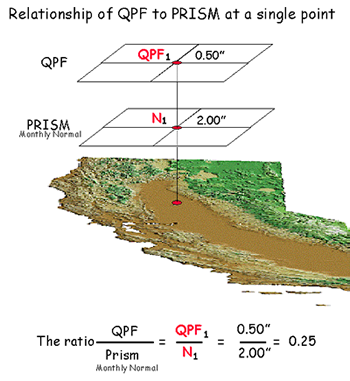
Mountain Mapper Programs in the Mountain Mapper suite of software share a common underlying principle of using monthly PRISM precipitation data to account for the impact of topography on the distribution of observed and/or forecast precipitation in developing a gridded dataset. To better understand what Mountain Mapper software accomplishes, let's begin by looking at a single QPF point, and eventually describe how the process can develop an areal basin estimate of rainfall (MAP) from a grid generated from a handful of single QPF points. When a forecaster assigns a QPF value for a single point, Mountain Mapper compares the value of this data point with an underlying gridded field of monthly precipitation, i.e., a climate dataset known as PRISM. The resulting ratio of QPF point estimate vs. PRISM monthly climate normal is distributed to surrounding grid points (HRAP grid). The HRAP grid used in the Mountain Mapper has a 4km x 4km grid point spacing or roughly 2.2 nm x 2.2 nm. This matches exactly with the grid density of the PRISM data set. A sample relationship of QPF to the PRISM monthly normal precipitation data is shown in the figure below. It shows the two grid sets: QPF data points, and the underlying PRISM monthly precipitation normals.
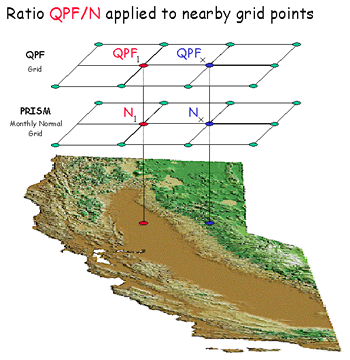
Let's now compare two neighboring points on a grid: a known QPF1 entered by the forecaster, and an unknown neighboring point QPFx . There are corresponding monthly normal values N1 and Nx for each QPF point in the underlying PRISM grid of monthly precipitation normals.
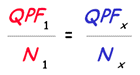
If we assume the ratio of QPF1 to N1 is constant in the surrounding QPF points in proximity, we can state the relationship between QPF points simply as,
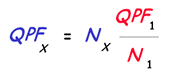
Then, solving for QPFx,
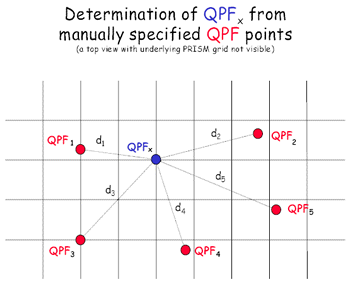
However, in reality, the ratio of QPF to the underlying PRISM precipitation normal is not a constant due to the non-uniform temporal and spatial characteristics of any given precipitation event. To improve our estimate of precipitation at point QPFx, we apply a commonly used 1/distance2 weighting factor from nearby QPF/N ratios to estimate every grid point within the CNRFC boundary. Finally, let's look at an example of how these weighting factors influence our estimate of QPF for a grid point (QPFx) for an area with several manual entry QPF points. This time, our vantage point is above the gridded fields looking down. The underlying PRISM monthly normal precipitation grid (not visible) contains the appropriate normal precipitation values (N) for each overlying QPF point.
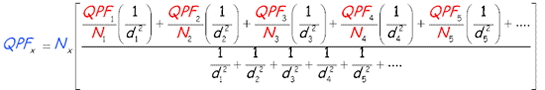
Let's solve for QPFx,
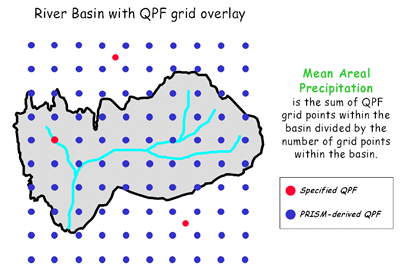
This form of the equation makes it easy to see that QPFx is a function of the underlying PRISM monthly precipitation normal Nx multiplied by the ratio QPFi/Ni weighted to the nearest n QPF data points (in our example, n=5). This calculation of QPFx is performed at every grid point in the CNRFC gridded domain. A mean areal precipitation (MAP) value is determined by overlaying the gridded QPF field with another grid containing the basin boundaries. A single MAP for each basin is the average QPF calculated using only those points that fall within the basin boundaries.
|
|
National Weather Service California Nevada River Forecast Center 3310 El Camino Avenue, Room 227 Sacramento, CA 95821-6373 Phone: (916)-979-3056 Fax: (916)-979-3067 Page last modified: January 23, 2004 |