|
 |
||
 |
| HOME |
|
HAS QPF Process Mountain
Mapper
|
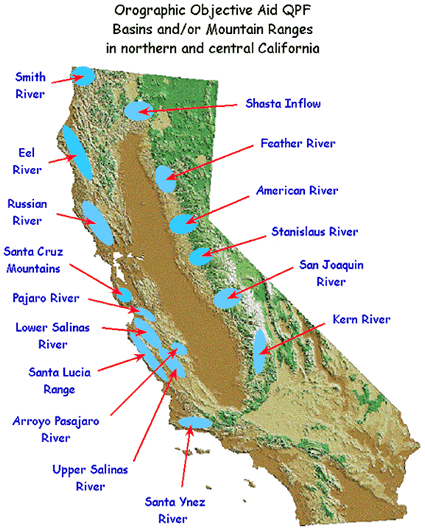
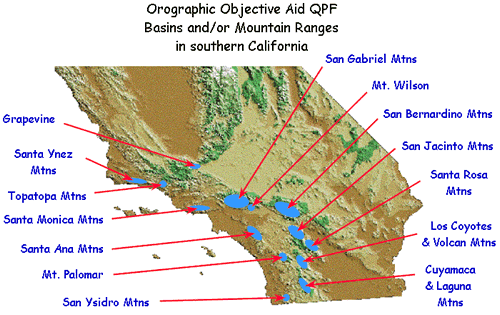
Rhea Orographic Aid - Operational Use The Rhea Orographic Aid has been adapted to run on AWIPS for nearly all of the major river basins and several mountain ranges in California as shown in Figures 1 and 2 below:
Figure 1 - Orographic Aid Basins in northern and central California
Figure 2 - Orographic Aid Basins in southern California The Orographic Aid is currently run using gridded sounding data extracted from the 00 and 12 UTC AWIPS netCDF files for the following models:
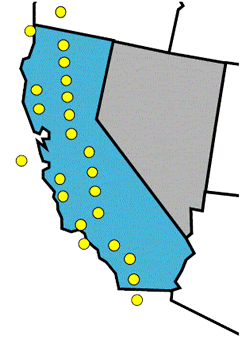
The gridded data points closest to each basin are used and/or interpolated for use as input to the Rhea orographic aid. The actual NCEP model grid points are shown in figure 3.
Figure 3. NCEP model grid points used by Orographic Aid Shortly after receipt of the NCEP gridded data files, the model is run and the output appears as a text file containing basin QPF estimates in 6 hour time steps for all the basins shown in figures 1 and 2 above. The output is then converted to point QPF values so that the data can be used in Mountain Mapper to generate an entire QPF grid covering the CNRFC area of responsibility. Caution should be used when using the data outside of California, since the orographic aid does not include any basins in Nevada. Since Mountain Mapper software expects point data as input, the basin data output from the orographic aid is converted to point values by assigning it to a point inside the basin whose annual normal precipitation matches the normal annual precipitation for the entire basin. The Rhea Orographic Aid also utilizes the gridded NCEP data to determine Rain-Snow Elevation (RSEL) information. RSEL (also referred to as snow level) is defined as the level where rain changes to snow. It is important in the NWSRFS hydrologic models because it determines that portion of precipitation which immediately runs off, and that portion which falls as snow and accumulates as snowpack. For computation purposes, the software searches vertically downward through the pressure levels and finds the highest occurrence of 0 Degrees Centigrade. Similar to the HPC freezing level guidance, snow levels are calculated by subtracting 1500 feet from the freezing level. This data is also run through Mountain Mapper software to generate a freezing level grid over the CNRFC domain. The distribution of point data to a grid is done with inverse-distance-squared weighting. The orographic guidance from the GFS model is available on AWIPS as text product RNOHD9RSA twice daily at 9:30 am PST (based on 12UTC model run) and again at 9:30 pm PST (based on 00 UTC model run). Currently, 6-hour QPF for days 4 and 5 of the NWSRFS model run uses orographic aid output based on the 00UTC GFS-extended model run. The table below shows how the Rhea orographic aid performed during a major flood event in late December 1996 in northern California. This was a prolonged storm event with a deep moisture connection to the tropics, strong prevailing SW winds at 700 millibars, and high snow levels...ideal conditions for which the orographic model was developed. The table rows show 5-day QPF daily totals (12UTC-12UTC) from successive runs of the orographic aid using input from the 00UTC MRF model vs. observed rainfall for the same 5 days for the Feather River basin (an average of several gages in the basin -shown in the right column of the table). Also included at the bottom of the table is the 12-36 hour QPF output from the daily 00UTC Eta model orographic run. The 5-day orographic aid QPF totals are generally within 2.0 inches of the observed totals for the MRF-based runs and within 0.3 inches during the wettest 5-day period of the event. The Eta model shows similar results although it tended to overpredict during the drier days and underpredict on the wetter days...but astonishly almost matched exactly with the precipitation total for the entire 9-day event of 26.8* inches.
*orographic aid QPF data unavailable for the Dec 27 00UTC Eta run |
|||||||||||||||||||||||||||||||||||||||||||||||||||||||||||||||||||||||||||||||||||||||||||||||||||||||||||||||||||||||||||||||||||||||||||||||||||||||||||||||||||||||||||||||||||||||||||||||||||||||||||||||||
|
National Weather Service California Nevada River Forecast Center 3310 El Camino Avenue, Room 227 Sacramento, CA 95821-6373 Phone: (916)-979-3056 Fax: (916)-979-3067 Page last modified: July 31, 2006 |
||||||||||||||||||||||||||||||||||||||||||||||||||||||||||||||||||||||||||||||||||||||||||||||||||||||||||||||||||||||||||||||||||||||||||||||||||||||||||||||||||||||||||||||||||||||||||||||||||||||||||||||||||