|
 |
||
 |
| HOME |
|
HAS QPF Process Mountain
Mapper
|
Rhea Orographic Aid As mentioned in the section describing the original model, the Rhea orographic aid is an adaptation of the original Rhea orographic model. The aid was developed because at the time of the original model development, computer access and processing speed were prohibitive to running the model routinely. The core concept of the orographic aid is to take the QPF output from the original model for a particular basin, and apply a correction factor based on a comparison of today's upper air sounding (just upstream of the basin) with the warm moist sounding used in the original model run. Let's begin with the original orographic model run. For each particular basin, the original orographic model was run several times, changing only the 700 mb wind direction in 10 degree increments. A single basin precipitation value was determined for each 10 degree shift in 700 mb wind direction and stored in a table (see Table 1). Vertical sounding conditions used in the model were selected to match those which actually produce heavy orographic rains in California. These conditions included 50 knot winds at 700 mb, a deep saturated moisture layer from 1000 mb to 450 mb, and high freezing levels (0 deg C isotherm intersecting the 700 mb level). In further discussions, this sounding will be referred to as the "reference sounding" and the table will be referred to as the "reference table".
Table 1. Reference Table - Basin Precipitation for the western Feather River Basin above Oroville vs. 700 mb Wind Direction (based on a "saturated sounding, 50 knot 700 mb wind speed, and 0 Deg C isotherm at 10,000 feet MSL)
So for example, using "reference sounding" conditions and a wind direction of 240 degrees or from the WSW, the original orographic model output a prediction of 3.2 inches of rain over the Feather River in 12 hours. But what if we want to make a prediction using today's gridded sounding data which is different from the reference sounding? This led to the idea of applying modifiers to the original model output, based on a comparison of current sounding data to the reference sounding that was used to calculate the reference table. Figure 1 illustrates the conceptual model used to make the comparison of today's atmospheric sounding data vs. the reference sounding.
Figure 1. Conceptual model to estimate condensate supply rate As wind forces air parcels to lift vertically along the slope of an inclined plane aligned with the directional component of the wind at 700 mb, the air within the parcel cools and condenses to form condensate upon reaching saturation. The time it takes for the parcel to ascend the inclined plane is a function of wind speed (the velocity component of the layer wind in the direction of the 700 mb wind). The dimensions of the inclined plane are arbitrary, but were chosen to resemble the actual slope of the northern Sierra Nevada. Consequently, one can determine a condensate supply rate (CSR) by dividing the amount of condensate produced within the parcel and dividing by the time it takes for the parcel to ascend the inclined plane. These values can then be computed layer by layer, using gridded data from the NCEP gridded data fields in 50 mb increments. A single condensate supply rate (CSR) can be determined for the entire gridded data sounding by summing the condensate supply rate over all layers. Similarly, one can perform the same procedure to obtain a condensate supply rate using the reference sounding. We can now use the ratio of condensate supply rates from today's gridded data sounding and the reference sounding to modify the QPF from the reference table as shown by the equation:
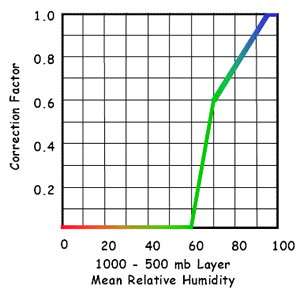
The QPFref is taken directly from the reference table and based solely on the 700 millibar wind direction for the valid prediction period. Additional modifications have been added to improve the model predictions. These include a humidity correction, which is a multiplicative factor applied directly to QPFgridded. A mean relative humidity is calculated for the 1000-500 mb layer from the NCEP gridded model data and is used to determine the humidity correction factor. As shown in Figure 2 below, humidities below 60% force the QPFgridded to zero.
A second correction is made for light wind speeds in the lower levels. This second modification decreases the "lift" for conditions of very light wind components oriented along the direction of the 700mb flow. The correction is applied during the calculation of condensate supply rate for the gridded data sounding. It assumes that layers whose component wind speed (along the direction of the 700mb flow) is less than 2.5m/s, or 5kts, do not "go over the mountain." It is applied to the lower 1 to 4 pressure levels (1000mb to 850mb), starting from the bottom and working up until the lowest layer with greater than 2.5 m/s is found. This has two impacts, both negative, on the computed vertically integrated CSR. First, these "dead" layers that don't go over the mountain receive no lift. Second, the top of the highest "dead" layer becomes the effective height of the base of the inclined plane, thus decreasing the total amount of lift (and condensation) up the inclined plane for all higher layers that do "go over the mountain". |
||||||||||||||||||||||||||||||||||||||||||||||||||||||||||||||||||||||||||||
|
National Weather Service California Nevada River Forecast Center 3310 El Camino Avenue, Room 227 Sacramento, CA 95821-6373 Phone: (916)-979-3056 Fax: (916)-979-3067 Page last modified: July 31, 2006 |
|||||||||||||||||||||||||||||||||||||||||||||||||||||||||||||||||||||||||||||