|
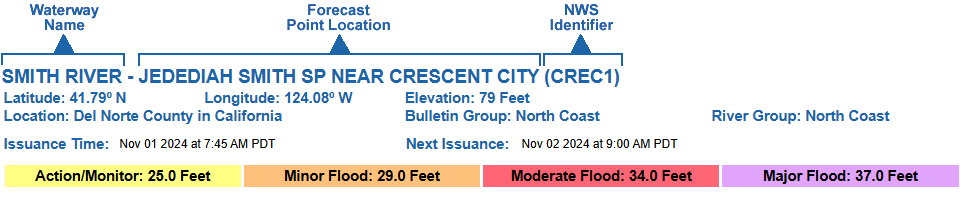
Graphical River Forecast - How to Use This Product The graphical river forecast product is issued each morning and is updated as needed during significant runoff events. It is not intended to serve as a substitute for official flood watches, warnings, advisories, or statements issued by NWS Forecast Offices. The information presented represents the output of the CHPS modeling system as adjusted by on-duty operational hydrologists. The forecast is specific for the river and location identified in bold letters across the top of the graphic.The forecast issuance time and the expected time of the next forecast is located directly underneath the header. The Action/Monitor stage, Minor Flood stage, Moderate Flood stage, and Major Flood stage for the specified forecast point location are provided below the previous mentioned information.
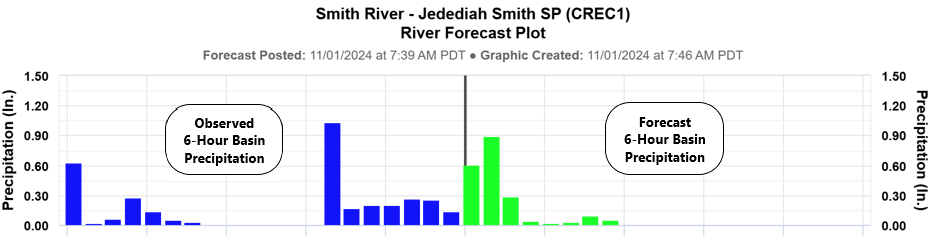
The top graphic plot depicts 10 days of basin average precipitation in inches. Unless labeled otherwise, the values on this graph are reflective of the average over the river basin at this location on the river. The first 5 days are observed and the latter 5 are forecast.
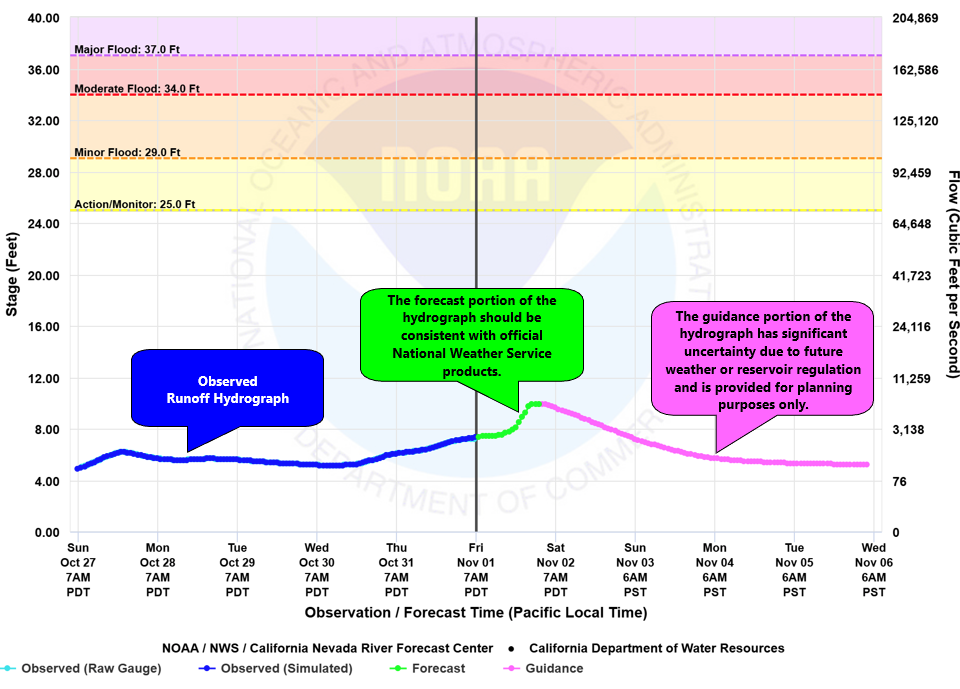
This precipitation input is then processed through a soil moisture model which accounts for surface and subsurface features and dryness. When the soil profile is dry, observed or forecast precipitation may not appear as runoff. Once the soil profile becomes wet, rain+melt input will result in runoff. The amount and timing of that runoff is a function of the individual watershed characteristics. Changes in runoff are shown in the bottom half of the graphic. The lower graphic shows a total of 10 days of streamflow comprised of observed (blue), forecast (green) and guidance (magenta) periods. The axis on the left is stage in feet and the axis on the right is discharge in cubic feet per second (cfs). The observed period covers the past 5 days. Observed data are preliminary and subject to change at a later date. The future period also covers 5 days and is comprised of a forecast and guidance period. The duration of the forecast period varies from location to location and may vary from one flood event to the next. More predictable locations (and events) will have longer forecast periods, less predictable locations (and events) have shorter forecast periods. The information in the forecast period should be consistent with official products issued by NWS Forecast Offices. The guidance period begins at the end of the forecast period and extends through 5 days. Guidance values may contain significant uncertainty due to future weather and/or reservoir regulation. Actual conditions may be significantly above or below those described in the guidance portion of the hydrograph. This information is provided for planning purposes only and should influence decisions such as how often to monitor future forecasts.
|