
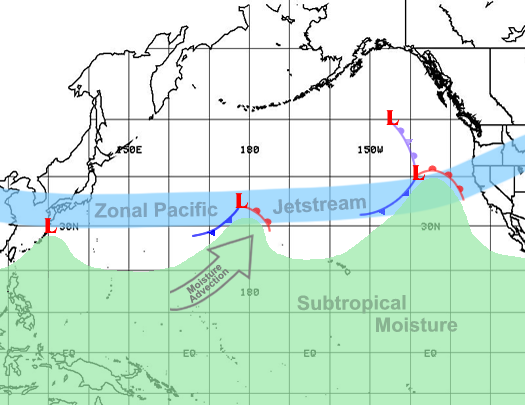
Heavy Precipitation Event Navigation: General Summary | Precipitation | Weather Synopsis | Hydrologic Impacts A very brief but productive storm period in early December and a much more prolonged wet and stormy period spanning Dec 17th through the 2nd of January 2006 brought copious rainfall to northern California, southwest Oregon, and western Nevada. Initially, the generally dry antecedent soil moisture conditions and the spacing between storms of mid to late December allowed rivers to rise and fall with only minor consequences. However, river flows ratcheted higher with each passing storm to the point where a larger storm occurring on the 28th of December and an even wetter New Year's Eve storm would drive several rivers to rise well above flood stages with high inflows into northern Sierra Nevada reservoirs. Advanced releases in anticipation of the heavy rains and weir flows into the bypass system allowed the major controlled river systems like the Sacramento, Feather, and American watersheds to weather the storm without major incidents. However, the smaller and quicker responding rivers such as the Russian and Napa Rivers were exposed to the direct impact of these storms and resulted in major flooding. Several rivers along California's north coast including the Klamath River and the Eel River rose several feet above flood stage and rivaled flows dating back to the December 1996 - January 1997 flood event. In addition, more localized flood damage occurred as many of the area's smaller creeks and streams overflowed into neighborhoods and streets, including the San Francisco Bay Area and greater Sacramento area. The heavy rains also posed a major problem for area transportation with several road closures due to rock and mud slides. A mudslide on the 30th temporarily closed Interstate 5 north of the Oregon border and a large rock slide closed Interstate 80 near Floriston east of Truckee for about a day and a half. Westbound lanes of Interstate 80 in Fairfield, CA sat under four feet of water forcing the CHP to shut down the major thoroughfare between Sacramento and San Francisco on the 31st. Heavy rains also extended across the crest of the Sierra Nevada and the New Year's Eve storm caused the Truckee River to flood through Reno and Sparks. The storm also caused major power outages throughout the area and the annual downtown New Year's Eve fireworks display was postponed as a result of the storm. Several other rivers and streams flooded along the eastern slopes from a combination of excessive precipitation and high snow levels. The Sacramento Delta region was also an area of high concern during this event as high astronomical tides coupled with increased flows through the Sacramento River system heightened fears of levee problems. As if that were not enough, wave action from strong winds associated with the late December and early January storms brought additional stress to the Delta levees and the crews protecting them. Winds on New Year's Day gusted to 63 mph at Sacramento's International Airport and 52 mph in Stockton. [ Click here for an interactive map of precipitation from this event ] A series of storms from Christmas Day through New Year's Day brought heavy to excessive amounts of precipitation across southwest Oregon, northern California, and western Nevada resulting in widespread flooding. The most potent storm system moved into the region on Dec 30, 2005 before exiting the area on New Year's Eve. This system rode in on an impressive zonal Pacific jet stream between 30N and 40N. Copious amounts of subtropical moisture were entrained into this system with a source traced back to the Philippines and Indonesia. Under a strong warm air advection pattern, snow levels rose above many mountain tops, allowing for precipitation to fall mainly as rain. With the region under a tropical airmass, warm rain processes dominated, allowing for high precipitation efficiencies. This exacerbated the potential for flooding given the high amounts of runoff expected, especially over the crest of the Sierra and along the east slopes. Also, strong mid-level winds provided enhanced orographic precipitation on southwest facing slopes. Wind magnitudes at 700 mb approached 80 knots, stronger than any storms of the recent past. One final key ingredient was the slow movement of the system through the region. With the jet stream positioned parallel to the cold front, southward progression of the front was limited. In addition, late on Dec 30, 2005 an upper level disturbance developed along the cold front, allowing the system to stall over the San Francisco North Bay counties inland to the northern Sierra including the Lake Tahoe and Reno areas. This resulted in some of the greatest 24 hour amounts to be observed in these areas during the storm's progression through the region. Each of these previously mentioned factors contributed to the heavy to excessive amounts of precipitation experienced across the region. Included in the table below are the daily precipitation maps for the Dec 24, 2005 - Jan 2, 2006 storm period as well as the week of wet weather starting on the 17th of December that led into this event. Also included are gridded graphical precipitation maps derived from the gage data.
Although the North Coast did not record the greatest amounts of precipitation from the storm system on Dec 30 - 31, 2005, precipitation amounts during the entire period from late December to early January were quite impressive. During the 48 hour period ending at 00 UTC on New Year's Day, amounts generally ranged from 3 to 6 inches. For the 10 day period ending Jan 03, 2006 at 00 UTC, amounts generally ranged from 6 to 12 inches.
With the exception of a brief but very wet storm period at the end of November into early December, the weather pattern along the west coast was dominated by a strong ridge of high pressure and extended periods of dry and unseasonably mild weather. The Pacific-North American Pattern (PNA) index (Figure 1) became strongly positive, indicative of the strong ridging over the eastern Pacific and west coast. While the NCEP's GFS model periodically tried to weaken the upper ridge in the extended periods, the European Centre's Medium Range Forecast model (ECWMF) held steadfast to the ridge and was generally the preferred model in most long range discussions through mid-December. However, by Thursday December 15th, the GFS was the first model to signal an impending transition to an increasingly wet pattern for the west coast in the week ahead. Starting on the 17th of December, the ridge gave way to the first of what would become an extended period of wet weather for southwest Oregon, northern California, and western Nevada. As has been seen in past history, the breakdown or undercutting process of a west coast upper ridge can lead to extended periods of excessive rainfall in California whenever subtropical moisture becomes entrained in the flow. By the 23rd of December, it became increasingly evident that the region was on the threshold of a very wet period that would have serious hydrologic implications. With the holiday season fast approaching, southwest Oregon, northern California, and western Nevada NWS offices in coordination with the CNRFC issued hydrologic outlook products that afternoon to heighten public awareness to the threatening week of wet weather ahead. The first of the storms to break through the ridge brought heavy precipitation to mainly central California. Later storms would exhibit a northward shift and mainly impact southwest Oregon, northern California, and western Nevada from a Monterey Bay to Yosemite line northward. A common thread throughout most of these storms was the presence of an unusually rich subtropical moisture plume which originated near the Philippines area of the western Pacific (Figure 2). It was not uncommon to see precipitable water values within the plume in excess of 1.5 inches over the eastern Pacific with percent of normal anomalies in excess of 250 percent over California and western Nevada. This conveyor belt of moist subtropical air became entrained along a strong and persistent jet stream that stretched from east Asia to the mid Pacific. This strong jet eventually worked its way to the west coast by late December (see Figure 3 below). Winds were typically 180 kts or higher along the upper jet stretching across the Pacific and at one point satellite estimates of 240 knots (275 mph) were noted in the mid-Pacific.
Another common element to most of the storms of this event was long durations of strong warm air advection and isentropic lift while the colder air remained closer to the distant deep surface lows off the Pacific Northwest coast and Gulf of Alaska. This resulted in generally high snow levels (view melt level profiler data from Chico and Sloughhouse). Deep warm rain processes were very efficient in generating roughly 2-4 inches of mostly rain in the mid and upper elevations of the coastal and Sierra Nevada mountains with each passing storm system, and 4-8 inches were common with the larger Dec 30 - 31 storm. Not until the end of the storm series did the snow levels lower. However, when they did, the mountains added enough fresh snowpack to bring seasonal values close to 100% of normal in the northern Sierra Nevada and just under 150% of normal in the southern Sierra Nevada. Strong winds from the south to southwest in the low- and mid-levels were another ingredient that accompanied each of the storms (especially Dec 30 - 31, 2005) as they progressed across the region. This flow allowed for favorable orographic lift and enhanced precipitation totals over the northern California coastal mountains, Shasta drainage, and northern Sierra (view boundary layer wind profiler data from Chico, Bodega Bay, and Sloughhouse). Along the coastal mountains, SW winds at 1 km are a good indicator for ideal orographic enhancement. Southerly surface winds through the Sacramento Valley aid in convergence over Redding and the Shasta Lake area. Finally, along the northern Sierra, SW winds at 3 km (700 mb) are important for increased upslope precipitation. Two things absent in these storms and usually attributed to prolonged wet warm "pineapple express" type storm patterns for the west coast were the Madden-Julian Oscillation (MJO) and blocking high pressure in the Gulf of Alaska. While neither were a player, the persistent and strong jetstream pattern across the Pacific and the influx of tropical moisture bore some resemblance to such a pattern. Normally in the case of an MJO, a strong subtropical jet develops from enhanced convection that drifts slowly eastward across the tropics from Indonesia toward the mid-Pacific. This subtropical jet then funnels moisture toward the western U.S. and is further enhanced by the cold air circulation around a blocking high in the Gulf of Alaska. In the case of the late December 2005 storms, there was primarily a single strong polar jet emanating from the Asian continent that drew moisture from beyond the Philippines into the flow.
The following table links to NOAA-NWS NEXRAD (WSR-88D) imagery during the period of heaviest precipitation across the region. The loop starts on Dec 30, 2005 at 1200 UTC and concludes on Dec 31, 2005 at 2100 UTC in 12 minute increments. Radars in the mosaic include; KMAX (Medford), KBHX (Eureka), KBBX (Beale AFB), KRGX (Reno), KDAX (Sacramento), KMUX (Monterey), and KHNX (Hanford). The radars display the slow progression of the frontal band through the area. Also, note the numerous lines of convection with the frontal band and the circulation off the northern California coast toward the end of the loop.
As mentioned in the general summary, the worst flooding occurred in the coastal basins between Cape Mendocino and the San Francisco Bay Area during the Dec 30 - 31, 2005 storm period. Most rivers were already running high from prior storms, especially from one of the wetter storms just a few days earlier (Dec 28 - 29, 2005). The focus of flood damage concentrated on the Napa and Russian River basins, but many smaller coastal and urban drainages experienced property damage more limited in areal scope. Also mentioned earlier, there were several rock and mud slides that resulted in the closure of two interstates into northern California as well as several other roads and highways throughout the area. Precipitation making its way over the Sierra crest along with high snow levels brought numerous hydrologic consequences to east slope basins. The Truckee River surpassed its designated flood stage in Reno and at Vista. Flood waters spilled into downtown Reno streets and inundated several businesses in the Sparks industrial area. The Carson River also experienced flooding along its entire stretch with recent burn areas just to the west of Carson City adding to the mess as muddy water ran down the hillsides. Although widespread catastrophic damage was not reported along the Sacramento River system, high flows were recorded at numerous locations as the result of reservoir releases and runoff contributions from numerous tributaries. High astronomical tides, high flows, and very strong winds wreacked havoc on the Delta region as well. Highlights from each of the regions hardest hit by the heavy precipitation event are discussed in more detail below. North Coast Numerous rivers across the North Coast region recorded river levels above flood stage during the peak of the heavy precipitation event, resulting in moderate to severe flooding of both rural and urban areas. Along the Klamath River, the major thoroughfare (US Highway 101) was closed temporarily during the rise from the Dec 28 - 29, 2005 event, while more significant flooding from the Dec 30 - 31, 2005 event resulted in a complete shutdown of the highway. Seventeen structures were damaged due to the high waters while 70 mobile homes were moved prior to the event as a result of the forecasted river levels. Along the Eel River, State Highway 211 from Fernbridge to Ferndale was closed along with several secondary roads. Major flooding of the Eel River Delta occurred, including several acres of pasture land. However, damages were minimal with no loss of cattle reported due to good lead time of the event. Other locations along the North Coast also experienced flooding of secondary roads and low-lying areas as a result of the heavy precipitation. Also, along coastal sections (especially in the river deltas), astronomical high tides of more than 7 Feet and ocean swells that reached from 18 to 20 Feet exacerbated flood problems. Russian and Napa In southern Mendocino and Sonoma counties, the Russian River rose above its flood stage at all three forecast locations (Hopland, Healdsburg, and Guerneville), resulting in flood damage along the entire stretch of the river. Hardest hit was the largest town in the region, Guerneville, where the river crested just about 10 feet above flood stage (41.8 Feet with a Flood Stage of 32.0 Feet). State Highway 116 and River Road experienced flood waters and landslides, which restricted access to the area. Numerous low-lying homes and businesses, along with cars and trucks were inundated by the river spilling over its banks. Also, just upstream in the town of Rio Nido, low-lying areas of the community sat under at least 3 feet of water. To the north near Hopland, major flooding was reported with the closure of State Highway 175. Many residents and businesses in the area also sustained flood damage. Along the Navarro River in southern Mendocino county, major flooding was reported with a complete shutdown of State Highway 128. Four to five homes along the river sustained flood damage. The river peaked almost 17 Feet above its flood stage of 23.0 Feet at Navarro on New Year's Eve. As a result, evacuations were ordered. Just to the east in the Napa River Valley, water spilled out of the river's banks at several locations along its entire stretch. Mudslides and rising water caused State Highway 29 (the main north-south route through the valley) and the Silverado Trail to be shut down, closing off access to Yountville and towns to the north. Water pooled in nearby vineyards, but little damage was reported given the fact grapevines are mostly dormant during the winter months. In the city of Napa, water rushed into downtown homes and businesses. The excessive amounts of rainfall in such a short period of time resulted in manhole covers to pop all around the city. The Lake Park neighborhood, an area prone to flood waters given its location near two bends in the river, sat under at least 3 feet of water. Napa officials stated at least 600 homes and 150 businesses suffered flood damage. Sacramento System and Delta Region The Sacramento River system performed as designed throughout the duration of the event with reservoir releases and local runoff maintaining high but manageable river flows with considerable weir overflow into the bypass system. Flooding across the entire stretch of the river was limited to low-lying flood prone areas, including several recreational parks, trailer parks, and agricultural land. Several tributaries flowing into the Sacramento River rose dramatically, resulting in flooding along their banks and a large contribution of water into the river. Also, Cache Creek reached flood stage at both Rumsey and Yolo. In the Sacramento area, Discovery Park (at the confluence of the Sacramento and American Rivers) began flooding around Christmas Day as initial releases from Folsom Lake and runoff from early storm systems pushed the stage at the I Street Bridge to 19.0 Feet. The park remained underwater 30 days after water began flooding the recreational area. Also, to alleviate high flows from the Sacramento and American Rivers, 20 of the 48 gates on the Sacramento Weir were opened starting at 8:46 AM on Saturday, December 31, 2005. The process to open the 20 gates took just about one hour to accomplish. To state the magnitude of the high flows on the river during this period, in the past 20 years of operation the Sacramento Weir had only been opened five other times (Feb 1998, Jan 1997, Mar 1995, Jan 1995, and Feb 1986). The weir remained open for more than a week, until the gates started to be closed on Monday, January 09, 2006 at 8:00 AM due to operational procedures. The process to shut the gates is quite an extensive one with the last of the 20 gates closed Tuesday, January 10, 2006 at 12:08 PM (a total working time of just about 12 hours). The Sacramento - San Joaquin Delta region also suffered numerous incidents during the event with most being reported around the turn of the year. Coinciding astronomical high tides (2nd highest astronomical high tide of the year), increased flows down the Sacramento system, and extremely strong winds resulted in higher than normal tidal fluctuations and wave action on area waterways. Several reports of levee overtopping, erosion, and seepage kept incident teams extremely busy in dangerous conditions. California DWR captured dramatic video from January 1, 2006 showing the strong winds and wave action threatening the levees on Twitchell Island (Large file sizes - broadband internet connection recommended).
An actual levee breach was reported on Fay Island (approximately 100 acres primarily used for agriculture). Also, in the Suisun Marsh, levee breeches were reported at Simpson-Wheeler and Van Sickle Islands. The following table contains links to graphs of the observed stages at four Delta locations.
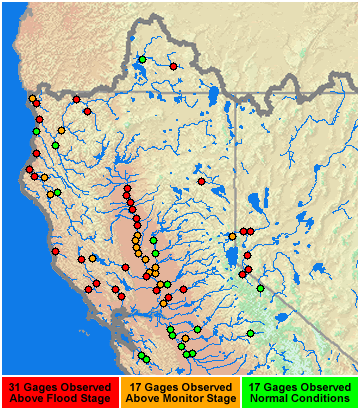
A high resolution side-by-side satellite image (captured by the Moderate Resolution Imaging Spectroradiometer (MODIS) on NASA’s Aqua satellite) compares the lower Sacramento River region on December 10, 2005 (before the flooding) with an image taken on January 4, 2006. Larger versions of the images (4MB each) can be found on the NASA Earth Observatory website (Dec 10, 2005 image and Jan 4, 2006 image). East Side Sierra Snow levels jumped up to near 8,500 Feet across the Lake Tahoe Basin and Reno area during the peak of the storm. The tropical airmass brought excessive precipitation in the form of rain across the crest, resulting in a large amount of runoff into east slope Sierra creeks and rivers. Along the Truckee River, water flowed over its banks and into downtown Reno streets adjacent to the river. Several businesses, including the Washoe County courthouse annex, were swamped with flood waters. The river also rose onto sidewalks and over front yards of nearby homes. Officials closed all downtown Reno bridges over the Truckee River to traffic as backhoes removed debris from the river to keep the water flowing. Just downstream in the city of Sparks, industrial area businesses (approximately 900) suffered from flood damage. On a positive note, sandbagging efforts at the Reno-Tahoe International Airport were successful in keeping the transportation hub fully operational during the event. This was not the case back in 1997, when water flowed onto airport grounds resulting in a halt of air travel in and out of Reno. Farther south, the Carson River saw flooding on both the east and west forks, as well as farther downstream near Carson City. Muddy waters running off from recent burn areas just west of Carson City added to the mess, resulting in flooding of numerous streets. The following map (Figure 4) represents the locations across southwest Oregon, northern California, and western Nevada where the California-Nevada River Forecast Center (CNRFC) issues flood forecasts. The colors represent the highest observed stage and flow at each of these locations during the period from Dec 24, 2005 through Jan 07, 2006 (Green - Normal Conditions, Orange - Above Monitor Stage, and Red - Above Flood Stage). To view the observed hydrograph for any of these gages, click on the dot displayed on the map.
Reservoir operations at the three major reservoirs across northern California kept river flows manageable during the entire event. Shasta Lake inflows peaked just over 100,000 cfs with both systems at the end of the year. With ample storage available, operators were able to reduce releases to 8,000 cfs during the peak flows on the Sacramento River to limit the amount of downstream flooding. At Lake Oroville, inflows jumped above 165,000 cfs at their peak on New Year's Eve. This resulted in operators ramping up releases to 80,000 cfs at their maximum. Farther south on the American River, Folsom Lake recorded a peak inflow of just over 175,000 cfs on New Year's Eve as well. Reservoir releases from Folsom Lake were ramped up to 35,000 cfs well in advance of the impending storm systems, allowing for plenty of capacity behind the dam. Although these inflow amounts appear rather impressive, they do not come close to the values observed during the January 1997 flood event. Below is a table comparing the peak inflows from this event and January 1997.
| ||||||||||||||||||||||||||||||||||||||||||||||||||||||||||||||||||||||||||||||||||||||||||||||||||||||||||||||||||||||||||||||||||||||||||||||||||||||||||||||||||||||||||||||||||||||||||||||||||||||||||||||||||||||||||||||||||||||||||||||||||||||||||||||||||||||||||||||||||||||||||||||||||||||||||||||||||||||||||||||||||||||||||||||||||||||||||||||||||||||||||||||||||||||||||||||||||||||||||||||||||||||||||||||||||||