
Heavy Precipitation Event Navigation: General Summary | Precipitation | Weather Synopsis | Hydrologic Impacts Just a mere five weeks since the drenching rains of late December and early January, a waterlogged southern California found itself in another seven day stretch of what must have seemed like relentless rains. The resulting impacts were more landslides and flooding. According to newspaper accounts, the aftermath of the storm left nine people dead, including at least two deaths from mud and rock slides and a civil engineer who was swept by rushing water into a large sinkhole. Property damages soared well into the millions, including the dramatic collapse of the runway at the Santa Paula Airport into the rain-swollen Santa Clara River. Colder than the January storms, snowfall measured an impressive 8 to 10 feet in the mountains above Los Angeles. [ Click here for an interactive map of precipitation from this event ] Once again, much of southern California experienced a prolonged period of precipitation with the area from near Point Conception west of Santa Barbara to the San Gabriel and San Bernardino Mountains north and east of Los Angeles hardest hit. Storm totals generally ranged from 4 to 8 inches across coastal locations, while adjacent mountains received 8 to 18 inches. However, localized amounts exceeded the 20 inch mark, including Opids Camp just north of Los Angeles in the San Gabriel Mountains. These precipitation totals, in addition to the two impressive earlier storm systems affecting the region around New Year’s Day and the second week of January, have placed many locations well above seasonal normals. Since the water year began on October 1st, percents of normal across southern California generally ranged from 200 to 400 percent. The table below shows some unofficial precipitation totals from the three significant storm periods for some key precipitatation gages in southern California.
With several significant precipitation events occurring across southern California this year, both Downtown Los Angeles (USC Campus) and San Diego (Lindbergh Field) were rivaling their wettest years ever since records were first recorded. Through March 1st, both locations reached their third wettest year (seasonal totals begin on July 1st). The information below shows the top three precipitation years, including the current one. Downtown Los Angeles (USC Campus) – Records began in 1877
* This makes the current precipitation year the wettest on record for the past 115 years. San Diego (Lindbergh Field) – Records began in 1850
* This makes the current precipitation year the wettest on record for the past 64 years. Another interesting fact to note is the precipitation deficits across the Pacific Northwest compared with the surpluses across southern California this year. Seasonal totals through March 1st at Downtown Los Angeles and San Diego were outpacing Seattle and Portland. The table below shows precipitation totals from July 1st to March 1st, departure from normal, and normal precipitation for these four locations.
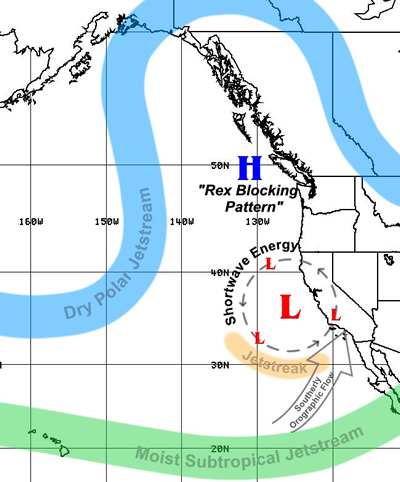
A stubborn pattern, situated across the eastern Pacific and west coast of North America for more than a week, brought periods of precipitation to southern California from Feb 17-23, 2005. This pattern, known as a “Rex Block”, occurs when an upper high pressure system sets up at a higher latitude while an upper low pressure system sets up at a lower latitude along a similar longitudal line. In this case, the upper high pressure system parked itself off the British Columbia coast, which in turn pushed the dry polar jetstream well into Alaska and northern Canada. The initial upper low pressure system anchored near 130W and just off the central California coast. The moist subtropical jetstream (which played a key role in the Jan 7-11, 2005 southern California heavy precipitation event) did not play much of a factor in this event. It remained for the most part along 20N before steering northeast into the south-central United States and northern Mexico. As a result, moisture content during these series of precipitation events generally peaked near 1.00 inch precipitable water. Rounds of precipitation affected southern California from Santa Barbara to San Diego counties on Friday February 18th and again on Saturday February 19th. This precipitation was enhanced by shortwave energy rotating around the initial upper low pressure system, upper jetstreaks sliding around the base of the low nosing into southern California, and increasing low-level flow from the south to southwest slamming into the adjacent coastal mountain ranges. (See Figure 1 below)
Figure 1. General weather pattern affecting Southern California Feb 17-23, 2005 This initial upper low pressure system began to weaken on Saturday morning, February 19th and moved slowly off to the northeast. However, strong shortwave energy from the central Pacific and a cold origin upper low pressure system diving south-southwest out of western Canada reinforced the blocking pattern on Sunday afternoon, February 20th. This developed a second and stronger upper low pressure system inside 130W and just off the central California coast. With this second upper low pressure system in place Sunday night, February 20th, the strongest shortwave energy for the entire event took aim at southern California. Although moisture content (precipitable water values near 1.00 inch) and southerly flow ahead of the shortwave energy were similar when compared to the previous few days, the impressive dynamics increased precipitation rates (and precipitation totals) across the entire region, reaching near 1.00 inch per hour. Infrared satellite imagery loops on Sunday February 20th clearly show the dynamics associated with this system as it developed into a classic comma-shaped pattern and cloud tops cooling rapidly to as low as -55 C. A loop of mosaicked Nexrad WSR-88D radar 0.5 degree reflectivity imagery (PLEASE NOTE: this loop contains 100 images and requires large bandwith) displays the precipitation echoes associated with this frontal cloud band and the continuous regeneration of precipitation streaming northward into the tranverse mountain ranges in the wake of the cold front. After this strong shortwave exited the region to the north and east, the upper low pressure system very slowly began to move off to the east-southeast. However, additional periods of precipitation continued through the Presidents’ Day holiday (Monday, February 21st) into the middle of the week as additional shortwave energy rotated through southern California. The potential for convective precipitation remained a concern throughout the duration of the event. The close proximity to the upper low pressure system, favorable dynamics, and afternoon heating from breaks in the cloud cover produced scattered thunderstorms every afternoon; even a few waterspouts and weak tornadoes that affected coastal areas from Santa Barbara to San Diego counties. Sounding data from Vandenberg and San Diego show the destabilized atmosphere in place across the region, indicative of the development of thunderstorms. In fact, this convective weather moved as far north as the Sacramento Valley in northern California on Monday, February 21st, where weak tornadoes also touched down in the greater Sacramento area near the international airport. Finally by the end of the week, the blocking pattern in the eastern Pacific and western North America pushed inland into the intermountain West and weakened.
Predictably, the major drainages throughout southern California, previously saturated from the late December and early January storms, reached or exceeded flood stages at nearly all forecast points. The Santa Ynez, Ventura, and Santa Clara rivers north of Los Angeles generally peaked Monday, Feb 21, following a night of the more intense rainfall and after several days of light to moderate rainfall. Further south, the San Diego River peaked later Monday evening into Tuesday while the San Luis Rey saw its peak later Wednesday afternoon, February 23rd, when the area received its heaviest rains as the weather system moved slowly eastward across southern California. There were widespread reports of mud and debris flows, rock slides, and small stream and urban flooding throughout southern California. These caused several road closures and considerable property damage. Below are links to unofficial hydrographs for several southern California stream gage locations. **Note that flows at some of the gages extended above existing ratings tables and are not be accurate. |
|||||||||||||||||||||||||||||||||||||||||||||||||||||||||||||||||||||||||||||||||||||||||||||||||||