Heavy Precipitation Event
Southwest Oregon, Northern California, and Western Nevada
December 26, 1996 - January 3, 1997
Navigation: General Summary | Precipitation | Weather Synopsis | Hydrologic Impacts
General Summary
|
A cool winter storm brought valley rain and several feet of mountain snow to southwest Oregon, northern California, and western Nevada on December 21 and 22, 1996. This system only set the stage for what would become one of the most historical flood events to affect the region in recent times. Beginning Christmas Eve, the overall weather pattern began to shift from a polar air mass toward a warmer and wetter tropical regime with promises of a noteworthy precipitation event. Not only would the relentless precipitation through early January 1997 bring widespread flooding, but the snow pack from the pre-Christmas storm would significantly melt to only exacerbate problems from the excessive amounts of runoff.
Over northern California, damage reports due to the high water were widespread while reservoirs released large amounts of water to make room for increasing inflows. More than 100,000 people had to be evacuated as flood waters threatened homes and businesses. The state's agriculture industry suffered severe losses as numerous dairy farms, orchards, and vineyards were affected. Across the San Francisco North Bay counties, the rivers and creeks overflowed their banks, inundating agricultural lands and some cities. In particular, the town of Guerneville was hit hard as flood waters from the Russian River rushed across the area. Inland across the Sacramento and San Joaquin Valleys, several levee breaks were reported. A large levee break occurred on the Feather River above the community of Linda, an area that was also affected by the widespread flooding and another levee break back in February 1986. In Sutter County, an agressive flood fight took place following a levee break in the Sutter Bypass, saving the town of Meridian. Farther south, Yosemite National Park was closed as flood waters from the Merced River shut down all three major roads. A number of people were stranded in the park's lodge for several days until flood waters receeded. Transportation was hampered by the excessive amount of precipitation and melting snow. Major highways, including Interstate 5, Interstate 80, and US Highway 50 were all closed at some point during the event.
Across the eastern Sierra Nevada and portions of western Nevada, the series of storms caused an estimated $1 billion in damages. Numerous homes and businesses suffered extensive damage, while the transportation system experienced widespread issues. Casinos in Reno were using sandbags to protect their properties, allowing several to remain open to gamblers. However, four of the major casinos needed to close during the peak of the flooding due to extensive damage. Major highways were closed due to the flooding or subsequent mudslides, including Interstate 80 both east and west of Reno, US Highway 395 to the north and south of Reno, and the Mount Rose Highway (Nevada State Highway 431). Flood waters from the Walker River destroyed several miles of Highway 395 through the narrow Walker River canyon. The Reno-Tahoe International Airport (RNO) was completely shut down to air traffic as flood waters submerged runways and portions of the terminal building.
The following meteorological information will explain the general synoptic scale evolution of the event, while the hydrological data will show the results of the excessive amounts of precipitation and contribution from the melting snow pack. This data will put the scope of the widespread flooding into perspective. |
Precipitation
[ Click here for an interactive map of precipitation from this event ]
|
A shift in the weather pattern brought warm storms of tropical origin across the region from December 26, 1996 through January 3, 1997, with the most potent system affecting the region at the turn of the year. This change occurred after a cool winter storm affected the region just before Christmas on December 21 and 22, 1996. This polar system left behind several feet of snow over the mountainous terrain; a snow pack that would contribute to the flooding issues just over a week later. With the tropical air mass storms, precipitation fell across much of the west coast with a focus of excessive precipitation over the higher terrain from western Washington southward to northern California and western Nevada. The Oregon Climate Services created a graphical re-analysis of the precipitation for the period of December 29, 1996 through January 3, 1997, which indicated the widespread nature of these storms. Across California, the heaviest precipitation was observed over the coastal mountains, Shasta Lake drainage, and northern Sierra Nevada. As the precipitation began to dissipate on January 3, 1997, the 9-day period showed amounts surpassing 40 inches in the Feather River basin. Elsewhere across the higher terrain of northern California, amounts ranged from 15 to 30 inches. The table below indicates selected precipitation totals for the 6-day and 9-day period ending January 3, 1997.
Northern California 6-Day and 9-Day Precipitation Totals
Ending January 3, 1997 |
| Location |
River Basin |
6-Day Totals
12/29/96-01/03/97 |
9-Day Totals
12/26/96-01/03/97 |
| Gasquet |
Smith |
15.04 Inches |
19.84 Inches |
| Fort Seward |
Eel |
8.88 |
N/A |
| Atlas Peak |
Napa |
14.68 |
18.44 |
| Venado |
Russian |
21.36 |
26.96 |
| Lakeshore |
Sacramento (Shasta Inflow) |
16.93 |
N/A |
| Shasta Dam |
Sacramento (Shasta Inflow) |
20.04 |
23.70 |
| Bucks Lake |
Feather |
33.28 |
42.16 |
| La Porte |
Feather |
30.03 |
40.04 |
| Blue Canyon |
American |
27.87 |
36.34 |
| Auburn Dam Ridge |
American |
7.25 |
9.57 |
| Sacramento |
American |
2.46 |
3.71 |
| Gianelli |
Stanislaus |
16.46 |
18.66 |
| Chilkoot Meadow |
San Joaquin |
16.58 |
19.29 |
For an expanded precipitation gage table for several basins across northern California from December 29, 1996 through January 3, 1997 broken down into 6 hour periods, Select Here.
As expected, precipitation totals at lower elevations were dramatically less. Ideal mid-level flow resulted in a significant contribution from orographic enhancement on south and west facing slopes. Climatological precipitation ratios between the west slopes of the Sierra Nevada and the adjacent Sacramento Valley are near 3:1. During the period from December 26, 1996 through January 3, 1997, observed ratios were approximately 10:1. These observed ratios show the extent of the excellent orographic enhancement of the precipitation. The table below indicates precipitation totals across the Sacramento and San Joaquin Valleys at selected locations.
Sacramento and San Joaquin Valleys 9-Day Precipitation Totals
December 26, 1996 through January 3, 1997 |
| Redding |
Sacramento |
Fresno |
Bakersfield |
| 5.29 Inches |
3.71 |
2.39 |
1.10 |
The following table represents statistics of maximum precipitation amounts categorized into specified time periods from 6 hours to 3 days. Blue Canyon is located in the American River basin along Interstate 80, Bucks Lake is located in the Feather River basin south of California State Highway 70, and Shasta Dam is located in the Upper Sacramento River basin at the base of Shasta Lake along Interstate 5.
Greatest Precipitation Amounts for Specified Periods (in Inches)
December 26, 1996 through January 3, 1997 |
| Location |
6 Hour |
12 Hour |
18 Hour |
24 Hour |
36 Hour |
48 Hour |
72 Hour |
| Blue Canyon |
4.65 |
7.76 |
10.75 |
13.51 |
17.06 |
18.51 |
22.83 |
| Bucks Lake |
3.48 |
6.64 |
9.88 |
12.16 |
15.04 |
20.72 |
27.56 |
| Shasta Dam |
2.48 |
5.61 |
7.03 |
7.72 |
9.89 |
13.16 |
16.78 |
| Note: This data is from automated gages and is calculated using 6-hour blocks ending 4 AM PST, 10 AM PST, 4 PM PST, and 10 PM PST. This method may not represent the absolute maxima. |
The California Department of Water Resources' (DWR) 8-station index, an average of eight precipitation gages located along the northern Sierra Nevada between Lake Shasta to the north and the American River to the south, received 28.89 inches of precipitation for the month of December 1996. This ranks as the second wettest month recorded (since 1920). The wettest month ever occurred in December of 1955 when 30.83 inches were observed. Also, when combining December 1996 and January 1997 precipitation, the 47.84 inches that was observed set the record for the wettest back-to-back months. The table below shows the top six December-January combined precipitation totals.
8-Station Index Wettest Combined December and January (since 1920) |
Year |
December Total |
January Total |
Dec and Jan Total |
1996-1997 |
28.89 Inches |
18.95 Inches |
47.84 Inches |
1955-1956 |
30.83 |
16.11 |
46.94 |
1969-1970 |
16.86 |
25.05 |
41.91 |
1964-1965 |
26.71 |
10.61 |
37.32 |
2005-2006 |
25.80 |
9.80 |
35.60 |
1968-1969 |
12.15 |
22.96 |
35.11 |
| Note: This data is up-to-date as of May 2007. |
Although less than their counterparts on the west slope of the Sierra Nevada, significant amounts of precipitation along with a melting snow pack contributed to the widespread flooding across the eastern Sierra Nevada and portions of western Nevada. The greatest amounts were recorded near the crest of the Sierra Nevada (in excess of 20 inches) with lesser amounts over points to the east. The table below indicates precipitation totals at selected locations for the 9-day period ending January 3, 1997.
Eastern Sierra Nevada and Western Nevada 9-Day Precipitation Totals
Ending January 3, 1997 |
| Location |
River Basin |
9-Day Totals
12/26/96-01/03/97 |
| Susanville |
Susan |
5.51 Inches |
| Tahoe City |
Truckee |
13.63 |
| Truckee |
Truckee |
12.74 |
| Reno-Tahoe Int'l Airport |
Truckee |
2.15 |
| Markleeville |
Carson |
8.13 |
| Carson City |
Carson |
4.27 |
| Bridgeport |
Walker |
2.16 |
For an expanded precipitation gage table for several basins across the eastern Sierra Nevada and portions of western Nevada from December 26, 1996 through January 3, 1997 broken down into 6 hour periods, Select Here.
|
Weather Synopsis
|
The series of storms that affected the region between December 26, 1996 and January 3, 1997 was a classic instance of the weather pattern classified as the "pineapple express". The flooding during this significant precipitation event was not attributable to a single storm, but rather a series of successive storms that affected the region spanning a period just over a week. Collectively, these storms resulted in increased runoff until a final New Year's Day storm pushed rivers and flood projects beyond their natural or designed capacities.
Several meteorological factors contributed to the evolution of the pattern that brought significant precipitation and widespread flooding to the region from late 1996 to early 1997 (see Figure 1 below). The upper level ridge axis aligned along the west coast of North America began to retrograde (shift back toward the west) as cooler air dropped southwest across British Columbia. An upper level high pinched off over southwest Alaska, as a deep upper level low undercut the upper level ridge and situated itself near 40° North and 160° West.
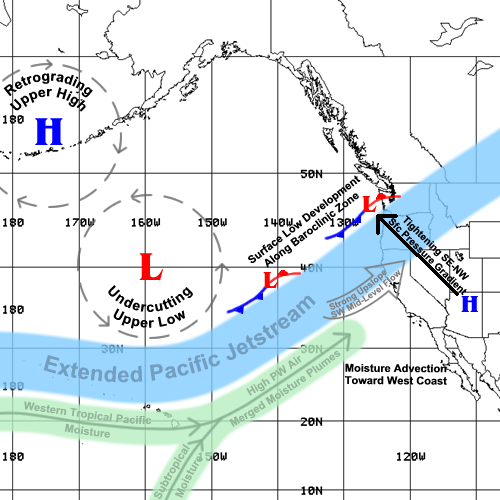
Figure 1. Synoptic pattern of the December 26, 1996 - January 3, 1997 storms
The upper jet stream across the Pacific during the late December and early January timeframe is typically strongest from just off the Asian continent eastward to the International Dateline, between 30° and 35° North (see Figure 2 below).
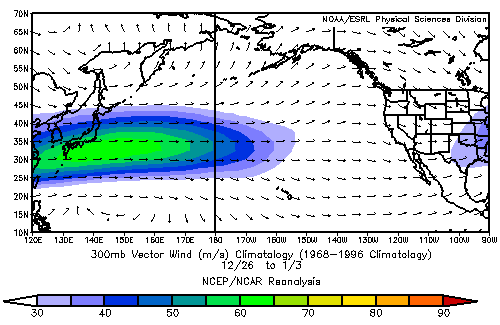
Figure 2. 300 mb Wind Vector Climatology for December 26 - January 3 (1968 to 1996 data)
However, during the December 26, 1996 through January 3, 1997 period, the upper jet stream extended across the eastern Pacific and arched from just north of the Hawaiian Islands toward the Pacific Northwest and northern California (see Figure 3 below). Wind speeds within this jet stream peaked near 180 knots over the western Pacific, well above normal.
Figure 3. 300 mb Wind Vector Analysis for December 26, 1996 - January 3, 1997
An influx of lower latitude moisture played a key role in the generation of significant precipitation across the region. Two distinct moisture sources were evident on the precipitable water analysis between December 26, 1996 and January 3, 1997. The first source advected eastward from the western Pacific toward the Hawaiian Islands. The second advected northward from near the equator between 150° and 160° West. These two moisture plumes merged near the Hawaiian Islands, and shifted northeast toward the west coast of the United States. Composite daily mean precipitable water values just off the California coast exceeded 1.6 inches (40 mm) and peaked near 1.8 inches (45 mm), as shown in Figure 4 below.
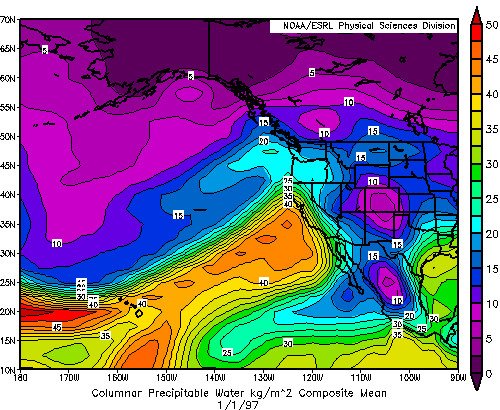
Figure 4. Composite Mean Precipitable Water for January 1, 1997
Several areas of surface low pressure developed offshore along the strong baroclinic zone, and shifted northeast toward the Pacific Northwest. These features played two distinct roles during this significant precipitation event. First, they slowed the progress of the entire baroclinic zone across the region, which resulted in a prolonged period in the warm-sector during the significant precipitation event. Surface dewpoint temperatures in the mid to upper 50s across northern California at 10 PM PST on New Year's Eve provided evidence of this warm-sector air mass. Secondly, they increased the southeast-to-northwest surface pressure gradient from a surface high pressure situated over the desert southwest to the surface low pressures moving across the Pacific Northwest. As a result, low-level winds increased from the south and southeast.
In a Medford to Fresno cross-sectional analysis of the event from the 12 UTC Eta Model, one can see the strong southerly component of the wind moving moisture up the sloping isentropic surfaces over northern California. The shaded area of the diagram shows the strong omega (vertical motion) over this area.
Strong mid-level flow resulted in a significant precipitation contribution from orographic processes. Typical ratios between the west slopes of the Sierra Nevada and the adjacent Sacramento Valley are 3:1. However, with the ideal directional flow out of the southwest and the increased magnitudes, precipitation ratios reached 10:1 during the entire event. It can be concluded that orographic processes dominated a good portion of the New Year's Day storm along with the preceding systems.
Given the tropical origin of the air mass that accompanied these storms, snow levels rose considerably and at times exceeded 10,000 feet MSL. Efficient warm rain processes dominated during this event. The primary precipitation type remained in the form of rain, resulting in a substantial contribution of runoff from higher elevations. In fact, the warm rains did reduce the snow pack already in place from previous storms.
Numerical weather prediction models before the Christmas 1996 holiday break were indicating a fairly benign weather pattern with strong ridging situated over the western United States. This pattern would have been more conducive for dense valley fog rather than heavy rain. Within the next couple of model runs, the scope of the impending siege of wet warm storms began to emerge.
The table below contains loops (requires java-enabled browser) at various pressure levels for the December 25, 1996 - January 2, 1997 period. Time intervals of the frames are every 6 hours (4 PM PST, 10 PM PST, 4 AM PST, and 10 AM PST), except for the Total Precipitable Water (TPW) images that represent daily values.
Loop |
Comments |
|
This loop shows the upper jet that spanned much of the Pacific, reaching speeds in excess of 180 knots. |
|
This loop shows the mid-level of the atmosphere, useful in locating upper ridges and troughs. Note the retrogression or westward shift of the upper high pressure system located over the Gulf of Alaska. Also note how the colder air (lower heights) digs off the coast of Canada in the eastern Pacific. This maintained the strength of the upper jet as it approached the west coast. |
|
This is a loop of the 700mb temperatures (in degrees C). Note that the 0°C isotherm remained over California during much of the event, denoting the high snow levels at or above 8,500 feet. Typically, 700mb temperatures of 0°C equate to 8,500-foot snow levels. |
|
This is a loop of the 850mb wind speeds (m/s). To convert m/s to miles per hour, multiply by 2.2. Note the tremendous low level jet maximum of 40 m/s (in excess of 80 mph) off the coast of northern California and southwest Oregon on New Year's Eve. |
|
This is a loop of surface pressure analyses. The most notable feature was the deep large surface low that developed near 40° North and 160° West and eventually tracked into the Pacific Northwest. At times, the N-S gradient across California exceeded 20 mb, resulting in strong southerly winds, particularly in the Sacramento Valley. In this pattern, southerly flow often leads to heavy precipitation as winds converge and lift into the mountainous terrain at the north end of the Sacramento valley. |
|
This loops shows a daily composite mean of Total Precipitable Water (TPW). Units are in kg/m2 (equivalent to mm in units of volume of liquid water per unit area. Divide by 25.4 to convert to inches). Note the broad moisture plume of 1.6-1.8 inches TPW aimed at California on January 1, 1997. From the loop, it appears the tropical moisture plume that affected the west coast on New Year's Day was a merger of two plumes, one originating in the western tropical Pacific, and another drifting northward from the the subtropics between 150° and 160° West. |
The following upper air soundings (radiosondes) launched every 12 hours (00 and 12 UTC) display vertical profile of winds, temperature (plotted in red), dew point temperature (plotted in blue), and total precipitable water in the column at Medford, Oakland, and Reno. Certain highlights during the peak of the event around New Year's Day include:
- low-level winds veering with height (indicative of strong warm air advection),
- strong mid-level winds generally between 40 knots and 70 knots from the southwest (favorable for efficient orographic processes along south and west facing slopes of the coastal mountains, Sierra Nevada, and Cascades),
- freezing levels near 10,000 feet or even higher (indicating a deep warm layer conducive to efficient warm rain processes),
- near-saturation through the sounding with precipitable water of 1.06 inches at Medford (approximately 235 percent of normal), 1.69 inches at Oakland (approximately 290 percent of normal), and 0.84 inch at Reno (approximately 330 percent of normal),
- generally stable or conditionally unstable vertical profiles. The lack of strong vertical updrafts allow more resident time in cloud to maximize deep warm layer rain processes (collision and coalescence).
Archived satellite imagery during the December 26, 1996 through January 3, 1997 period is limited. Despite these limitations, we are able to provide a short loop of scanned enhanced infrared images, as well as a visible, water vapor, and enhanced IR image taken at the height of the storm period. When possible in the future, we hope to access higher quality images and make them available. The imagery shows the tropical moisture from west of the Hawaiian Islands being entrained into the strong zonal Pacific flow to the west coast. Even more impressive is the wide baroclinic cloud band that delivered the final major New Year's Day storm.
The table below shows how the Rhea orographic
aid performed during the event. As mentioned earlier, this was a prolonged storm event with a deep
moisture connection to the tropics, strong prevailing SW winds at
700 millibars, and high snow levels (ideal conditions for which the
orographic model was developed). The table rows show 5-day QPF daily
totals (12 UTC-12 UTC) from successive runs of the orographic aid using
input from the 00 UTC MRF model vs. observed rainfall for the same
5 days for the Feather River basin (an average of several gages in
the basin shown in the right column of the table). (Note: the final day of each run shows ">" because the aid was based on the 00 UTC run and consequently only provides the first 12 hours of the final day of each MRF-based run.) Also included
at the bottom of the table is the 12-36 hour QPF output from the daily
00 UTC Eta model orographic run. The 5-day orographic aid QPF totals
are generally within 2.0 inches of the observed totals for the MRF-based
runs and within 0.3 inches during the wettest 5-day period of the
event. The Eta-based aid shows similar results although it tended to overpredict
during the drier days and underpredict on the wetter days...but astonishingly
almost matched exactly with the precipitation total for the entire
9-day event of 26.8 inches.
Rhea Orographic Aid Output
Feather
River Basin - Dec 1996-Jan 1997 Flood Event |
| MRF
Input
00 UTC |
24-Hour QPF (12 UTC - 12 UTC)
|
Total
Orog
QPF |
Total
Obsvd
Pcpn |
Dec
24-25 |
Dec
25-26 |
Dec
26-27 |
Dec
27-28 |
Dec
28-29 |
Dec
29-30 |
Dec
30-31 |
Dec 31
-Jan 01 |
Jan
01-02 |
Jan
02-03 |
12/24/96 |
0.0 |
0.2 |
2.1 |
1.0 |
>.3 |
|
|
|
|
|
>3.6 |
5.6 |
12/25/96 |
|
0.2 |
2.2 |
1.8 |
4.3 |
>4.6 |
|
|
|
|
>13.1 |
8.3 |
12/26/96 |
|
|
2.6 |
1.4 |
4.0 |
4.2 |
>2.1 |
|
|
|
>14.3 |
13.9 |
12/27/96 |
|
|
|
1.4 |
3.4 |
4.2 |
5.4 |
>2.2 |
|
|
>16.6 |
15.5 |
12/28/96 |
|
|
|
|
3.2 |
3.8 |
4.4 |
3.2 |
>4.3 |
|
>18.9 |
20.8 |
12/29/96 |
|
|
|
|
|
4.2 |
4.1 |
5.8 |
4.7 |
>2.7 |
>21.5 |
21.2 |
12/30/96 |
|
|
|
|
|
|
3.5 |
6.2 |
5.4 |
1.3 |
16.4 |
18.5 |
12/31/96 |
|
|
|
|
|
|
|
5.4 |
6.2 |
3.3 |
14.9 |
12.8 |
01/01/97 |
|
|
|
|
|
|
|
|
6.3 |
4.2 |
10.5 |
8.0 |
01/02/97 |
|
|
|
|
|
|
|
|
|
3.1 |
3.1 |
1.3 |
Observed
Pcpn
|
0.0 |
0.1 |
3.2 |
1.4 |
0.9 |
2.7 |
5.7 |
4.8 |
6.7 |
1.3 |
-- |
-- |
Eta Model Input
24-Hour QPF (12 - 36 Hour valid times of each 00 UTC run) |
12-36hr |
0.0 |
0.4 |
2.4 |
N/A |
2.8 |
4.1 |
4.3 |
3.7 |
5.7 |
3.4 |
26.8* |
-- |
Observed
Pcpn
|
0.0 |
0.1 |
3.2 |
1.4 |
0.9 |
2.7 |
5.7 |
4.8 |
6.7 |
1.3 |
-- |
26.8 |
*Total orographic aid QPF data incomplete due to unavailability of the Dec 27 00 UTC Eta model run. |
Hydrologic Impacts
Many reports have been written about this event and what seems to be a common observation was the extreme nature of the orographic precipitation combined with the detrimental effects of the high snow levels that accompanied these storms. This is noted in the runoff data, showing that the northern California coastal rivers experienced major rises and notable flooding, but the most damaging runoff occurred from the tremendous amount of rainfall and melting snow that occurred in the higher elevations of the Sierra Nevada and extending across the crest into western Nevada.
The three tables that follow provide a sampling of peak stages/flows for several rivers throughout northern California and western Nevada. Flood stages valid at the time appear in the last column to help put into perspective the degree of flooding that occurred. Stage/flow information was taken from USGS Water-Data Reports for California and Nevada for the Water Year 1997. Those marked with * are based on local CNRFC unofficial records kept of the 1996-97 flood event.
Since the north coast river basins are generally lower in elevation, the impact of high snow levels was not as critical as it was to the Sierra Nevada basins. Still, much of the area saw precipitation amounts ranging from 10 to 25 inches during the Dec 26 - Jan 3 storm period. Greatest precipitation amounts focused on the Eel and Russian River basins, and this is where the flooding was of greater magnitude. The 45 foot flood stage on the Russian River at Guerneville was about 3.5 feet lower than the 48.56 stage of 1986, which was the highest of record. Unfortunately this was of little consolation for residents of this area, having experienced the second highest stage of record just two years earlier in 1995. For the Eel River at Scotia, the stage peaked about 4 feet above flood stage, but well below the historical estimate of 72 feet and a discharge of 752,000 cfs during the Dec 23, 1964 event.
| North Coast Rivers |
| River |
Gage |
Peak
Instantaneous
Stage (Feet) |
Peak
Instantaneous
Flow (cfs) |
Date |
Flood
Stage (Feet) |
| Smith |
Jed Smith |
28.5* |
112,500* |
01/01/97 |
29.0 |
| Smith |
Dr. Fine Bridge |
31.4* |
101,600* |
01/01/97 |
33.0 |
| Klamath |
Orleans |
37.79 |
258,000 |
01/01/97 |
38.0 |
| Klamath |
Turwar Creek |
45.2* |
--- |
01/01/97 |
34.0 |
| Trinity |
Hoopa |
42.97 |
122,000 |
01/01/97 |
48.0 |
| Redwood Creek |
Orick |
28.22 |
40,300 |
01/01/97 |
32.0 |
| Mad |
Arcata |
24.65 |
51,900 |
01/01/97 |
22.0 |
| Van Duzen |
Bridgeville |
18.73 |
37,100 |
12/30/96 |
17.0 |
| Eel |
SF Miranda |
33.64 |
94,400 |
01/01/97 |
33.0 |
| Eel |
Fort Seward |
52.86 |
240,000 |
01/01/97 |
--- |
| Eel |
Scotia |
54.97 |
360,000 |
01/01/97 |
51.0 |
| Eel |
Fernbridge |
25.28 |
--- |
01/01/97 |
20.0 |
| Russian |
Hopland |
18.84 |
20,000 |
12/31/96 |
21.0 |
| Russian |
Healdsburg |
24.61 |
65,700 |
01/01/97 |
19.0 |
| Russian |
Guerneville |
44.99 |
82,100 |
01/01/97 |
32.0 |
| Napa |
Napa |
28.07 |
18,600 |
01/01/97 |
25.0 |
| *Data from local CNRFC records kept of the Dec 1996-Jan 1997 flood event
|
As noted several times, runoff from the Sierra Nevada basins that drain into the central valley of California was compounded by rain at the higher elevations and contributions from melting snow. The final New Year's Day storm certainly put the Sacramento-Feather River flood control system to the test, balancing local runoff and reservoir releases required to maintain the integrity of the system itself. A NOAA/NESDIS satellite image clearly shows the extent of flooding along the Sacramento-Feather River systems and the tremendous amount of water in the bypass system that empties through the Sacramento Delta into San Francisco Bay. As shown in the table below, weir overflow was enormous, with water depths as much as 10 feet spilling over the crests of the weir structures into the bypass. Unfortunately, the high flows overstressed some levees, with breaches reported on the Feather, Cosumnes, Mokelumne, and Tuolumne Rivers.
| Central Valley and Sierra Nevada |
| River |
Gage |
Peak
Instantaneous
Stage (Feet) |
Peak
Instantaneous
Flow (cfs) |
Date |
Flood
Stage (Feet) |
| Cow Creek |
Millville |
21.58 |
37,700 |
01/02/97 |
--- |
| Sacramento |
Bend Bridge |
30.62 |
121,000 |
01/01/97 |
27.0 |
| Sacramento |
Tehama Bridge |
221.2* |
153,300* |
01/01/97 |
213.0 |
| Sacramento |
Ord Ferry |
118.7* |
213,000* |
01/01/97 |
114.0 |
| Sacramento |
Butte City |
95.02 |
--- |
01/01/97 |
97.2 |
| Sacramento |
Moulton Weir |
82.3*
+5.5 overflow
|
--- |
01/03/97 |
76.8 (crest)
84.4 |
| Sacramento |
Colusa Weir |
68.9*
+7.1 overflow
|
--- |
01/03/97 |
61.8 (crest)
71.0 |
| Sacramento |
Colusa |
68.67 |
48,400 |
01/03/97 |
70.0 |
| Sacramento |
Tisdale Weir |
53.2*
+7.7 overflow |
--- |
01/03/97 |
45.5 (crest)
53.0 |
| Sacramento |
Fremont Weir |
42.5*
+9.0 overflow
|
--- |
01/02/97 |
33.5 (crest)
40.8 |
| Sacramento |
Verona |
42.09 |
104,000 |
01/02/97 |
41.3 |
| Sacramento |
Sacramento Weir |
30.30
+10.1 overflow |
116,000 |
01/03/97 |
20.2 (crest) |
| Sacramento |
I Street |
30.40 |
107,500 |
01/03/97 |
31.0 |
| Feather |
Gridley |
100.42 |
163,000 |
01/02/97 |
103.8 |
| Feather |
Yuba City |
78.2* |
--- |
01/02/97 |
80.2 |
| Feather |
Nicolaus |
50.4* |
--- |
01/02/97 |
48.0 |
| American |
H Street |
42.7* |
--- |
01/03/97 |
42.8 |
| Yolo Bypass |
Lisbon |
27.2* |
~500,000* |
01/03/97 |
26.2 |
| Clear Lake |
Lakeport |
7.92 |
--- |
01/04/97 |
9.0 |
| Cosumnes |
Michigan Bar |
18.54 |
93,000 |
01/02/97 |
12.0 |
| San Joaquin |
Newman |
65.8* |
34,500* |
01/07/97 |
69.4 |
| San Joaquin |
Vernalis |
34.88 |
75,600 |
01/05/97 |
29.0 |
| Merced |
Pohono Bridge |
23.43 |
24,600 |
01/03/97 |
--- |
| *Data from local CNRFC records kept of the Dec 1996-Jan 1997 flood event |
For the east side of the Sierra Nevada and the rivers that drain eastward into western Nevada, runoff from heavy precipitation, high snow levels and melting snow was even more pronounced. As noted in the precipitation tables for this area, precipitation was unusually heavy for the normally rain-shadowed east slopes of the Sierra Nevada. For example, Truckee Ranger Station received 40 percent of their normal annual precipitation in the 9-day period ending January 3rd. Reno-Tahoe International Airport, which normally averages a little over 7 inches per year, received 2.15 inches or nearly 30 percent of it's annual normal during the same 9 days. Whats even more remarkable, Reno-Tahoe International Airport measured slightly over 1.5 inches less than Sacramento during the storm period. Flooding was widespread in the Truckee Meadows and was greater in magnitude than what occurred February 1986, the last time a similar event had taken place. Similar damaging flooding extended southward into the foothills and valleys of the Carson and Walker Rivers. Flood waters covered large areas of Carson City, with serious flooding of smaller creeks and streams that drain the east slopes of the Sierra Nevada.
| East Side Sierra Nevada |
| River |
Gage |
Peak
Instantaneous
Stage (Feet) |
Peak
Instantaneous
Flow (cfs) |
Date |
Flood
Stage (Feet) |
| Truckee |
Farad |
13.13 |
14,900 |
01/02/97 |
11.0 |
| Truckee |
Reno |
14.94 |
18,200 |
01/02/97 |
12.0 |
| Carson |
Carson City |
18.43 |
30,500 |
01/03/97 |
10.0 |
| Carson |
WF Woodfords |
15.36 |
8,100 |
01/01/97 |
6.0 |
| Carson |
EF Gardnerville |
13.00 |
20,300 |
01/02/97 |
7.0 |
| Walker |
Coleville |
10.23 |
12,500 |
01/02/97 |
7.0 |
Leading up to the December 26, 1996 through January 3, 1997 significant precipitation event, the major reservoirs were able to reduce their storages based on the latest weather forecasts, scheduled operations, and downstream conditions. When the series of storms began to affect the region, these flood control projects had essentially regained their respective flood reservation space. As the strongest of the storms in the series pummeled the area around New Year's Day, these reservoirs quickly filled near capacity requiring an increase in downstream releases. This series of storms set new records for instantaneous peak flows, one-day flows, and three-day flows into Shasta Lake and Lake Oroville. The three-day flow into Folsom Lake was only slightly exceeded by the February 1986 flood event. The following table provides links to graphs depicting reservoir inflow, reservoir outflow, and reservoir storage for Shasta Lake, Lake Oroville, and Folsom Lake.
| Location |
Reservoir Inflow and Outflow |
Reservoir Storage |
Shasta Lake |
|
|
Lake Oroville |
|
|
Folsom Lake |
|
|
Given the tropical origin of these storms and resultant high snow levels (peaking above 10,000 feet), much of the precipitation fell in the form of rain and resulted in a substantial runoff contribution from higher elevations. Ironically from a water supply perspective, these warm moist storms can be detrimental to the region's water supply as reservoir flood releases are required to offset the increased inflows. At issue is the balance of flood space and water supply storage. These warm storms contribute little to building snow pack, and in certain cases can even decrease the higher elevation snow pack. Looking at the entire 1996-1997 water year, extremely wet conditions affected the region during the months of December and January. However, the remainder of the winter and early spring saw relatively little precipitation. The water content of the northern Sierra Nevada snow pack was only 60 percent of the April 1 average and most major California reservoirs failed to fill to capacity from the spring snow melt.
Below are some short home video clips recorded on the 3rd of January in the Sacramento area. (Note: videos are in .wmv format. Small files are 320x240 pixel resolution and suitable for dial-up internet connections. Large files are 640x480 pixel resolution and suitable for high-speed DSL/Cable connections.)
| Sacramento Area Hydrology Videos - Recorded January 3, 1997 |
| Location |
Dial-Up Connection
(320x240 Resolution) |
Hi-Speed Connection
(640x480 Resolution) |
| American River at Rainbow Bridge (Folsom) |
[small - 3.5 MB] |
[large - 22 MB] |
| American River at Nimbus Dam |
[small - 4 MB] |
[large - 13.5 MB] |
| American River at H Street Bridge |
[small - 2 MB] |
[large - 11 MB] |
| Sacramento River at I Street Bridge |
[small - 2.4 MB] |
[large - 9.6 MB] |
| Sacramento River at Sacramento Weir |
[small - 3.4 MB] |
[large - 9.2 MB] |
Here is a video compilation from the National Park Service showing flooding in Yosemite Valley during both the January 1997 and May 1996 flooding.
|
|
