|
Heavy Precipitation Event Navigation: General Summary | Precipitation | Weather Synopsis | Hydrologic Impacts A prolonged period of heavy precipitation beseiged southern California beginning Friday, January 7th and continued almost unabated through Tuesday, January 11th. In its aftermath, the storms caused tragic loss of life, including 10 deaths attributed to a landslide into homes in the small coastal community of La Conchita (Ventura County), and millions of dollars of flood and storm-related damage throughout southern California. [ Click here for an interactive map of precipitation from this event ] While little of southern California was spared from the heavy rains, the areas hardest hit stretched from near Point Conception west of Santa Barbara to the San Gabriel and San Bernardino Mountains north and east of Los Angeles, where storm totals through the duration of the event exceeded 30 inches in the wettest locations. As if this were not enough, a prior storm period that began a few days after Christmas and continued into the first week of January saw an additional 10 to 20+ inches of precipitation in this same area. For example, the precipitation gage at Old Man Mountain in the Ventura River drainage recorded 24.05 inches between December 26th and January 5th. The table below shows some unofficial rainfall totals from both storm periods for some key gages in southern California.
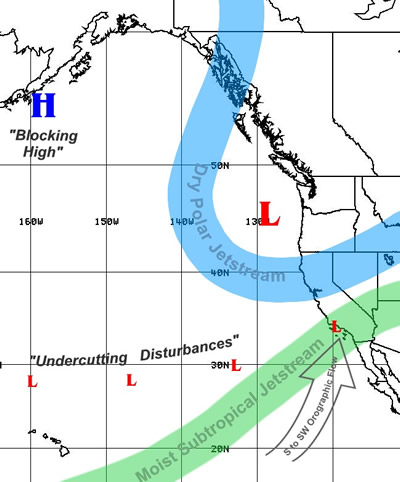
Graph of 6-Hour Precipitation for several gage locations in southern California The storm period between Dec 26 - Jan 04 was attributed initially to a very cold deep upper low that descended out of the Gulf of Alaska. By Tuesday, Dec 28th, the low settled off the coast of central California, with a powerful low level jet of 50-70 knot winds at 850 millibars (around 5,000 feet MSL) taking direct aim on the transverse mountain ranges of southern California. The system tapped into a moderately moist subtropical airmass with total precipitable water near 1.0 inch. This marked the beginning of a cold wet period with a series of deep upper lows dropping down from the north into a long wave trough positioned just off the west coast. This pattern would continue to impact much of the California into Nevada into the new year with 7 to 10 feet of fresh snow piling up in the Sierra Nevada and heavy rains along the coast of central California as well as initially into the Mount Shasta area. The second in the series of upper lows moved into southern California later in the week producing more heavy rains and snow at the higher elevations on New Year's Eve day. A final upper low would later send another round of moderate precipitation once again into southern California on the third and fourth of January, followed by a couple of days of relatively dry weather. The dry spell was short-lived as a more ominous pattern was organizing in the eastern Pacific (see Figure 1 below). Of greatest concern was a "breakthrough" of subtropical moisture that would eventually mix with another cold low that was descending down the west coast from British Columbia. With a blocking pattern setting up further out in the Pacific, the second foreboding concern would be the anticipated prolonged duration of the upcoming event as the large upper low pressure system was forecast to become stationary off the coast of northern California, in an ideal location to stream subtropical moisture northeastward into southern California.
The threat would soon be realized as the initial cold front spread rain into southern California beginning Friday morning, January 7th. This proved to be just the beginning as heavier rains materialized on Saturday that persisted through the remainder of the weekend and into Monday before finally tapering off from northwest to southeast on Tuesday morning, January 11th. While the winds were not as strong as the preceding events of late December, the moisture-laden subtropical air with precipitable water near 1.5 inches and weak embedded shortwaves rippling along the subtropical jet focused heavy prolonged orographic rainfall with high snow levels into the transverse ranges of southern California.
Already noted were the mudslides throughout much of the area, with considerable damage to roads and several areas isolated due to washed out roads, debris, etc. All major river basins in southern California were impacted to some degree by the sheer volume of precipitation that fell from the two combined storm periods, stretching from the upper Salinas River from the late December storms, to the Mexican border by the time the early January storms were finished. The greatest impact was felt along the coast from the Santa Ynez River north of Santa Barbara to the San Luis Rey River at Oceanside. Highest flows of record were noted in the Ventura River and the Santa Clara River northwest of Los Angeles. Lake Cachuma northwest of Santa Barbara saw an elevation rise of over 34 feet from the 7th of January to fill the reservoir by the 11th, requiring flood releases into the Santa Ynez River. The normally dry flood control reservoir above Prado Dam on the Santa Ana River reached a storage of around 100,000 acre-feet with downstream releases of 10,000 cfs. The San Diego River at Fashion Valley rose to just touch flood stage near the end of the storm period as the tail end of the system moved across the basin. Northern California major rivers fared much better as the snow levels were low enough to add generously to the already large snowpack, but provide little contribution to runoff. However, weir flow did occur on the Sacramento River from the late December storms and unusually high tides and winds caused some levee erosion problems in the Sacramento Delta during the January storms. Below are links to unofficial hydrographs for several southern California stream gage
locations. ** Note some flows at some of the gages extended well above existing ratings tables and are not
accurate. |
||||||||||||||||||||||||||||||||||||||||||||||||||||||||||||||||||||||||||||||||||||||