|
Heavy Precipitation Events Navigation: General Summary | Precipitation | Weather Synopsis | Hydrologic Impacts | Multimedia | Additional Resources After several years of drought conditions, California received historical amounts of precipitation between October 2016 and February 2017. Several series of moist systems moved through California and Nevada during January and February 2017 bringing abundant precipitation and flooding. January 2017 had above-normal precipitation for almost all of CA except SE California deserts. Most of western Nevada and northeastern Nevada saw above-normal precipitation. Northern and central California, especially along the coast and over the Sierra and San Diego County saw above-normal precipitation again in February 2017. The majority of the precipitation fell over San Diego County on February 17 (1.07 inches at Lindbergh Field) and record-setting precipitation (2.34 inches at Lindbergh Field) on Feb. 27. The combination of the wet January and February 2017 ranked the wettest "Jan + Feb" on record for the northern Sierra (8 Station Index - 97 years) and for the San Joaquin River basin (5 Station Index - 113 years) and second wettest for the Tulare basin (6 Station Index - 96 years). Heavy precipitation was mainly consolidated into four distinct periods, highlighting the stretch of significant weather during the first two months of 2017. The initial round of precipitation brought the most impressive totals for a majority of the area, and lasted for nearly the entire first half of January. After a change in the overall weather pattern brought a brief respite from the widespread rain and high-elevation snow, the next round of heavy precipitation moved across the region on January 18, 2017 and lasted through January 23, 2017. Although not as heavy as the first round of precipitation earlier in the month, this additional rain and high-elevation snow helped to bring monthly totals to near-record or record breaking amounts. Another brief break from the precipitation moved across the area at the end of January. However, the next significant round of precipitation moved into the area as the calendar turned to February and lasted for the majority of 10 days. This round of intense precipitation represented the second heaviest storm period of the four periods defined for this summary. Finally, another approximately week-long stretch of wet weather returned to the Pacific Southwest from the middle of February to February 22, 2017. The following link contains an interactive map of storm-specific and overall storm-total precipitation for the periods of heavy precipitation in January and February 2017. Data contained on the map has been quality controlled by CNRFC staff. The table below contains links to the daily precipitation totals in a gridded (quality controlled by CNRFC staff) format and gauge (raw data) representation in a KML format compatible in Google™ Earth for each of the storm periods during the months of January and February 2017. These four storm periods encompass the majority of the heavy precipitation during this significant two-month stretch.
The maps below depict gridded monthly precipitation information for January and February 2017, including: quality-controlled observed precipitation, normal precipitation, departure-from-normal precipitation, and percent-of-normal precipitation. During January 2017, the higher terrain across much of California recorded precipitation amounts in a general range from 10 to 20+ inches. Also of note was the significant spillover precipitation that made its way over the Sierra Nevada crest across northern and western Nevada, especially the east slope of the Sierra Nevada. In terms of percent-of-normal precipitation, areas of California from the Interstate 80 corridor south to the US/Mexico border, along with extreme western Nevada generally saw 150 to 400 percent of normal precipitation with localized areas just past the Sierra Nevada crest reaching 600+ percent of normal precipitation. Into February, although another extremely wet month was observed across much of the Pacific Southwest, the focus of the heaviest precipitation shifted slightly to the north with slightly less pronounced spillover precipitation across western and northern Nevada. The mountainous terrain of northern and central California once again saw precipitation totals in a general range from 10 to 20+ inches. For northern and central California, the precent of normal precipitation generally ranged from 150 to 400 percent of normal. Across extreme western Nevada, spillover precipitation was generally 200 to 400 percent of normal. Use the buttons above the imagery to toggle between the different types of precipitation graphics.
The California Department of Water Resources (CA DWR) records precipitation data over the mountainous terrain of California from the Shasta Lake drainage south across the length of the Sierra Nevada, separated into three distinct indices. These indices help CA DWR track the precipitation totals and trends over the sources of the majority of the state's water supply. The 8-Station Index consists of precipitation gauges from Shasta Lake south into the American River basin. The 5-Station Index stretches across the San Joaquin River basin. Finally, the southern-most 6-Station Index covers the Tulare basin. The tables below cover the four significant storm periods during January and February 2017, broken down into daily precipitation totals. The precipitation values are calculated by adding up the observed precipitation at each of the index's gauges and then dividing by the total number of gauges. Although all four storm periods provided their own unique challenges, the period from January 3, 2017 to January 14, 2017 along with February 2, 2017 to February 12, 2017 saw more significant precipitation totals (except for the Tulare basin 6-Station Index, which saw a similar total from January 18, 2017 to January 24, 2017 as compared to February 2, 2017 to February 12, 2017).
The tables below summarize monthly precipitation totals for the three California Department of Water Resources (CA DWR) precipitation indices. These impressive 2-month precipitation totals represent values close to an entire average water year. The 8-Station Index received 94% of an average water year, the 5-Station Index received 105% of an average water year, and the 6-Station Index received 102% of an average water year. Also, as the water year progressed into spring, the 8-Station Index surpassed the wettest water year on record (1982-83 with 88.5 inches). The 8-Station Index recorded 94.7 inches of precipitation during the 2016-17 water year. The 5-Station Index ranks as the second wettest on record (72.7 inches), behind the 1982-83 water year with 77.4 inches. The 2016-17 water year 6-Station Index precipitation currently ranks 7th wettest (46.9 inches) with the record value of 56.3 inches being set during the 1968-69 water year.
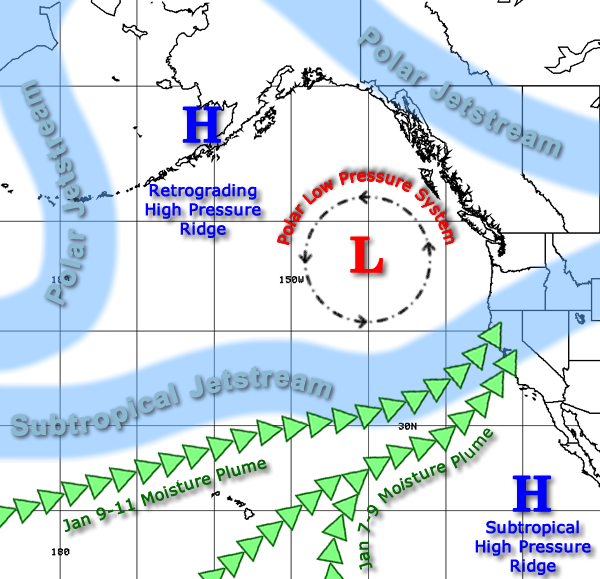
January 3-13, 2017 Weather prediction models pointed toward elevated probability of very cold temperatures across the western U.S. in early January even as late as December 29, 2016, with low-elevation snow a possibility and no sign of significant precipitation events on the horizon. By December 30th, models began to indicate the possibility of wetter systems around January 3-4. On the last day of 2016, a rex block pattern was evident over the NE Pacific Ocean aligned near 150W. Meanwhile, an upper-level low pressure system (cut-off low) moved SE along the CA coast and brought showers to the state, mainly the southern portion including the SE CA deserts. High pressure maintained its position in the Gulf of Alaska through January 4th before retrograding to near the Aleutian Islands and evenutally over western Alaska January 8-9. A nearly-stationary upper low remained near 37N/145W from around January 4th through 6th. The first wave of heavy precipitation began on January 3rd as a surface low and frontal system moved into the region. Heaviest amounts affected areas along the coast from around the Russian basin in the north to near Pt. Conception as well as the length of the Sierra range, with lighter amounts elsewhere. Precipitable water (PW) values reached up to around 1.3 inches near the coast. Precipitation tapered off on the 5th. Snow levels in the central Sierra started off 4000-5000 ft before quickly rising to 7000-8000 ft and remaining there for the duration of the storm. On the night of the 5th during a lull in precipitation, the upper low anchored off the west coast began to transition into an open wave, while another low formed near Juneau, AK. The initial low dissipated as the newly-formed low moved SW and eventually settled near 47.5N/140W by January 7th. This feature helped to direct a moisture plume into CA for a couple of precipitation events with little break in between. Widespread precipitation spread across CA the night of the 6th ahead of a warm-frontal boundary. PW values climbed to 1.0-1.25 inches, and upper-level winds peaked around 130 knots. Areas near the central coast as well as the Sierra picked up the most impressive totals on the 7th as the moisture plume interacted with onshore flow around 40 knots at 850 MB and 40-60 knots at 700 MB near the warm front and ahead of a cold front. A surface low deepened off the Pacific NW coast on the night of the 7th and low-level flow increased from the SW off the coast. The moisture plume was pulled back to the north from the central CA coast to the north coast by the night of the 7th ahead of the next cold front. Precipitation initially intensified along the coast from near Monterey Bay to the Russian basin as well as the northern Sierra late on the 7th as 850 MB winds increased to around 65 kts out of the south and 700 MB winds increased to 70 kts out of the southwest as shown on the Jan 8/12 UTC KOAK sounding. The sounding also reveals a column nearly saturated throughout the troposphere with a PW value of 1.38 inches. Twelve hours later, the sounding reveals little change in moisture with a PW of 1.31 inches. Low- and mid-level flow continued to be strong, and 850 MB veered to a southwesterly direction. Heavy precipitation continued across much of northern CA and portions of the central CA coast. In addition, with strong moisture flux and warm temperatures (snow levels 8000-9000 feet according to the Oroville vertical profiler), the period from around Jan 8/12 UTC to Jan 9/06 UTC (and especially 8/18-9/06 UTC) was very efficient for lee-side ("spillover") precipitation onto the east side of the Sierra crest. Precipitation totals for the peak 12-hour spillover period were 3.26" for Blue Canyon, 2.30" for Truckee, and 1.08" for Reno Airport. This corresponds to a ratio among the three sites of about 3:2:1, compared to a climatological ratio of roughly 9:4:1. On the evening of the 8th into the overnight hours, a cold front finally passed across the area, causing a fairly brief period of heavy precipitation down the coast to around Pt. Conception as well as the southern Sierra before dissipating over southern CA the morning of the 9th. High pressure aloft maintained control over Alaska, while an upper low over the north-central Pacific merged with the low anchored off the west coast. This low helped direct another plume of moisture and a warm front into the CA coast during the night of the 9th. Light to moderate precipitation fell across the northern half of CA the night of the 9th into the 10th. Heaviest amounts were during the day on the 10th along the northern CA coast, northern Sierra, and near Shasta Lake. A cold front moved across the region and gave a quick shot of heavy precip to coastal and Sierra locations the night of the 10th into early on the 11th. One more shot of locally heavy precipitation fell over portions of southern CA on the 12th as the upper low offshore moved inland. January 18-23, 2017 The overall pattern during this period was characterized by mean low pressure over Alaska, high pressure anchored near Hawaii, and multiple shortwave troughs that moved into the west coast. In addition, the upper jet was active over the NE Pacific, with speeds exceeding 180 knots at times. Precipitation began to increase on the north coast of CA on the night of the 17th as a moisture plume intersected the coast ahead of a cold front and increased even more on the 18th as the cold front approached. Some of the initial precipitation fell with snow levels around 9000-10000 feet, but the majority of the storm was accompanied by snow levels in the 4000- to 6000-foot range. Heavier precipitation affected the Sierra and coastal areas as the cold front worked its way south through the morning of the 19th. After a relative break for the remainder of the day, a quick-moving cold front brought another shot of heavier precipitation to coastal areas from the night of the 19th into the 20th. Another lull in precipitation lasted through the 21st. Another frontal boundary moved across the region on the 22nd. PW values peaked around 0.9" in central CA to around 1.2" in far southern CA. Strong low-level flow ahead of the front also contributed to heavy precipitation along the coast, particularly the Russian basin, Big Sur coast, and much of southern CA, where 6-hour rain totals of 1-3 inches were common the afternoon and evening of the 22nd. Showers diminished through the 23rd. February 2-12, 2017 The early-February stormy period featured fairly persistent low pressure aloft off the Washington/British Columbia coast and a strong subtropical jet stream that eventually stretched across the Pacific and penetrated well into the United States. The most significant moisture plume affected the region in two phases and brought very heavy precipitation the night of February 6 into February 7 with a round of heavy but less intense precipitation February 8. The overall focus of heavy precipitation in the February 2-12 time period was across northern and central CA. Early on February 2, upper-level high pressure weakened near southeast Alaska, and shortly after, upper-level high pressure over western Alaska was undercut by low pressure to the south. This opened the door for the subtropical jet stream to expand eastward across the Pacific. Early on the 2nd, a slow-moving cold front approached the CA coast and eventually dissipated along the northern CA coast early on the 3rd. This system brought light precipitation to northern and central CA. As the front dissipated, moisture lingered and low- to mid-level flow became more onshore, helping to enhance precipitation rates. In addition, a band of locally heavy precipitation moved across the area early on the 3rd. A general lull in precipitation was noted on the 4th into the 5th. A cold front brought a quick shot of locally-heavy precipitation to much of CA late afternoon on the 5th into the afternoon of the 6th. This was followed by the wettest system in the series later on the 6th into the 7th. This system featured an impressive moisture plume with PW values up to 1.3-1.4" reported by RAOBS. A surface low of 994 mb was located just off the far NW CA coast early morning on the 7th, and at this time, 850-mb winds peaked around 60 knots in central CA with 700-mb winds peaking around 75 knots into the northern Sierra. Heavy precipitation affected northern and central CA starting in the north later on the 6th and becoming more focused into central CA on the 7th. The morning of the 7th saw a decent period of "spillover" precipitation onto the east side of the Sierra near the Lake Tahoe region. Snow levels in the Sierra were around 6000 ft late on the 6th and rose to around 9000 ft later on the night of the 6th as a warm front moved into the region. Precipitation rapidly declined the evening of the 7th as a cold front dissipated over northern CA. Moist, onshore flow brought precipitation mainly to northern CA on the 8th, heaviest in the northern Sierra. A more impressive moisture plume with an associated cold front brought more widespread heavy precipitation to northern and central CA on the 9th and 10th with lighter amounts in southern CA. Precipitation lingered into the 11th in southern CA. Snow levels were in the 8000- to 10000-foot range in the Sierra from the 8th through the 10th. February 15-22, 2017 The second wet period in February featured persistent low pressure aloft over Alaska, persistent high pressure aloft over the tropical NE Pacific, and a few shortwave troughs and associated frontal systems moving into CA and the Pacific NW. Light precipitation began in northern CA on the 15th as a moisture plume intersected the area. Precipitation picked up heading into the overnight hours as a cold front neared the region. Heavy amounts were generally confined to NW CA and diminished on the 16th. Light precip made it as far south as southern CA. Late night on the 16th and into the 17th, a secondary moisture plume reached the coast while a surface low deepened to 983 mb just off the central CA coast. A special 18 UTC sounding at KVBG (Vandenberg AFB) just ahead of a cold front revealed PW values still around 1.1 inches (similar to the 12 UTC value) as well as southerly 850 MBwinds of 60 knots. This intense moisture flux brought widespread very heavy rainfall to the transverse mountain ranges of southern CA, where 6-hour totals were 1.5 to 4 inches, with local amounts to 5 inches the morning into the afternoon on the 17th. Similar amounts were observed along the Big Sur coast as well, with generally lighter amounts further north. Heavy rain shifted into the remainder of the southern CA coast by the evening of the 18th as the moisture plume steadily moved across the region. The area experienced a lull in precipitation on the 18th. A weak frontal system brought a bit more precip to portions of northern CA on the 19th. Precipitation began to increase late on the 19th into the 20th as a warm front moved into the region along with a moisture plume (PW 1.2" at KOAK). Precipitation increased more during the day on the 20th as a cold front neared and winds picked up. Heaviest amounts were along the central CA coast and in the Sierra. Another system moved into the area later on the 20th and caused heavier precipitation to linger in northern and central CA until early on the 21st before precipitation became light again. Snow levels the 19th into the 21st were around 6000-9000 ft in the Sierra. Weather Graphics
The table below provides links to atmospheric soundings from across the region for each of the four periods of significant precipitation from January to February 2017. Also, a complete loop of the two month period for each radiosonde location is available for viewing. As expected, given the tropical origin of the moisture entrained into each of these systems, precipitable water values are well above average. Freezing levels were also high ahead of each of the cold fronts that traversed the region during January and February 2017. This allowed for efficient warm rain processes to dominate with precipitation remaining primarily in liquid form. Also, strong southerly winds near the surface veered to a southwest and west direction aloft for ideal orographic enhancement of the precipitation over the coastal mountains and Sierra Nevada.
Given the lower-latitude tropical source of the moisture plumes being entrained into the series of storms during January and February 2017, radiosonde locations across the area saw numerous precipitable water values recorded in the top 20 for each month. The historical record used for this summary goes back to 1948 and the top 20 rankings for each radiosonde location is available via the January and February 2017 Radiosonde Precipitable Water webpage compiled by the CNRFC, using two distinct sources of precipitable water information. Snow levels played a crucial role during the waves of heavy precipitation during January and February 2017. Given the tropical origins of the moisture entrained into these storms, snow levels ahead of each cold front were unseasonably high (8,000 to 10,000 feet), which caused high-elevation river basins to experience a greater areal percentage of rain instead of snow. This resulted in increased runoff, higher river levels, and even flooding in some instances. The table below provides links to imagery from vertically-pointed radars, used to determine the zone where frozen precipitation transitions to liquid precipitation (the bright band), which helps calculate the snow level. The table below provides links to a loop of National Weather Service radar data covering the Pacific Southwest for each of the four distinct periods of heavy precipitation during January and February 2017. Each image contains the top-of-the-hour radar mosaic from several individual radars located across the region. Please note, due to the hourly time resolution of these loops, it may take a moment to load.
The table below provides links to both infrared and precipitable water satellite imagery at 3-hour intervals for each of the four periods of significant precipitation during January and February 2017. The infrared satellite imagery depicts the colder cloud tops associated with each of the waves of precipitation that moved across the region. The precipitable water satellite imagery shows the origins of the tropical moisture associated with each of the storm systems and the evolution of these moisture plumes as they advect toward the mid-latitudes and become entrained ahead of the associated cold fronts.
The table below provides links to 6-hourly NCEP/NCAR Reanalysis data composites at different levels of the atmosphere for each of the four periods of significant precipitation during January and February 2017. Many of the parameters also include departure from normal imagery as well.
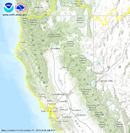
River Conditions* Widespread flooding was experienced across a majority of California and Nevada as a result of the several waves of heavy precipitation that moved across the area during January and February 2017. A few of the more significant hydrologic impacts are highlighted in the following paragraphs. Although forecast points along the Sacramento River surpassed monitor stages and flood stages with some flooding impacts to roads and low-lying flood-prone areas reported (especially across northern stretches of the river near Redding and Red Bluff), the flood control systems and structures designed to prevent catastrophic floods throughout the Sacramento Valley operated efficiently to mitigate impacts along the entire stretch of the river. As Lake Shasta edged closer to its capacity during the second week of February due to increased water inflows from previous storms, releases from the reservoir were increased. Water moved through the four fixed-crest weirs (Moulton, Colusa, Tisdale, and Fremont) into the Butte Basin, Sutter Bypass, and Yolo Bypass. Also, the California Department of Water Resources opened up Sacramento Weir gates on two occasions (35 gates in January and 46 gates in February) to alleviate flooding concerns downstream in Sacramento. A more in-depth discussion of the Sacramento Weir is farther down in this summary. The Russian River saw its greatest rise during the first series of storms to impact the region. The river peaked at Guerneville on January 11 at 37.8 feet, its highest level since 2006. Homes and businesses in the town of Guerneville and Monte Rio experienced flooding of their first floor, displacing hundreds of residents. Farther inland along the Napa River, 3 peaks above flood stage were observed at both Saint Helena and the city of Napa. Roads were closed due to flooding and mudslides, and for the first time ever the downtown Napa River bypass was utilized as a precaution against flooding. Completed in 2015, the bypass was designed and built by the US Army Corps of Engineers with a purpose to steer waters away from the oxbow ("C-Curve") in the Napa River near downtown Napa that has historically caused flooding issues. Also, vineyard flooding was reported across the entire Napa Valley. Flooding along eastern Sierra Nevada rivers occurred during the first and most pronounced wave of spillover precipitation corresponding with elevated snow levels (9000 feet or higher), peaking on January 8. The Truckee River peaked above flood stage at 3 of the 4 forecast locations, including: Truckee, Reno, and Vista. Rising flood waters resulted in officials closing several bridges over the Truckee River in downtown Reno and evacuating several hundred homes. Downstream flood waters closed several roads in the Sparks area, including the industrial area of town. As compared to the January flooding, higher river stages/flows were observed during the third wave of precipitation on the Susan River in Susanville and the Middle Fork Feather River at Portola. Major flooding was observed, peaking on February 9 and 10. In Susanville, widespread flooding resulted in evacuations along Carroll Street, as well as the River Roost Mobile Home Park on South Lassen Street. Some residents were also evacuated from the Susan River Apartments. Numerous streets were closed, and the inundation of several properties occurred. Farther south in Portola, record flooding affected the region. Firefighters worked to pump flood waters out of the Sleepy Pines Motel to keep it from completely flooding, while the historic Veteran's Memorial Hall was inundated. Flood waters also affected many homes and closed numerous roads, including portions of Highway 70. The Merced River at Pohono Bridge in Yosemite National Park was a challenge to forecast with small fluctuations in snow levels and the location of the heaviest precipitation across the southern Sierra resulting in changes to the amount of runoff across the river basin. As a result of the uncertainty in the river forecast, the park was closed and evacuated. After the heavy precipitation fell with the first series of storms, the Merced River crested at 12.7 feet on the morning of January 9 at Pohono Bridge, lower than anticipated. This saved the park from catastrophic damage, like that seen during the January 1997 flood. The river flooded low-lying meadows across the Yosemite Valley. Housekeeping Camp, which is only used in the summer, saw water flow into the area up to housing structures. Half Dome Village (formerly Curry Village) had some water flood some tent cabin areas, but the cabins themselves were left unscathed since they are slightly elevated. Highway 140 (El Portal Road) into Yosemite National Park was closed due to a large rockslide on January 9. A less disruptive rockslide also closed Highway 120, but the road was quickly cleared. One of the biggest impacts and most memorable events from the January and February 2017 heavy precipitation was the Lake Oroville spillway incident. A detailed summary with a timeline of events beginning with the initial damage to the flood-control spillway on February 7, culminating on February 12 with the evacuation of nearly 200,000 people, and the long-term fix is included farther down in this summary. Across northern Nevada, the Humboldt River experienced significant flooding during the second week of February. Leading up to the flood, during late 2016 and early 2017, colder-than-average temperatures and above-average snowfall led to high snow water content over valleys and lower mountain zones across the Humboldt River basin. Then in February, as the warm and moist airmass associated with a tap into tropical moisture moved across the region, overnight temperatures remained above freezing and light to locally moderate precipitation was observed. Given this scenario, the biggest contributor to the flooding was the loss of snowpack, especially below 6500 feet, as the warm and moist environment persisted for several days. One of the high-impact flood events resulting from the heavy precipitation between February 15 and 22 was the inundation of the Rock Springs neighborhood of San Jose, within the Coyote Creek basin, on February 21. Residents of the Rock Springs neighborhood were either under recommended or mandatory evacuations. Several hundred people needed to be rescued as flood waters continued to rise. Just over 500 homes and just over 100 other structures experienced damage from the flood. An element that exacerbated the flooding along Coyote Creek was Anderson Reservoir reaching capacity on February 18. According to the Santa Clara Valley Water District, since Anderson Reservoir was built in 1950, the reservoir reached its capacity in 10 separate years with the most recent occurring in 2006. The river gauge on Coyote Creek rose sharply on February 21 with a peak stage around 13.6 feet. The corresponding flow was above the rating table used at the time, and is estimated around 11,000 cfs. Along the Tuolumne River, on February 20, the Turlock Irrigation District opened one spillway gate on Don Pedro Reservoir for the first time since 1997. With the reservoir nearing capacity and the incoming heavy precipitation expected from February 20 to 22, reservoir releases were increased to near 18,000 cfs to make room for the expected increase in water inflow. Even with the utilization of the one spillway gate, the flows downstream in Modesto were never expected to reach the 1997 levels (71 feet / 60,000 cfs), which resulted in widespread flooding. With a travel time of 23 hours, the increased river flow would reach the Ninth Street Bridge in Modesto on the afternoon of February 21. The river rose above flood stage along the Tuolumne River at Modesto and peaked just shy of 59 feet before leveling off for the next several days and then dropping below flood stage at the end of the month. The spillway gates remained open until the morning of February 27. These increased water releases from Don Pedro Reservoir, along with other water releases throughout the entire San Joaquin River basin resulted in the San Joaquin River at Vernalis to rise above its danger stage (maximum designed capacity of a flood control project) for just over 10 days at the end of February. Lastly, outside of the primary focus of this summary, at the end of February, a system diving south along the west coast and another system west of the southern CA coast phased and moved toward the area near San Diego. A tropical moisture plume stretching from near Hawaii intersected the coast near the California/Mexico border. This meteorological setup brought an intense period of precipitation that last approximately 24 hours on February 27. Precipitation amounts across San Diego County ranged from 2 to 4 inches along coastal locations with 4 to 8 (locally 10) inches observed over the west slopes of the Laguna Mountains. This resulted in a dramatic rise of the San Diego River from a base stage of 3 feet on the morning of February 27 to just over 14 feet in approximately 24 hours. The flow was above the rating table used at the time, and is estimated around 9,500 cfs, which is near the historic peaks of the 1995 and 2011 floods. Many roads were flooded, the parking lots at the Fashion Valley Mall were closed and the Metropolitan Transit System shut down the Fashion Valley Transit Center. Also, the Premiers Inn on the south side of the San Diego River downstream of the Fashion Valley Mall saw flood waters rush into the first floor. * Information / Data Sources: California Department of Water Resources, Redding Record Searchlight, San Francisco Chronicle, Napa Valley Register, Reno Gazette-Journal, Lassen County Times, Plumas County News, Fresno Bee, San Jose Mercury News, Modesto Bee, and San Diego Union-Tribune The map below shows the locations the CNRFC is responsible for providing flood forecasts for their government and private-sector partners along with the general public. The colors represent the maximum observed river stage and flow category (normal, monitor, flood, or danger) each location reached during the January and February 2017 flood event. To access the hydrograph for any of these 98 locations, select the desired dot on the map below, or select the location from the river-group-specific pull-down menus to the right of the map. From the data presented on the map, it is evident the scope of the flooding event was widespread across coastal, valley, and mountainous California, the upper Klamath River basin in southern Oregon, and the eastern Sierra river basins and Humboldt River basin in Nevada. Only 17 of the 98 flood forecast locations did not experience a rise above a significant threshold, while 39 surpassed the defined monitor stage, 41 surpassed the defined flood stage, and 1 (San Joaquin River at Vernalis) surpassed the danger stage, which is defined as the maximum designed capacity of a flood control project (leveed).
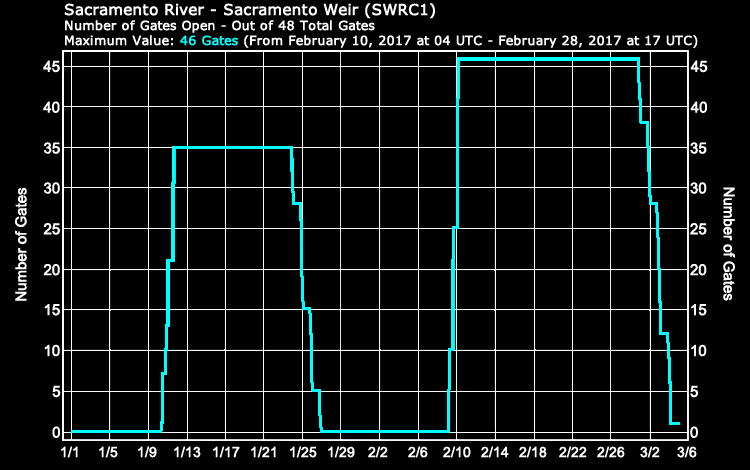
Sacramento Weir The Sacramento Weir was built by the city of Sacramento in 1916, and is currently operated by the California Department of Water Resources (CA DWR) according to regulations established by the US Army Corps of Engineers. According to the CA DWR, the Sacramento Weir is the only operable weir along the Sacramento River with 48 gates used to alleviate flooding potential just downstream of the confluence of the Sacramento and American Rivers near downtown. All other upstream weir structures (Moulton, Colusa, Tisdale, and Fremont) are fixed and divert water into the Butte Basin, Sutter Bypass, and Yolo Bypass. Operation of the Sacramento Weir does not occur until the river reaches 29 feet (NAVD88) at the I Street Bridge with continued rises forecast. At that point, the CA DWR determines how many gates to open. On the morning of January 10, 2017, the first gate on the Sacramento Weir was opened. In all, 35 gates were opened to limit flows in the Sacramento River through the city of Sacramento. The peak stage recorded at the I Street Bridge on January 11, 2017 reached 29.6 feet, much lower than if the Sacramento Weir was never opened. As the first and second wave of heavy precipitation moved out of California, and river levels continued to recede, the first gate on the Sacramento weir was closed on the morning of January 23, 2017 with the last closed on the morning of January 26, 2017 (a 3-day process). The next series of storms to affect the region during February 2017 brought renewed rises along area rivers, including a flood wave moving down the Sacramento River. With forecasts of greater than 29 feet expected at the I Street Bridge, the decision was once again made to open gates on the Sacramento Weir for the second time in 2017. With a larger flood wave expected to impact the city of Sacramento, 46 of the 48 gates were opened with the first gate opened late on February 8, 2017. The 46th gate was opened late on February 9, 2017. Opening up the Sacramento Weir resulted in a muted peak stage at the I Street Bridge, 29.9 feet. After the heavy precipitation of February 2017 passed and the Sacramento River stages continued dropping, the process to close the Sacramento Weir gates began on February 28.
|
|||||||||||||||||||||||||||||||||||||||||||||||||||||||||||||||||||||||||||||||||||||||||||||||||||||||||||||||||||||||||||||||||||||||||||||||||||||||||||||||||||||||||||||||||||||||||||||||||||||||||||||||||||||||||||||||||||||||||||||||||||||||||||||||||||||||||||||||||||||||||||||||||||||||||||||||||||||||||||||||||||||||||||||||||||||||||||||||||||||||||||||||||||||||||||||||||||||||||||||||||||||||||||||||||||||||||||||||||||||||||||||||||||||||||||||||||||||||||||||||||||||||||||||||||||||||||||||||||||||||||||||||||||||||||||||||||||||||||||||||||||||||||||||||||||||||||||||||||||||||||||||||||||||||||||||||||||||||||||||||||||||||||||||||||||||||||||||||||||||||||||||||||||||||||||||||||||||||||||||||||||||||||||||||||||||||||||||||||||||||||||||||||||||||||||||||||||||||||||||||||||||||||||||||||||||||||||||||||||||||||||||||||||||||||||||||||||||||||||||||||||||||||||||||||||||||||||||||||||||||||||||||||||||||||||||||||||||||||
Reservoir Conditions
The warm and moisture-laden series of storms that affected the region during January and February 2017 brought increased inflows to all of the major reservoirs lining the coastal mountains and Sierra Nevada. This was especially true for the first and third storm periods discussed above in the "Weather Synopsis" (January 3-13, 2017 and February 2-12, 2017). As a result, reservoir operators carefully managed reservior releases (outflows) to create enough storage for the influx of runoff, while also attempting to minimize potential downstream flood impacts. Improved decision making mitigated potential flood impacts due to the coordination efforts between reservoir operators, meteorologists, and hydrologists working at numerous federal, state, and local agencies.
The table below contains links to graphs showing the 1) inflow, 2) outflow, and 3) storage/elevation for the major reservoirs across California for the months of January and February 2017. Inflows are either calculated by the operating agency of the reservoir and relayed to our office or calculated locally at our office for use in the CNRFC river models.
Major California Reservoir Data
|
||||
|---|---|---|---|---|
| River | Reservoir | Inflow (cfs) |
Outflow* (cfs) |
Storage / Elevation (Ac-Ft / Ft) |
| Trinity | Trinity | Jan 1 - Feb 28 | Jan 1 - Feb 28 | Jan 1 - Feb 28 |
| Sacramento | Shasta | Jan 1 - Feb 28 | Jan 1 - Feb 28 | Jan 1 - Feb 28 |
| Feather | Oroville | Jan 1 - Feb 28 | Jan 1 - Feb 28 | Jan 1 - Feb 28 |
| North Fork Yuba | New Bullards Bar | Jan 1 - Feb 28 | Jan 1 - Feb 28 | Jan 1 - Feb 28 |
| American | Folsom | Jan 1 - Feb 28 | Jan 1 - Feb 28 | Jan 1 - Feb 28 |
| Stanislaus | New Melones | Jan 1 - Feb 28 | Jan 1 - Feb 28 | Jan 1 - Feb 28 |
| Tuolumne | Don Pedro | -- | Jan 1 - Feb 28 | Jan 1 - Feb 28 |
| Merced | McClure | -- | Jan 1 - Feb 28 | Jan 1 - Feb 28 |
| San Joaquin | Millerton | -- | Jan 1 - Feb 28 | Jan 1 - Feb 28 |
| Kings | Pine Flat | Jan 1 - Feb 28 | Jan 1 - Feb 28 | Jan 1 - Feb 28 |
| Kern | Isabella | Jan 1 - Feb 28 | Jan 1 - Feb 28 | Jan 1 - Feb 28 |
| * Outflow data represent controlled flows from afterbays/complexes. | ||||
Lake Oroville Incident*
The most prominent storyline during the January and February 2017 floods was the Lake Oroville Spillway incident that culminated in the evacuation of nearly 200,000 people living downstream of the lake (maximum storage 3,537,580 acre-feet according to the California Department of Water Resources) across portions of Butte, Sutter, and Yuba counties.
On February 7, with a significant precipitation event expected to impact the region over the next several days, the California Department of Water Resources (CA DWR) increased water releases to make room for the forecast water inflows into Lake Oroville. However, as water releases were increased, an anomaly with the water flow pattern down the flood-control spillway was noticed, and water releases were ceased for investigation of the cause. At this time, the engineers found a large area of concrete erosion on a part of the flood-control spillway.
Beginning the next day, discussions began between the CA DWR, Federal Energy Regulatory Commission (FERC), and other dam safety agencies. Also, a test was peformed by once again increasing water flows down the flood-control spillway to see how much further erosion would take place. Preparations began for the possible use of the emergency spillway, which had never before been utilized in the structure's history.
With the forecasted precipitation coming to fruition, water inflows into Lake Oroville peaked late on February 9 near 190,000 cubic feet per second (cfs). Water flows released from the flood-control spillway were ramped up to 65,000 cfs in an attempt to accomodate the increased water inflows and prevent the lake from filling, including using the emergency spillway.
By February 11, water inflows continued to outpace releases from Lake Oroville, and the lake level surpassed 901 feet, which allowed water to flow freely over the emergency spillway for the first time ever.
Over the next 24 hours, expected erosion began downstream of the emergency spillway. However, erosion near the base of the structure was faster than anticipated. Around 5 PM on Sunday, February 12, the Butte County Sheriff (Kory Honea) and his office issued mandatory evacuations for the Oroville area along with other towns downstream as fears of the failure of the emergency spillway increased. Shortly after, the Yuba County and Sutter County Sheriffs and their offices ordered the evacuations of communities around the Feather River, including: Marysville, Yuba City, Live Oak, and Nicolaus. In an attempt to slow the erosion at the base of the emergency spillway, the CA DWR increased releases down the flood-control spillway to 100,000 cfs. With water inflows continuing to decrease with less precipitation over the area and the increased water releases down the flood-control spillway, the Lake Oroville water elevation dropped below 901 feet late on February 12, bringing an end to water flows over the emergency spillway.
During the next week, inspections and work to repair and reinforce the emergency spillway began. Mandatory evacuations were decreased to an evacuation warning on February 14, allowing residents to return home. Water releases of 100,000 cfs down the damaged flood-control spillway continued into February 16 to draw down the lake level further. A target lake elevation of 850 feet was set. Once water releases were ramped down after February 16, these were held steady between 50,000 and 60,000 cfs to maintain the lake level of 850 feet.
Through the rest of the winter season and spring snow melt, the lake saw only minor rises with flows being regulated using the damaged flood-control spillway and the Hyatt Powerplant facilities. Finally, on May 19, the CA DWR stopped water releases down the flood-control spillway to begin a busy summer of work to repair the structure for potential use during the 2017-2018 winter season. The goal of the CA DWR was to fix the flood-control spillway to handle storms by November 1.
* Information / Data Source: California Department of Water Resources - Oroville Spillways Incident Background
Long-Term Drought Relief
California and Nevada already experienced very minor improvement in the long-term drought conditions due to above-normal precipitation from October through December 2016. However, the previous 5 water years generated an extensive precipitation deficit that resulted in widespread issues including: agricultural, municipal water supplies, urban watering restrictions, and groundwater depletion. Impressively, the heavy precipitation during January and February 2017 provided a significant dent in the long-term drought conditions across the entire area. For California, at the end of December 2016, there was 40.60% of the state in either extreme (D3) or exceptional (D4) drought conditions. In the first Drought Monitor issued after the heavy precipitation (valid March 7, 2017), extreme and exceptional drought was eliminated across California. Also, 82.53% of California was experiencing some level of drought conditions (D0 through D4) at the beginning of 2017. By early March, the areal extent of drought conditions dropped to 23.46%. For Nevada, extreme (D3) and exceptional (D4) drought conditions were far less than its counterpart to the west with 0.18% areal extent. However, for all drought conditions, 66.60% of the state of Nevada was experiencing some level of drought conditions (D0 through D4). After the two months of heavy precipitation, this number dropped to 6.18%. Below are links to a loop of the Drought Monitors issued (weekly every Thursday) from December 27, 2016 through March 7, 2017 for both California and Nevada.
Drought Monitor Loops*
|
|
|---|---|
| State | Weekly Issuances - Categorical (None through D4) |
| California | December 27, 2016 to March 7, 2017 |
| Nevada | December 27, 2016 to March 7, 2017 |
| * Drought Monitor imagery courtesy: National Drought Mitigation Center (University of Nebraska-Lincoln). | |
Hydrology YouTube Videos*
|
||
|---|---|---|
| Location | Description | Date of Video |
| Nimbus Dam | Nimbus Dam releasing 80,000 cfs into the American River | February 10, 2017 |
| North Fork Dam | Approximately 7,600 cfs flowing over North Fork Dam on North Fork American River near Auburn, CA | January 12, 2017 |
| Sacramento Weir (Upstream) | Upstream view of Sacramento Weir with 35 of 48 gates open on weir | January 11, 2017 |
| Sacramento Weir (Downstream) | Downstream view of Sacramento Weir with 35 of 48 gates open on weir | January 11, 2017 |
| Folsom Dam | Folsom Dam Releasing 60,000 cfs into the American River | January 11, 2017 |
| * Videos courtesy California-Nevada River Forecast Center staff. | ||
| Title | Author |
|---|---|
| Oroville Spillways Incident Background | CA Department of Water Resources |
| NOAA on the Front Lines During California's Epic Winter | National Oceanic and Atmospheric Administration |
 Topography |  Topography/USGS |  Shaded Relief |  Imagery |  Nat'l Geographic | 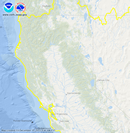 Topo/Rivers | 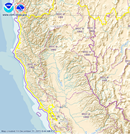 Hydrology | 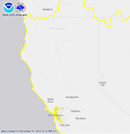 Light Gray |