Heavy Precipitation Event Navigation: General Summary | Precipitation | Weather Synopsis | Hydrologic Impacts With the spring of 2005 already being able to claim a rather active weather pattern, the last in a series of storms generated a prolonged period of late season precipitation. Although intensities of the precipitation were never excessive, the longevity of the event over a 72-hour period helped generate impressive totals across northern California. Rivers rose dramatically as runoff from the rainfall was added to an already melting snowpack. Above normal inflows into reservoirs resulted in increased releases from area dams to ensure enough storage capacity for all of this water. Although this storm was not associated with widespread catastrophic flooding, it was memorable for its intensity so late in the season and largely responsible for making the month of May the wettest on record for portions of northern California. [ Click here for an interactive map of precipitation from this event ] This unseasonably strong late season storm brought a prolonged period of precipitation to northern California (generally north of Interstate 80). Storm totals across the northern California coastal ranges, Shasta Lake drainage, and northern Sierra Nevada generally ranged from 2 to 5 inches. However, a few locations even surpassed these totals with the Feather River basin taking the top spot with amounts between 5 and 10 inches. These precipitation amounts would be rather impressive for a mid-winter storm, but for these totals to be recorded so late in the season is what made this heavy precipitation event much more noteworthy. The following table pinpoints some of the higher 72-hour totals across the region.
Provided in the table below are links to gage map images showing storm total precipitation for the period from 5 AM PDT Tuesday, May 17th through 5 AM PDT Friday, May 20th (72-hour or 3-day totals).
The next table below displays gridded observed precipitation for the same period but divided into daily totals (5 AM - 5 AM).
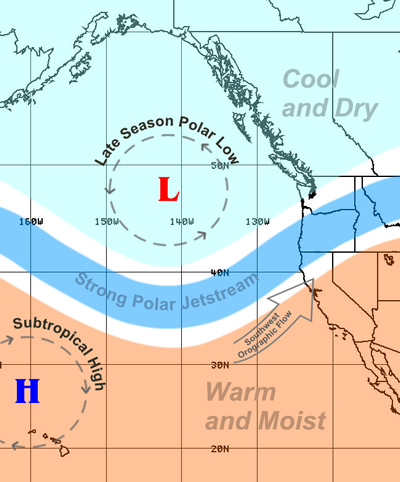
Ingredients across the eastern Pacific set up for a late season wet pattern from May 17-19, 2005. An unseasonably-deep upper low developed near 50N/150W with plenty of cold air entrained into the circulation. Farther south, a rather strong subtropical high situated itself just to the northwest of the Hawaiian Islands. This generated a rather tight temperature gradient between cool dry air to the north and warm moist air to the south. In between, mainly along 40N, this increasing gradient strengthened the polar jetstream (one that would be formidable for a winter month). In fact, a GOES High Density Wind analysis on Tuesday morning indicated the possibility of a 200+ knot core to this jetstream over the eastern Pacific. This jetstream focused its energy across southwest Oregon and northern California as it nosed over the coastline, and moved northeast toward the northern Rockies. Also, plenty of subtropical moisture played a key role in the amount of precipitation experienced across the region. A large plume of subtropical moisture on the order of 1.0 to 1.5 inches of precipitable water streamed east-northeast toward northern California, reaching the coast on Tuesday. These values across the region ranged from 125 to 250 percent of normal for this time of year! Finally, orographic mid-level flow backing from the west to the southwest strenghtened across the region. 700 mb winds peaked well over 50 knots on Wednesday and slammed into the southern Oregon/northern California coastal ranges, Shasta area, and northern Sierra Nevada. This additional lift took advantage of the copious amount of moisture, and generated impressive precipitation amounts over the higher terrain of southwest Oregon and northern California. A schematic of this weather pattern is below (Figure 1).
Figure 1. General weather pattern affecting northern California May 17-19, 2005 This pattern remained quasi-stationary through Wednesday and even lingered across the northern Sierra into Thursday. Warm moist air continued to stream into the area, keeping snow levels rather high and generating a decent amount of runoff from the persistent rainfall and melting snowpack. By the end of the day on Thursday, the upper jetstream lifted to the north while the plume of subtropical moisture slowly sagged south. Also, orographic mid-level flow weakened considerably. This disconnect decreased precipitation in both intensity and coverage. Weather prediction models did an excellent job of depicting the overall pattern change well in advance, which provided valuable lead time to reservoir operators to prepare for the event. The GFS and the ECMWF displayed very good agreement leading up to the event, although the GFS initially was indicating a deeper wetter system that also included central California as the focus of heavy precipitation. As the event drew closer, the GFS resolved an initial shortwave trough with high precipitable water content moving into northern and central California Sunday into Monday, May 15-16, that did extend moderate precipitation deep into central California, including the entire length of the Sierra Nevada. By this time, the models correctly indicated that the focus of the main event of May 17-19 would shift back to the north and target the major reservoirs of northern California with moderate to heavy precipitation and high snow levels. As this late season system took shape over the eastern Pacific, numerous comparisons were made to an event that took place between May 15-16, 1996. The Satellite Analysis Branch, which is part of NESDIS, stated in several discussions about the similarities that existed with historical satellite data. That event generated at least 2.0 inches of precipitation over northern California coastal ranges, and 4.7 inches to orographically favored areas of the northern Sierra in a 24-hour period. The satellite imagery loops provided below indicate the synoptic features setting up for this heavy precipitation event. The Water Vapor loop shows the developing polar upper low well off the Oregon coast and plenty of upper level moisture streaming toward the southern Oregon and northern California coast being focused by the upper jetstream. The Infrared loop depicts the warm topped clouds moving into the southern Oregon and northern California coast, which shows the likelihood of dominant warm rain processes within the clouds. Also, the cold air behind the main system (cellular cloud pattern) over the eastern Pacific points to a rather tight temperature graident between the two airmasses and strong jetstream in between. Finally, the Precipitable Water loop indicates a large influx of subtropical moisture into the region from the south and west. PW values at their maximum were just over 1.5 inches and possibly higher well offshore.
Below are upper air and surface analysis loops created from images provided by the Climate Diagnostics Center. The loops are every 6 hours for the May 17 - 20, 2005 period. The 500 MB loop provides a view of the late season deep upper low over the eastern Pacific and the subtropical high near the Hawaiian Islands, which increased the temperature gradient between the two airmasses. The 850 MB windspeed loop displays the low level southwest wind pattern that produced the strong orographic lifting along northern California coastal ranges, Shasta Lake drainage, and northern Sierra Nevada. The 300 MB windspeed loop shows the existence of a strong upper jetstream along 40N moving across southern Oregon and northern California, providing additional lift. The wind speeds shown in the images are displayed in meters per second (m/s). To convert to miles per hour, multiply by 2.2.
Upper air soundings (radiosondes) display the vertical profile of winds, temperature (plotted in red), and dew point temperature (plotted in blue) at Medford, Oregon and Oakland, California during the May 17-20 storm period.
Included in the table below are more detailed soundings from Medford and Oakland, taken from 5 PM PDT Tuesday, May 17 through 5 AM PDT Thursday, May 19. These provide additional information during the heaviest rainfall period of the event. Some items to note on the soundings include:
With the spring snowmelt already in full swing across the region and the additional runoff from several inches of rainfall into the river basins above area reservoirs, particular concern was given to inflows into Shasta and Folsom Lakes. Already approaching their storage capacity, increased releases were necessary to make room for the additional inflow to these reservoirs. The following hydrographs highlight the balance of inflow and releases to maintain adequate storage space in the reservoirs and avoid downstream flooding.
Although storage capacity at Lake Oroville did not become an issue during this event, reservoir inflows became quite impressive given the 5 to 10 inches that fell over the Feather River basin. On Thursday, May 19, 2005 inflows topped out just over 70,000 cfs! With plenty of storage remaining in the reservoir, releases remained rather low with the lake elevation rising approximately 20 feet (approximately 200,000 acre-feet) in one week. The following hydrographs reflect this information.
The prolonged period of moderate precipitation over the Eel River basin brought the forecast point at Fernbridge to its monitor stage on Thursday, May 19, 2005. This rise on the river was quite impressive as the stage of near 3 feet and 7,000 cfs earlier in the week jumped quickly to 14 feet and almost 87,000 cfs. A combination of unseasonably high precipitation amounts generating higher flowing creeks throughout the upper Sacramento Valley and increased releases of water from Shasta Dam resulted in a significant late season rise along the Sacramento River system. The only forecast point to go above flood stage was Tehama Bridge (TEHC1), however several other points rose above their monitor stage. Also, late season overflow took place at several weirs; including Colusa Weir, Tisdale Weir, and Fremont Weir. Finally, the water flowing down the Sacramento River (Along Garden Highway Photo 1 , Along Garden Highway Photo 2) and contributions from the American River brought the I Street Bridge stage near downtown Sacramento within 2 feet of its 25.0 foot monitor stage (the highest the river had been in quite a while). This caused minor flooding in Discovery Park (Bike Trail Photo 1 , Bike Trail Photo 2) near the confluence of the Sacramento and American Rivers. Increased releases of water from Folsom Dam resulted in a significant rise and fast moving flow down the American River through the Sacramento area. In fact, one swift water rescue was performed along the American River near Bradshaw Road on Thursday, May 19, 2005. Also of note were the flows on the Yuba River coming out of the northern Sierra Nevada. Englebright Lake filled and water began to flow over the uncontrolled spillway. Flows downstream at Smartville topped out near 42,000 cfs and at Marysville near 53,000 cfs. Below are links to unofficial hydrographs for points of interest across northern California during this heavy rainfall event. |
|||||||||||||||||||||||||||||||||||||||||||||||||||||||||||||||||||||||||||||||||||||||||||||||||||