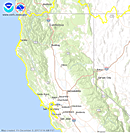
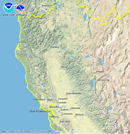
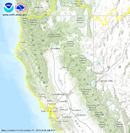
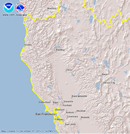
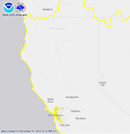
Precipitation Summary for Nov-Dec 2012 Storms - Interactive Map Interface | ||||||||||||||||||||
  |
Data SelectionOptionsGridded data opacity:
| |||||||||||||||||||
|
Note 1 About Product: |
This product contains data that has been quality controlled by CNRFC staff. Some values have been estimated when needed. |
|
Note 2 About Product: |
Some precipitation gages may be hidden at zoomed out levels of the map due to a large amount of data being represented. Zoom closer to view all relevant data in specific area of interest. |
|
Alternate Text Product: |
Precipitation Table | Precipitation Data (Tab-Delimited Format) | Quality Codes for Tab-Delimited File |
|
Feedback / Comments: |
Email the CNRFC Webmaster with your feedback and comments. |