|
Heavy Precipitation Events Navigation: General Summary | Precipitation | Weather Synopsis | Hydrologic Impacts | Verification Note: This storm summary will focus on the storms in late December 2022 into January 2023, while the active pattern from late February through March 2023 is covered in Section 2, as a separate storm summary webpage. Information in this document is considered current as of January 3, 2024. Also, the CNRFC published an ArcGIS StoryMap reviewing the historic 2023 Water Year. To access this ArcGIS StoryMap, please visit this link here. The 2023 Water Year, in particular the period from late December through the first half of January, and then again from late February through March, brought historical precipitation and snowpack conditions to parts of California and Nevada. Many of the storm systems were characterized by cool temperatures and low snow levels, brought on by numerous moist and strong low pressure systems, including over a dozen Atmospheric Rivers (also referred to as ARs) and three bomb cyclones (a rapidly developing area of low pressure where the atmospheric pressure drops at least 24 millibars over a 24-hour period) during the period from December 2022 through March 2023. The images below, courtesy of the Center for Western Weather and Water Extremes (CW3E), show where each of these ARs made landfall along the west coast and their strength determined using Integrated Water Vapor Transport (IVT). The image on the left covers the period from December 27, 2022, through January 17, 2023. The image on the right covers the period from February 25, 2023, through March 31, 2023. To expand each image in a new tab, click on each image. 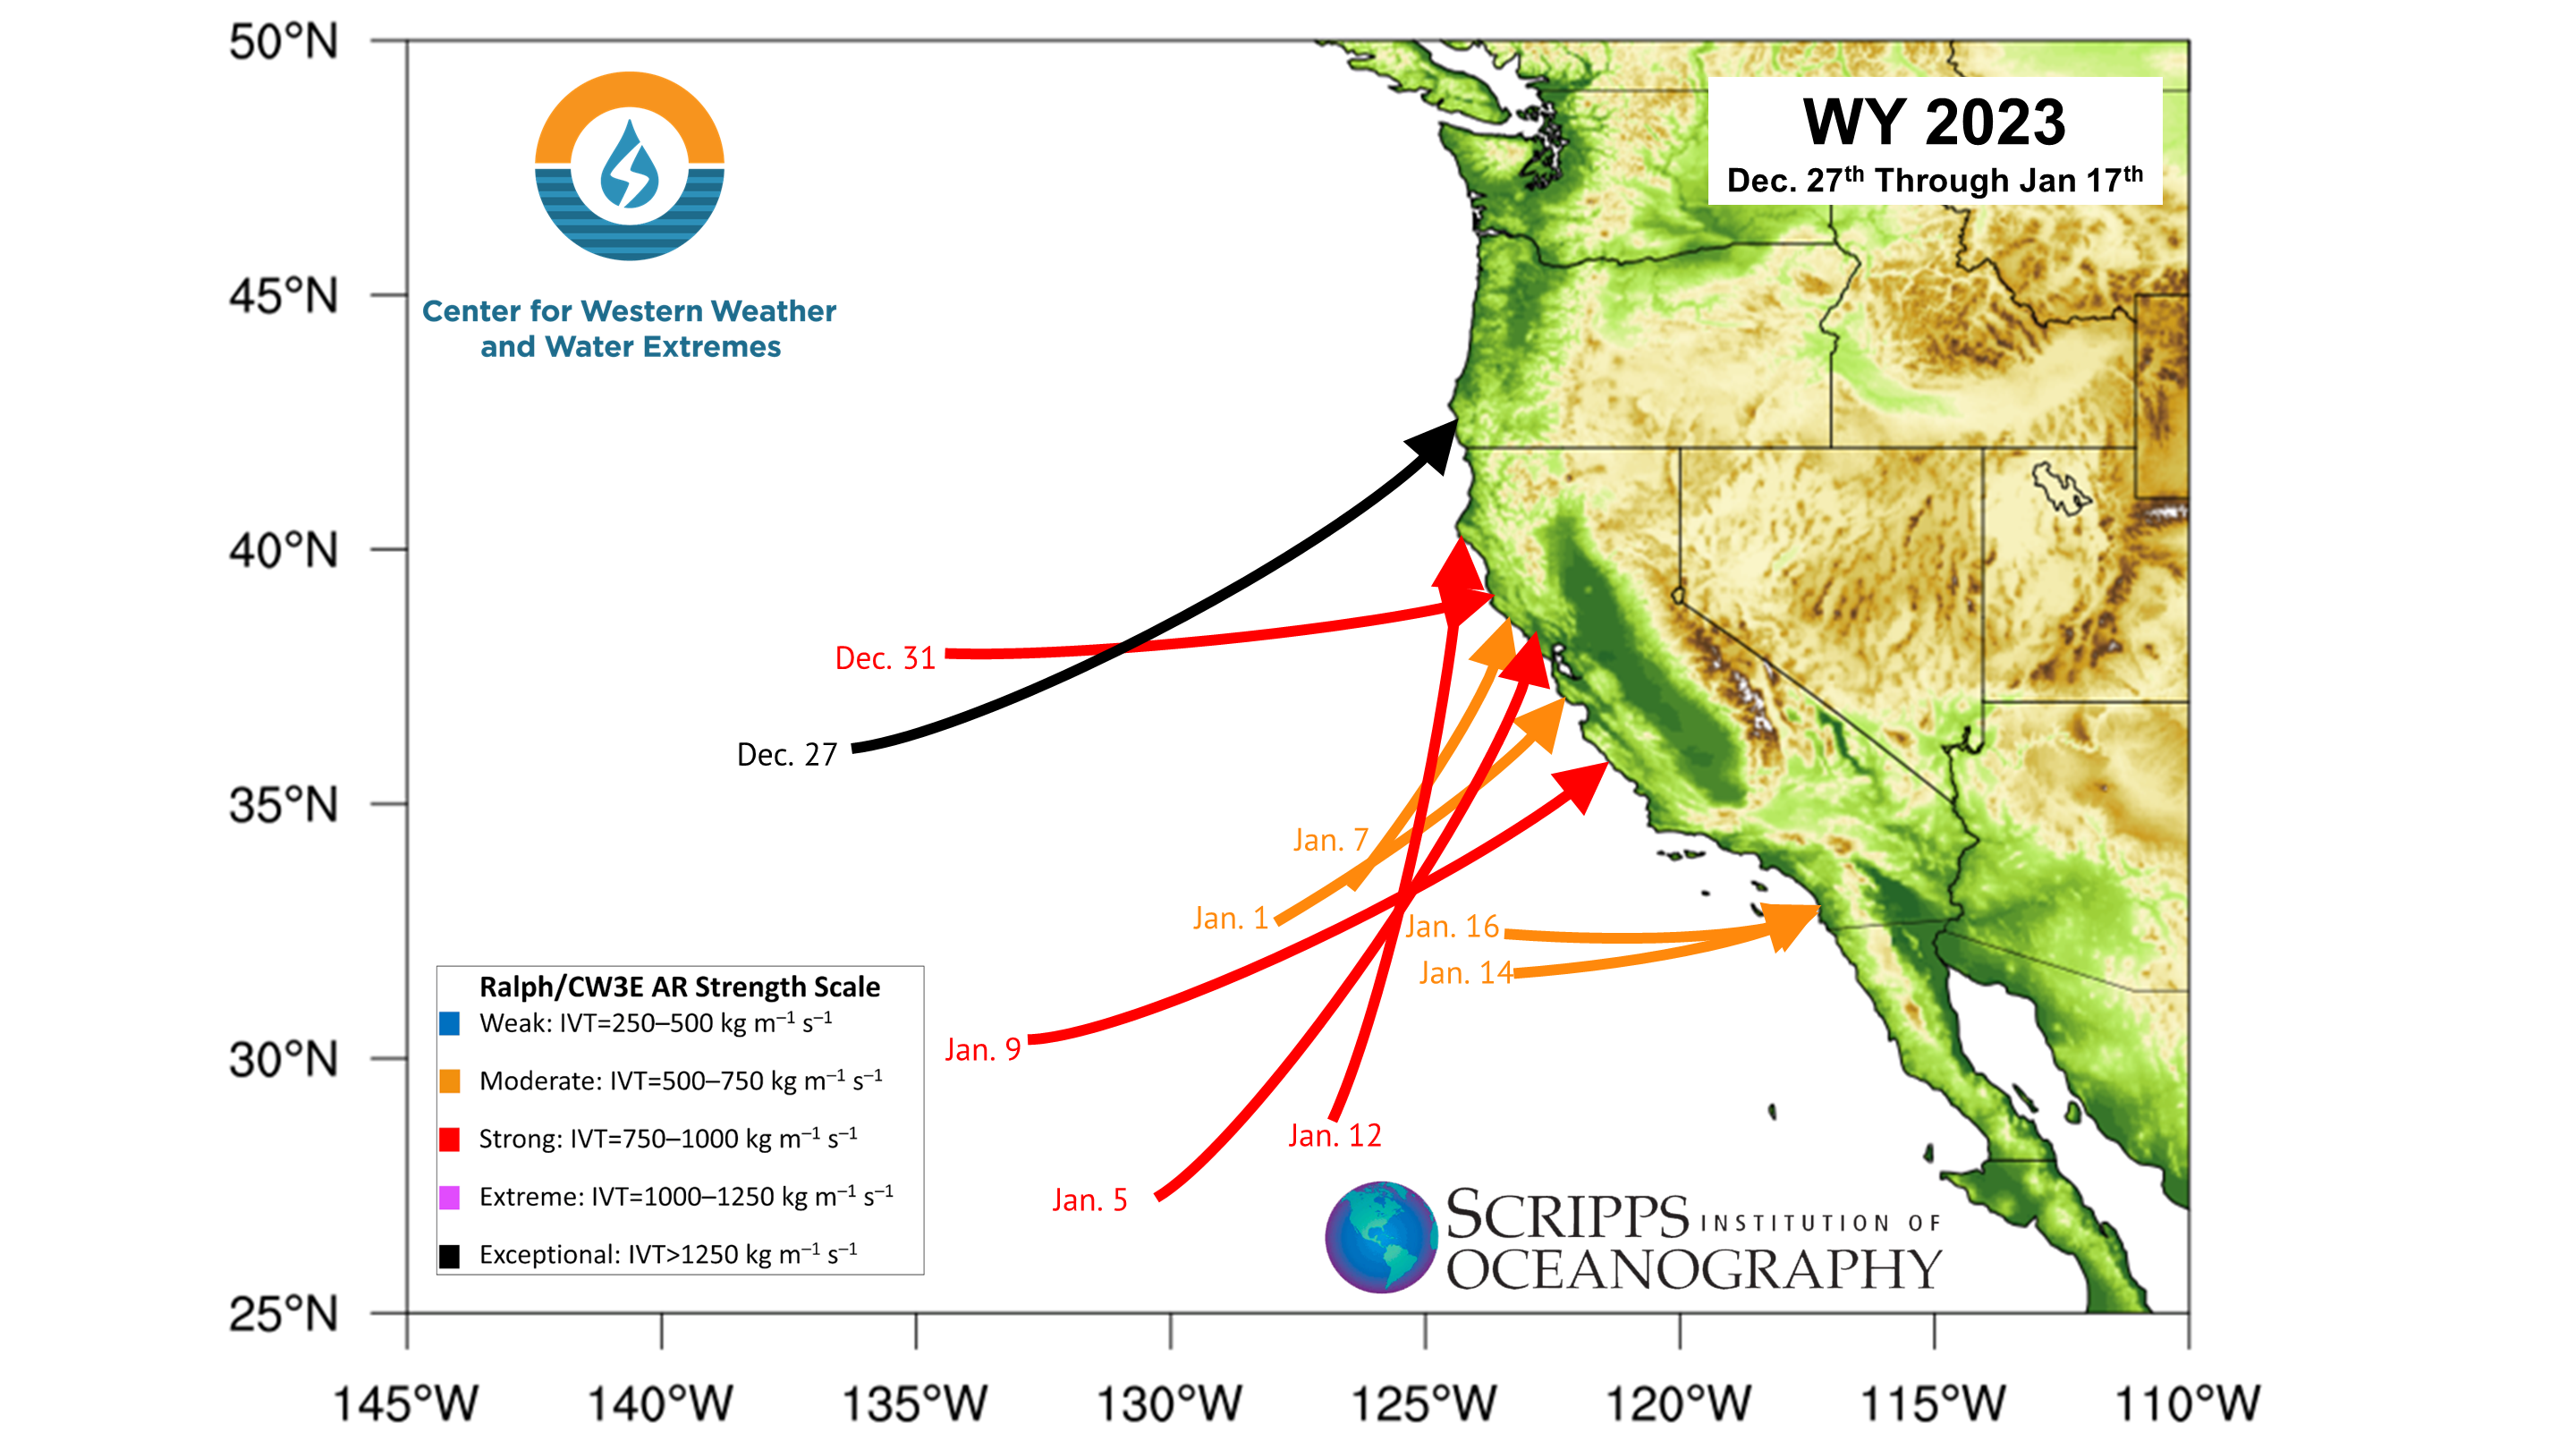 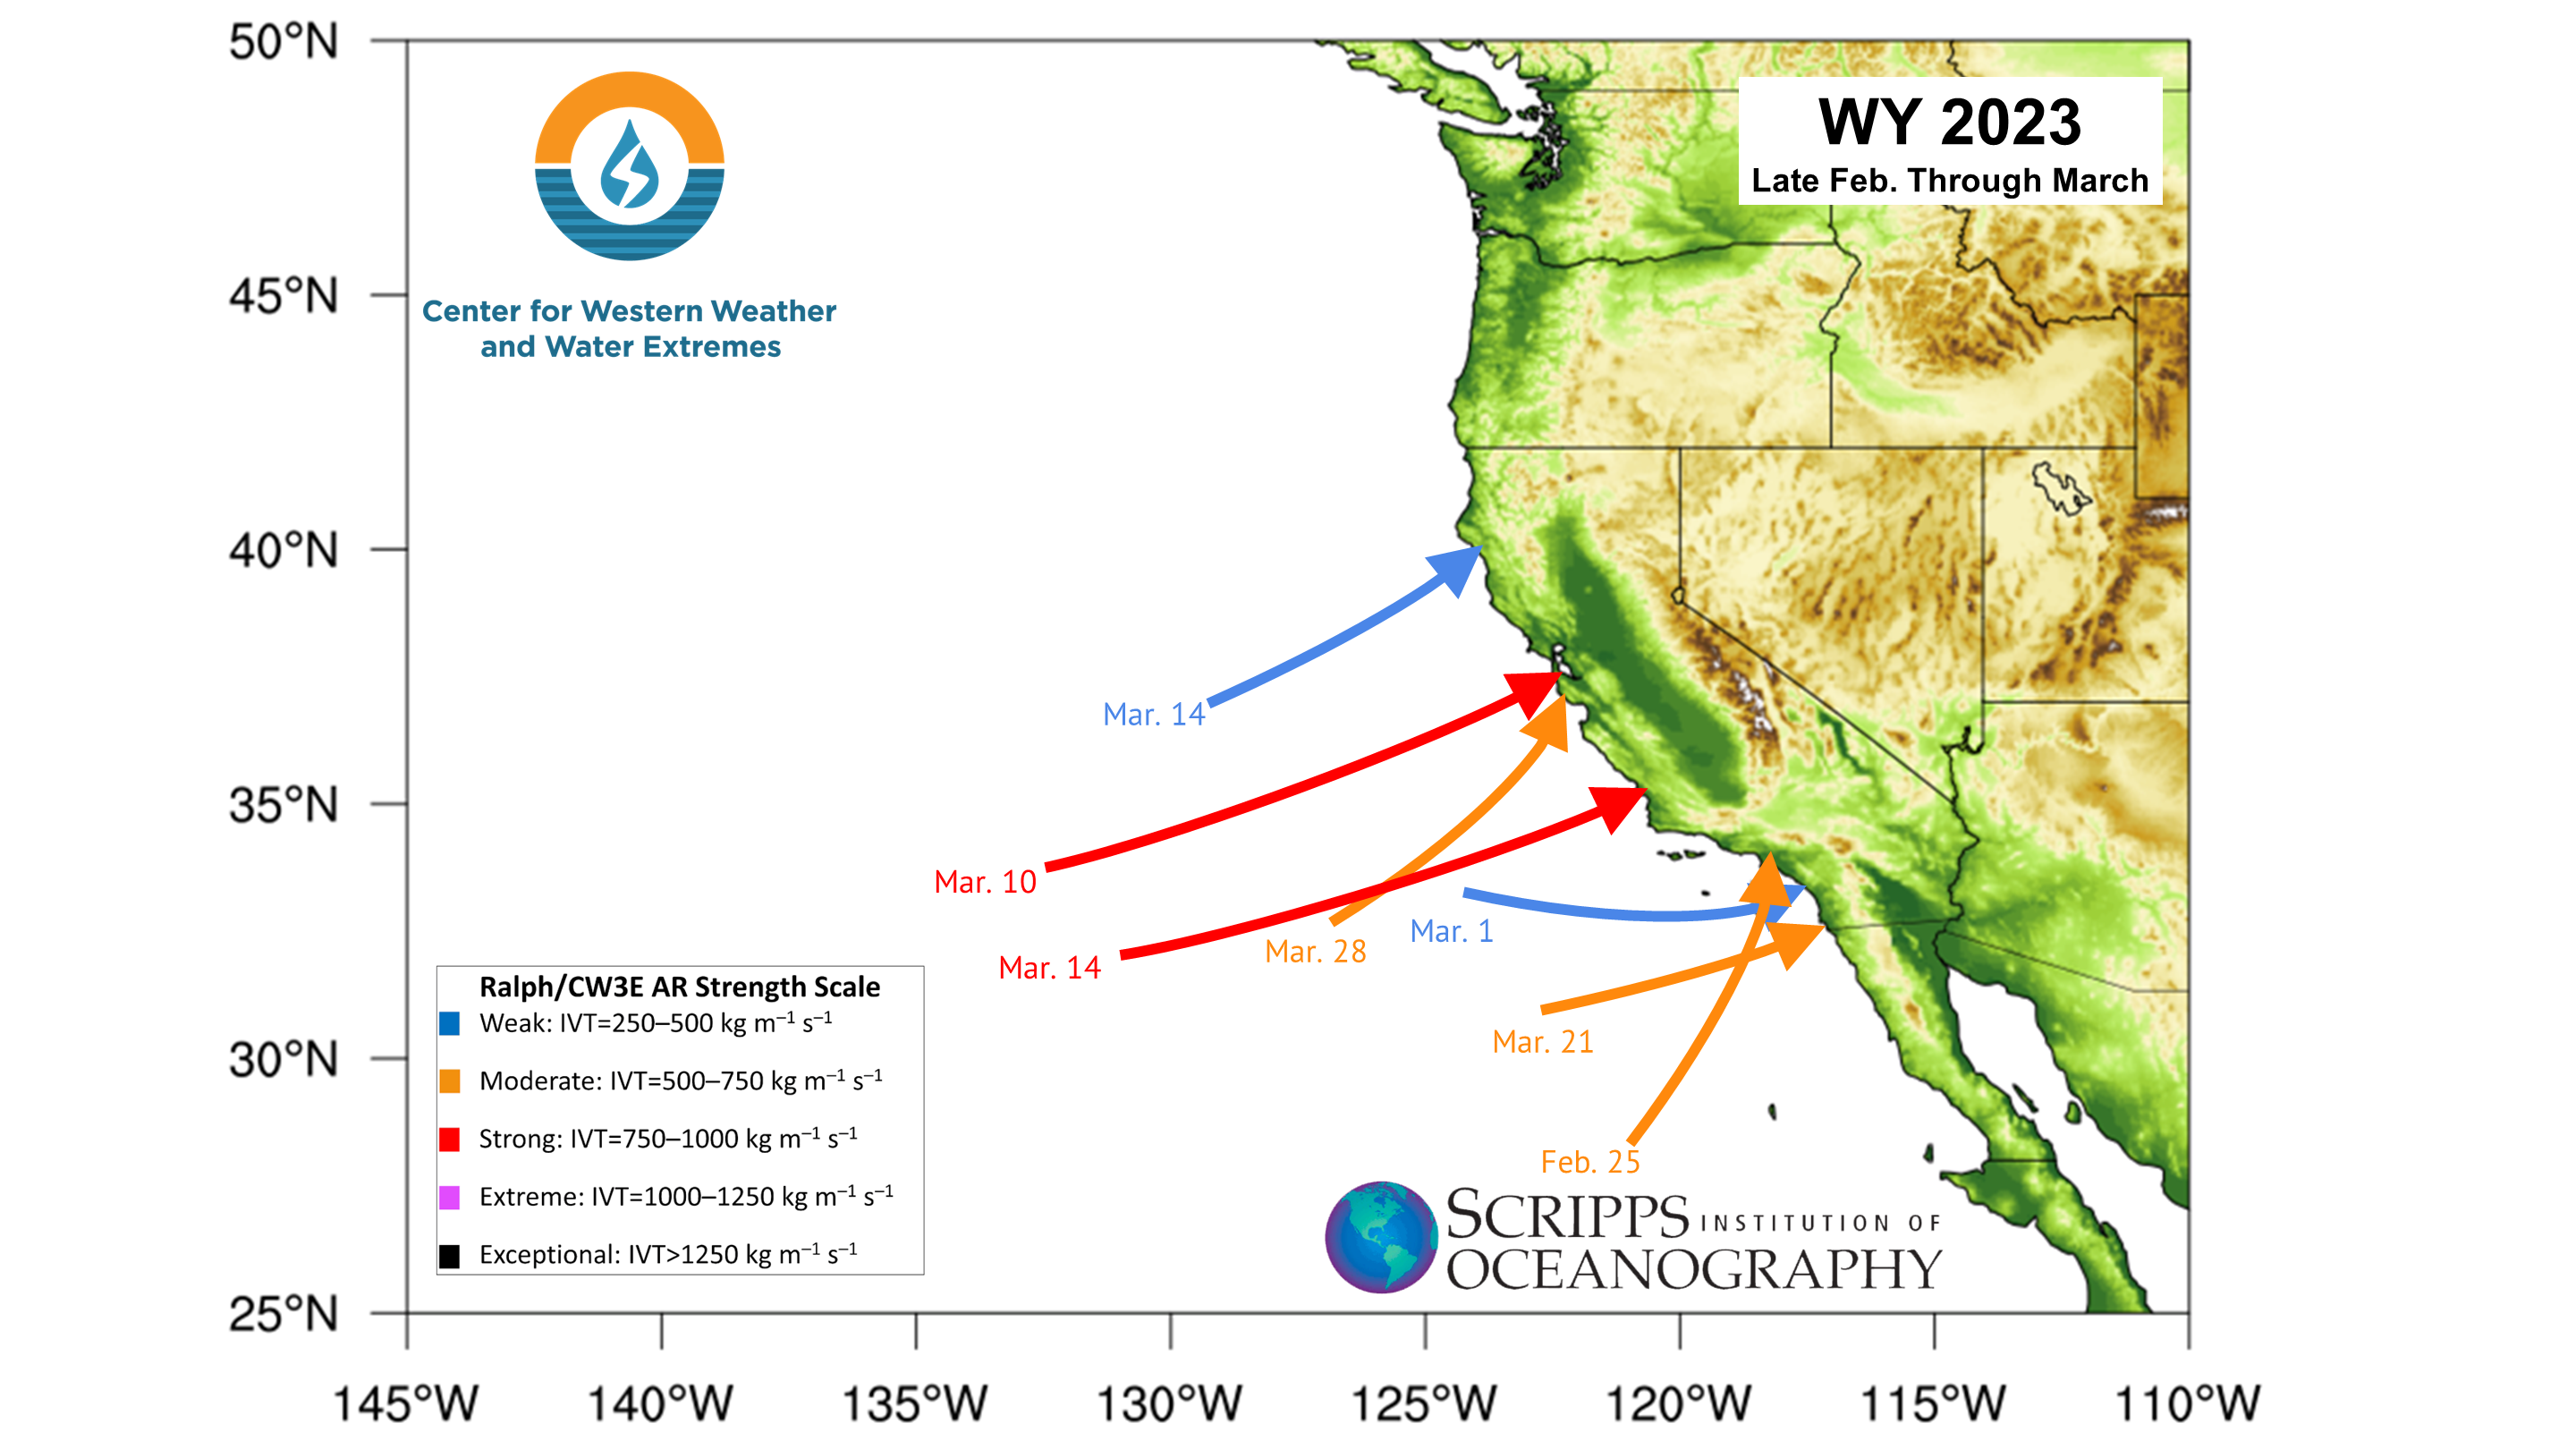 From December 2022 through March 2023, almost all of California and Nevada saw above-normal precipitation, with the most anomalous amounts primarily falling across central CA into central NV. The image below from the Western Regional Climate Center (WRCC) depicts a gridded ranking using PRISM data for the four-month period from December 2022 through March 2023. The period of record is from 1895 through 2023 and shows many locations ranking as either the "Record Wettest" or falling in the "Much Above Normal" Top-10 Percentile. Click on the image below to expand and open in a new tab. 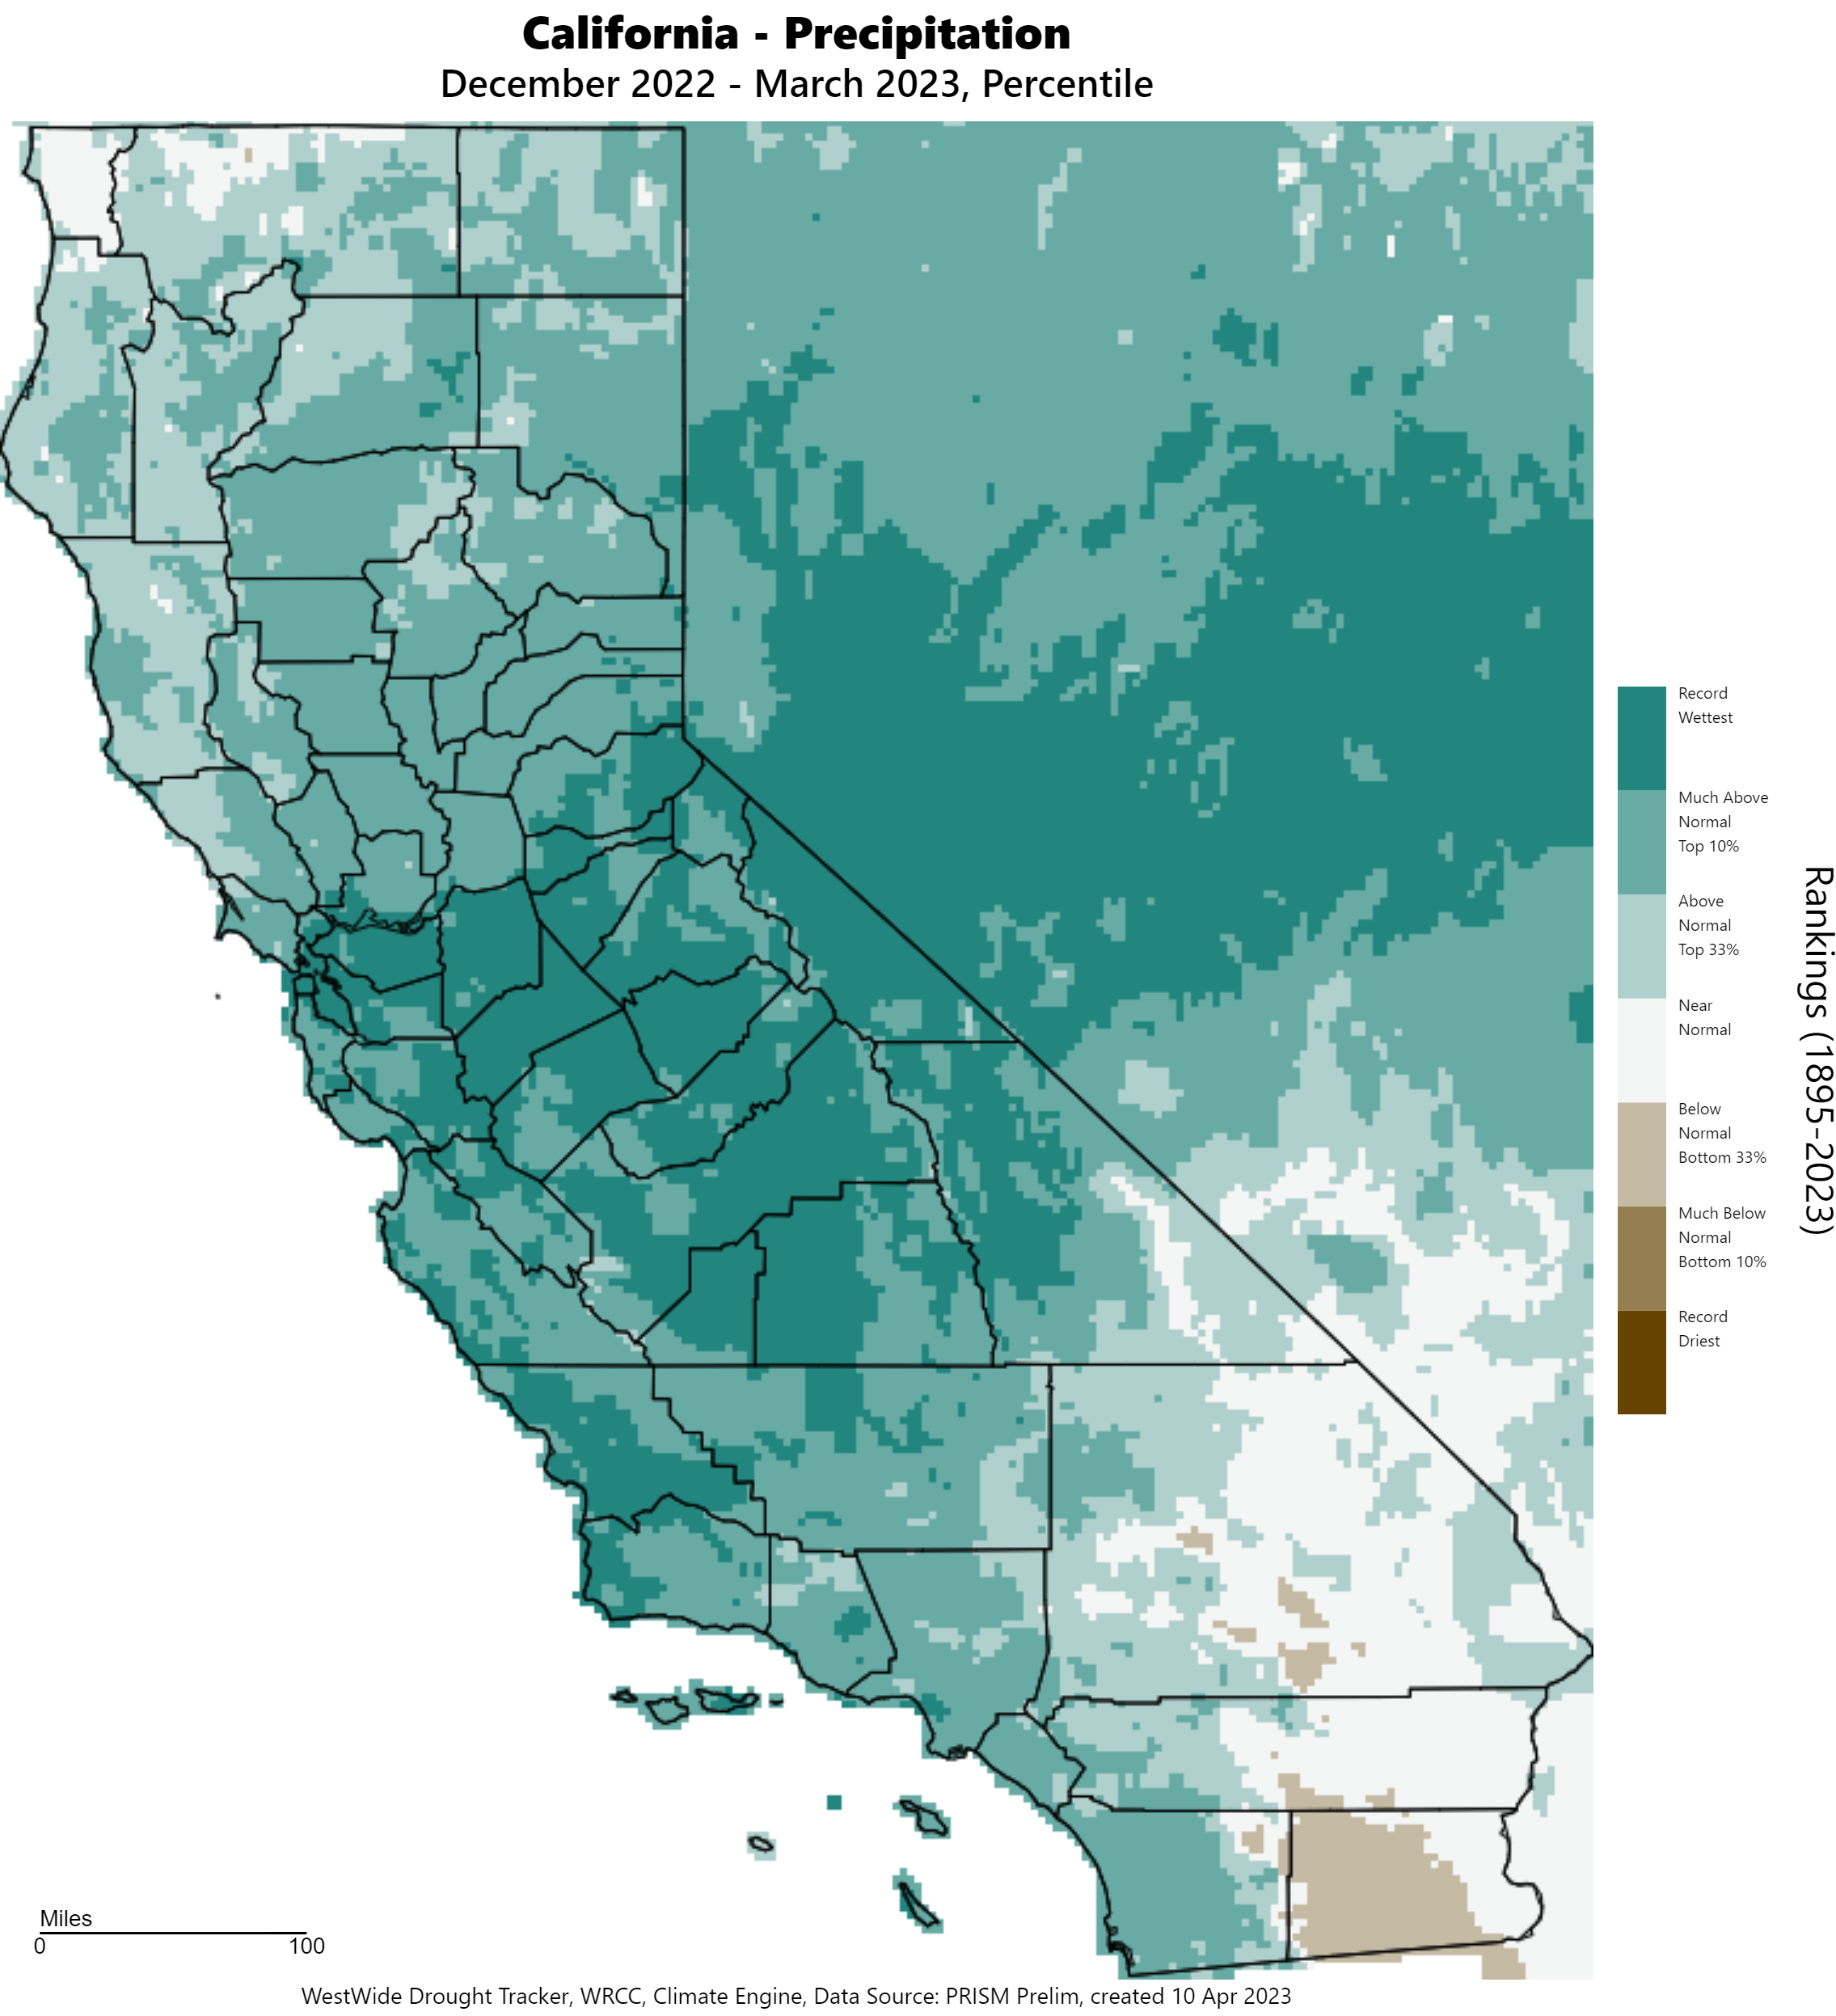 According to the NOAA National Centers for Environmental Information (NCEI) "Climate at a Glance", California saw the 7th-wettest December through March since 1895, while Nevada was the 3rd wettest. Precipitation was above average for California in December 2022 (ranking 17th-wettest out of 128 years [1895-2022]) and much above average for Nevada (ranking 8th wettest out of 128 years). In January and March 2023, much above average precipitation fell over California and Nevada, with January precipitation ranking 10th wettest for CA and 12th wettest for NV (out of 129 years). For March, California was 7th wettest since 1895, and Nevada was 6th wettest. Numerous precipitation records were tied or broken at Global Historical Climatology Network (GHCN) stations with the precipitation in December 2022 (267 daily records in CA and 121 in NV) and March 2023 (265 daily records in CA and 112 in NV). With this anomalously-high precipitation, drought impacts decreased this winter. The entire state of California was in a drought (100% in D0-D4) on December 6, 2022, improving to 34% in drought (D0 (abnormally dry) - D1 (moderate drought)) mainly across far Nrn CA and SE CA on April 11, 2023. Nevada was also in a drought in December 2022 (100% D0-D3) and improved to drought (D0-D2) in only 67% of the area on April 11, 2023, with almost 3% in D2 (Severe Drought) in Clark County, NV. Below are images of the US Drought Monitor showing the improvement in drought conditions across both California and Nevada. The U.S. Drought Monitor is created by a team of meteorologists and climatologists from the National Drought Mitigation Center at the University of Nebraska-Lincoln, NOAA, and the U.S. Department of Agriculture. Click on each image below to expand and open in a new tab. 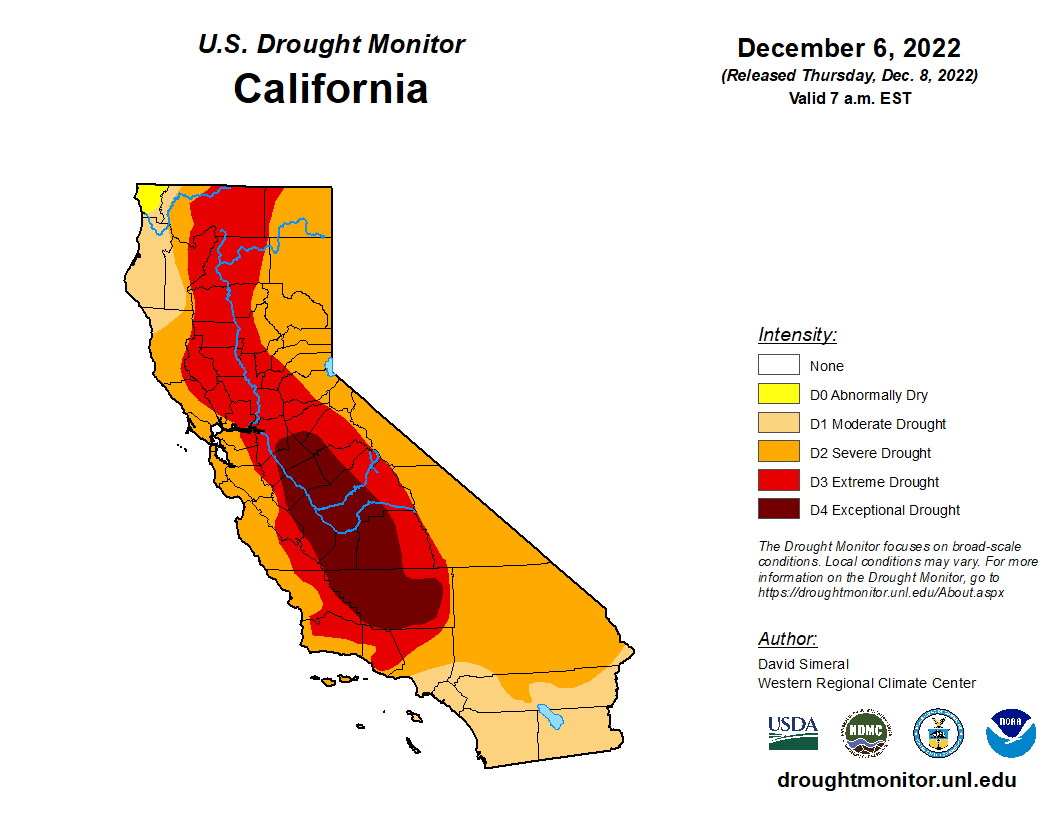 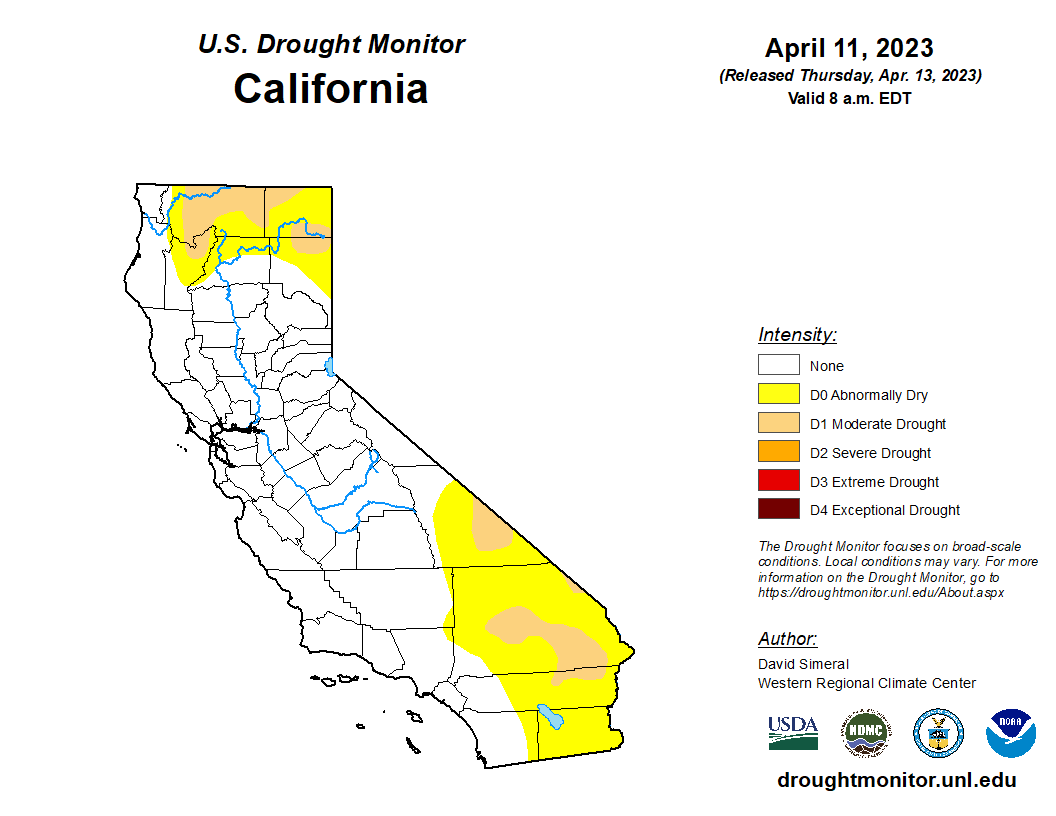 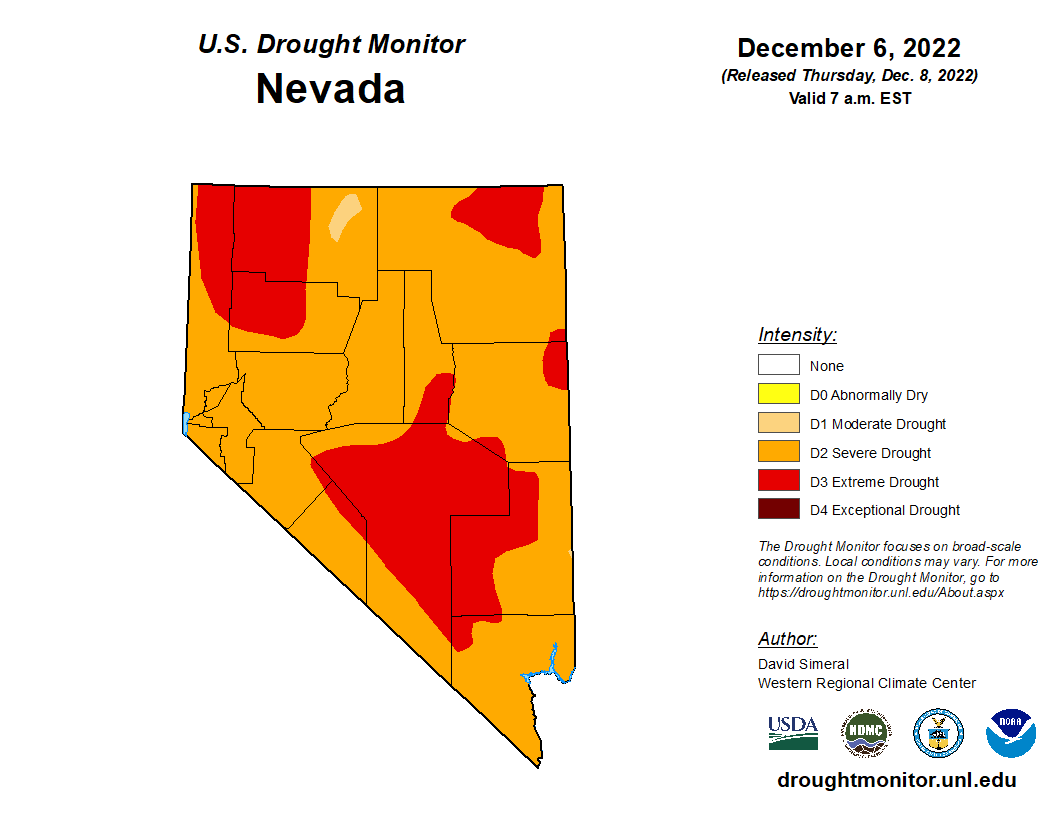 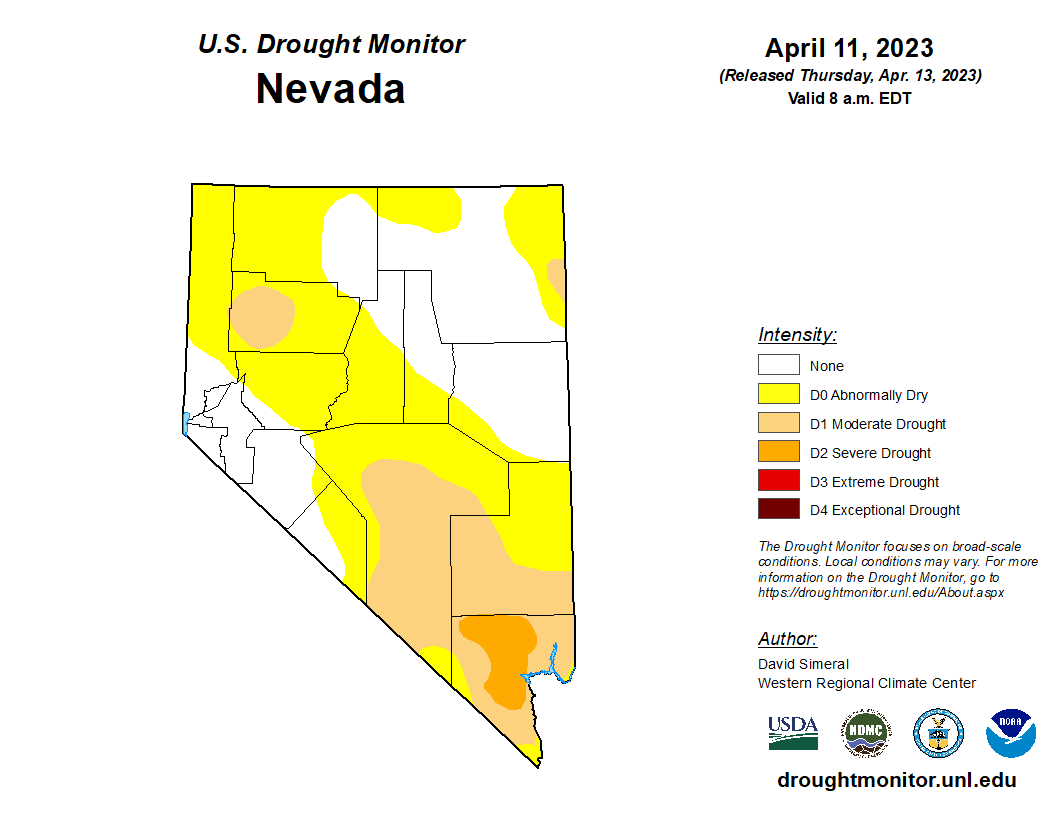 The Snow Water Equivalent (SWE) increased dramatically from December 2022 through March 2023, with the California statewide average Snow Water Equivalent increasing from 3.2” (106% of normal for the date) on December 1, 2022, to 61.1” (236% of normal for date) on March 31, 2023 (according to the California Cooperative Snow Surveys). The snow amounts compared to normal increased from north (191%) to south (294%). The northern Sierra had 3” (104% of normal for the date) on December 1, 2022, and increased to 57” (191% of normal for the date) on March 31, 2023. The central Sierra had 3.3” (100% of normal for the date) on December 1, 2022, and 62.5” (235% of normal for the date) on March 31, 2023. The southern Sierra had 3.1” (123% of normal for the date) on December 1, 2022, and 62.5” (294% of normal for the date) on March 31, 2023. The central and southern Sierra saw their highest-ever snow water content around March 31, 2023. In the last week of February (2/24-3/1), 8-12' of snow fell over the higher elevations. The snowpack at lower elevations was also significant throughout CA. For the season, Blue Canyon, elevation 5,280' along Interstate 80, accumulated 42" of SWE, which is the second-highest SWE accumulation at this location in the last 50 years. Abundant and heavy snow caused avalanches (10 between 1/10/23-3/29/23), snow loading on roofs, power outages, and lengthy road closures. Lower elevations also saw snow accumulations, with snow levels dropping as low as around 500 feet with the colder storms at the end of February. The image below shows a trace of the California statewide snowpack throughout the 2022-2023 Water Year, peaking near or just after April 1, 2023, which is when the snowpack in California typically peaks.  December through March was cool, with nearly the entire region seeing below-average temperatures, and numerous daily minimum and low-maximum temperatures records being tied or broken. The image below from the Western Regional Climate Center (WRCC) depicts a gridded ranking using PRISM data for the four-month period from December 2022 through March 2023. The period of record is from 1895 through 2023 and shows almost the entire states of California and Nevada at least in the "Bottom 33%", with a smaller subset in the "Bottom 10%" and even "Record Coldest". Click on the image below to expand and open in a new tab. 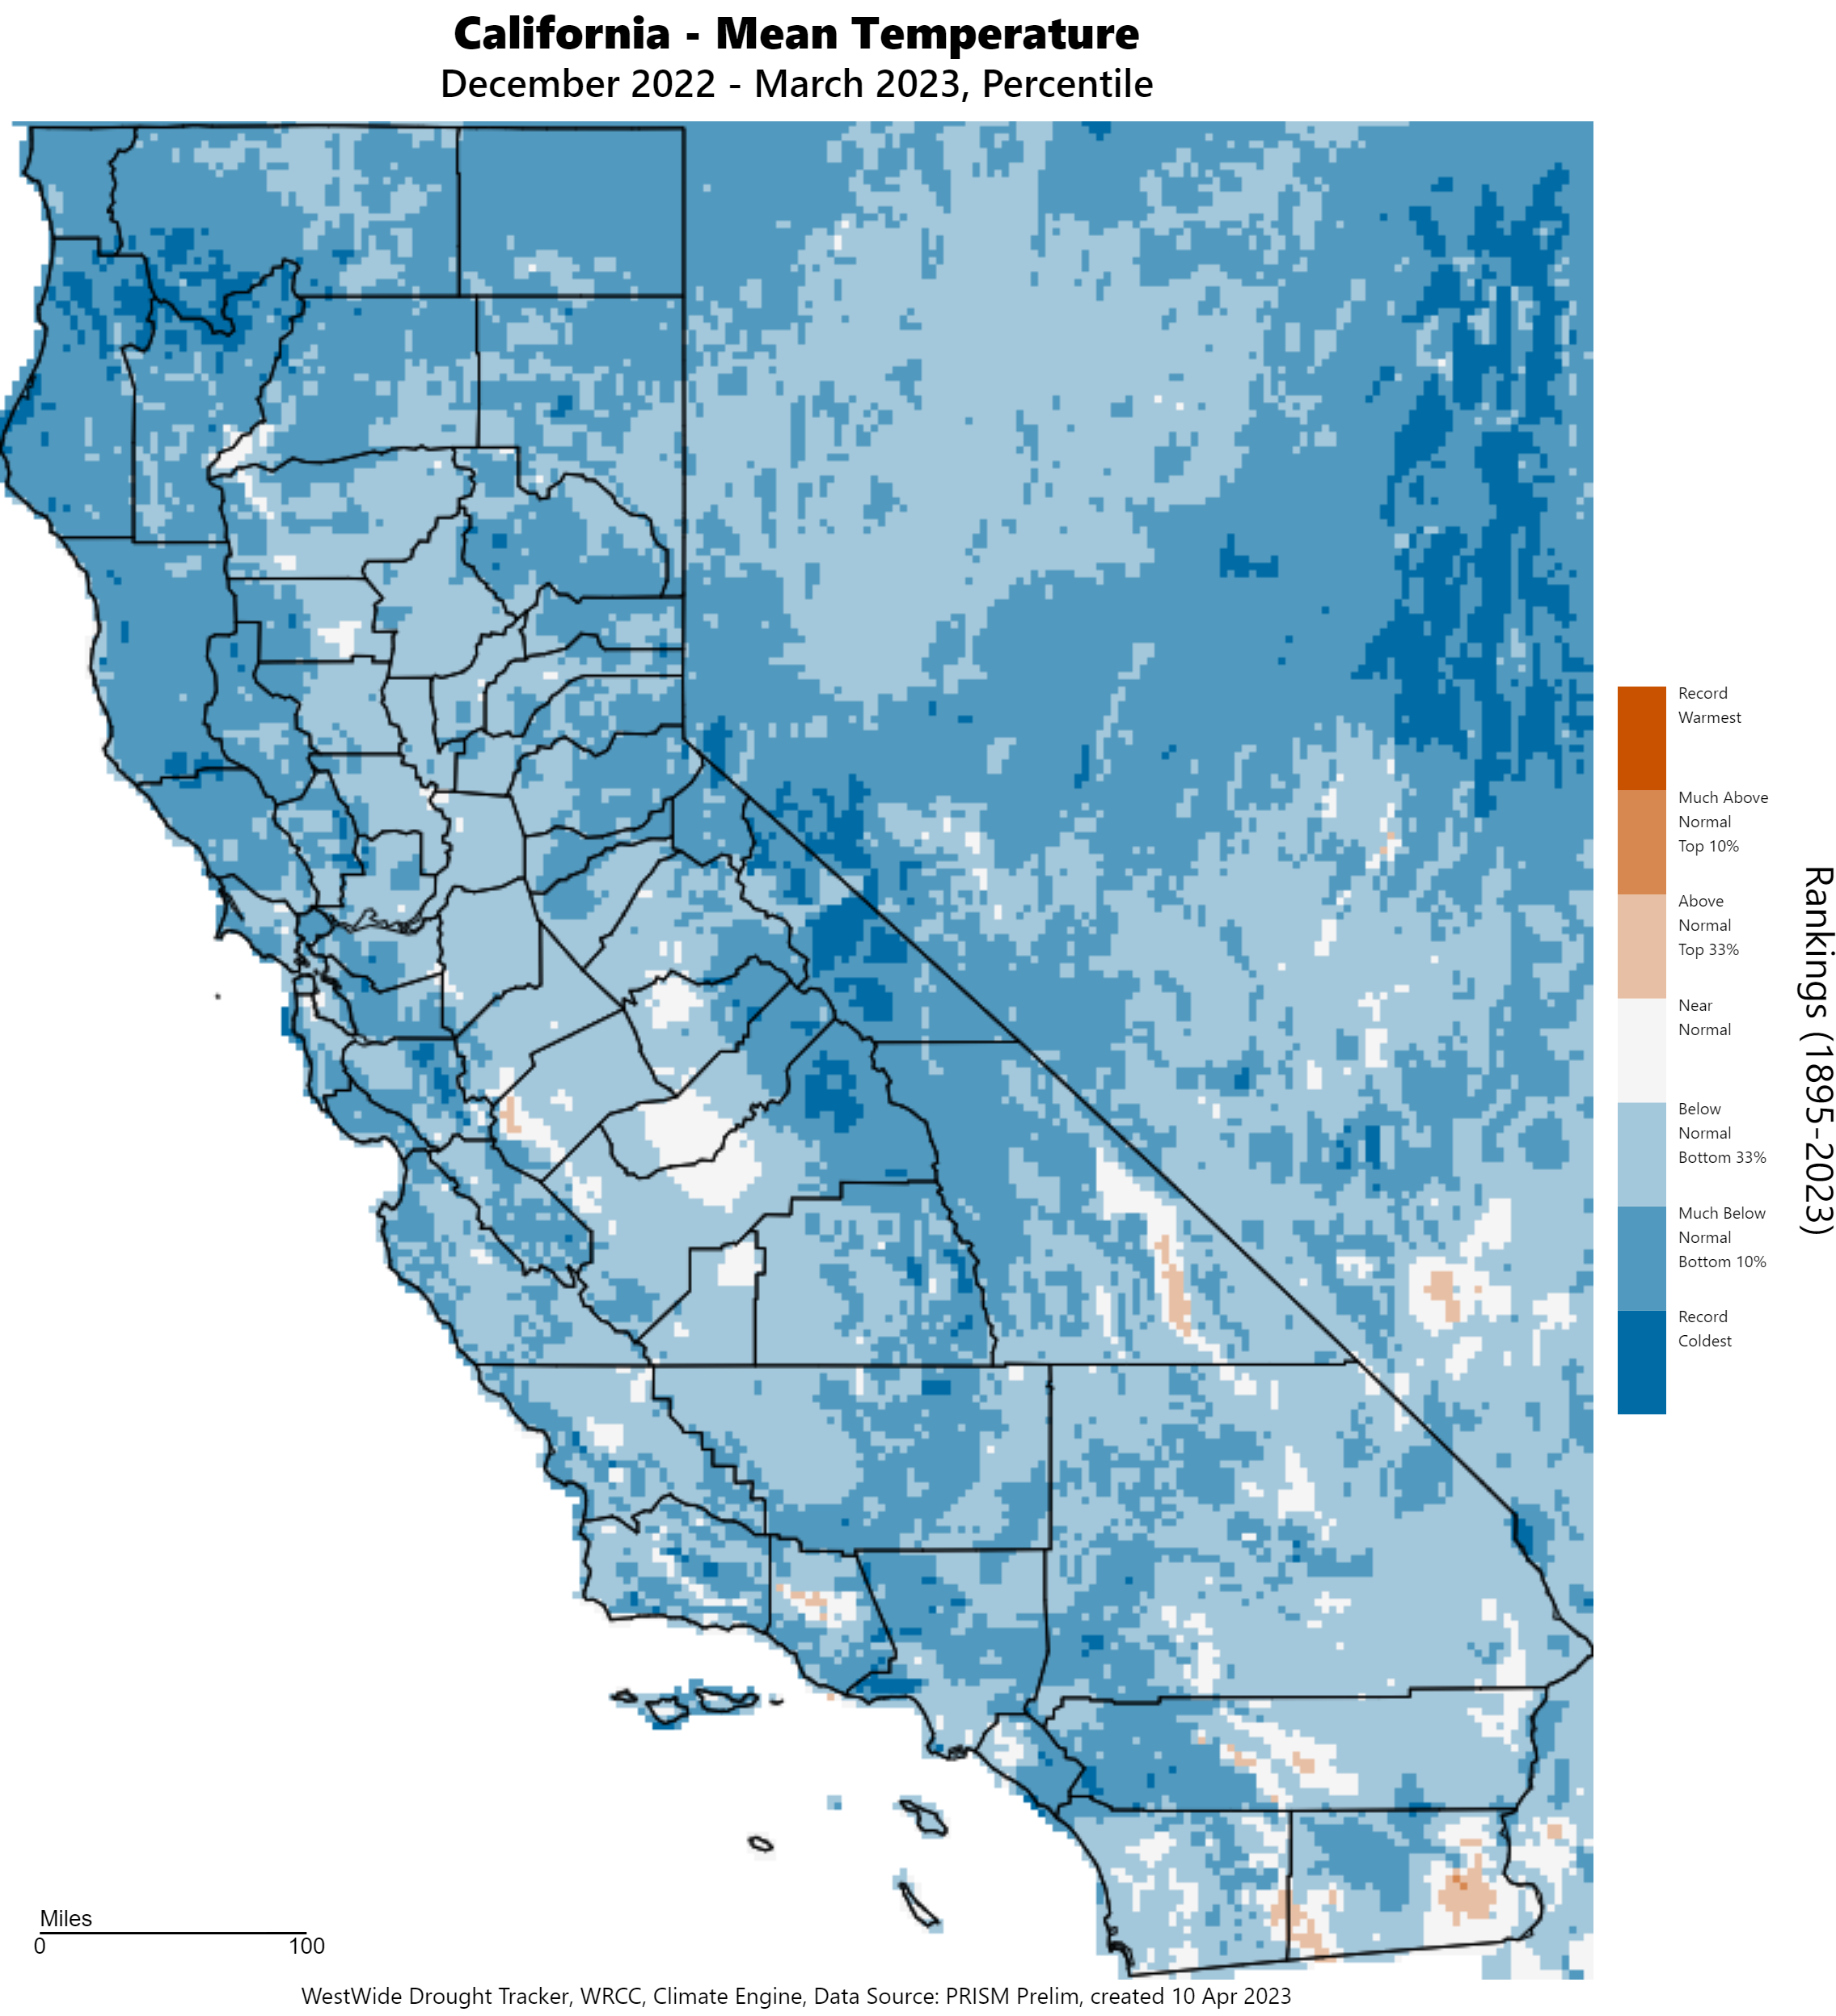 According to the NOAA National Centers for Environmental Information (NCEI) "Climate at a Glance", maximum temperatures were the 13th coldest in California for December 2022 through March 2023 and the 11th coldest for Nevada (out of 128 years of record). The average temperatures were 17th coldest in California and 18th coldest in Nevada. Minimum temperatures were 32nd coldest in California and 35th coldest in Nevada. January saw below-average maximum temperatures (ranking 39th coldest for California and 30th coldest for Nevada out of 129 years). February also saw below-average maximum temperatures (33rd coldest for California and 28th coldest for Nevada) and below-average minimum temperatures (ranking 16th coldest for California and 26th coldest for Nevada out of 129 years). In February 2023, an amazing 666 daily low maximum temperature records were tied or broken in California at Global Historical Climatology Network (GHCN) stations. March 2023 had the 3rd-coolest maximum temperatures for March since 1895 for California and Nevada. Minimum temperatures ranked 15th coldest for California and 11th coldest for Nevada in March 2023. Average temperatures in March ranked 5th coldest in California and Nevada. Low maximum temperatures records were broken or tied numerous times in March 2023, with 643 in California and 388 in Nevada at GHCN stations. Overnight temperatures were also cool in March 2023 with low minimum temperatures tied or broken 459 times in California and 237 times in Nevada at GHCN stations. Heavy precipitation brought flooding to many creeks, streams, and rivers, along with substantial storage increases in area reservoirs, including the reemergence of the normally dry lake bed, Tulare Lake. River forecast points on the Mad, Eel, Navarro, Russian, Salinas, Carmel, Sisquoc, Santa Ynez, Ventura, Sacramento, San Diego, Santa Margarita, Cosumnes, Mokelumne, East Fork of the Carson, and Susan rivers and Sespe and Bear creeks reached flood stage in the December-January storms. Points on the Eel, Navarro, Russian, Salinas, Carmel, Santa Ynez, Ventura, Santa Clara, Sacramento, Middle Fork of the Feather, Merced, San Joaquin, West Fork of the Carson, and Humboldt rivers reached flood stage in February-March 2023 storms. Reservoir percent of average storage levels on December 1, 2022 were 57% at Shasta, 55% at Oroville, 64% at Folsom, 76% at Don Pedro, and 58% at Pine Flat. Reservoir levels increased by the end of March 2023 to 105% of average at Shasta, 116% at Oroville, 109% at Folsom, 115% at Don Pedro, and 137% at Pine Flat. The images below provided by the California Department of Water Resources (CA DWR) show the state of reservoirs across California from before the heavy precipitation to after the series of storms impacted California and Nevada. To expand each image in a new tab, click on each image. 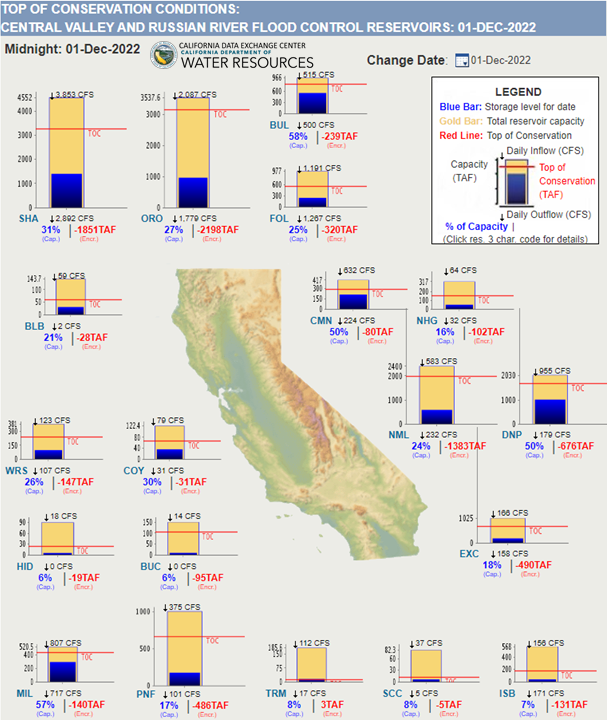 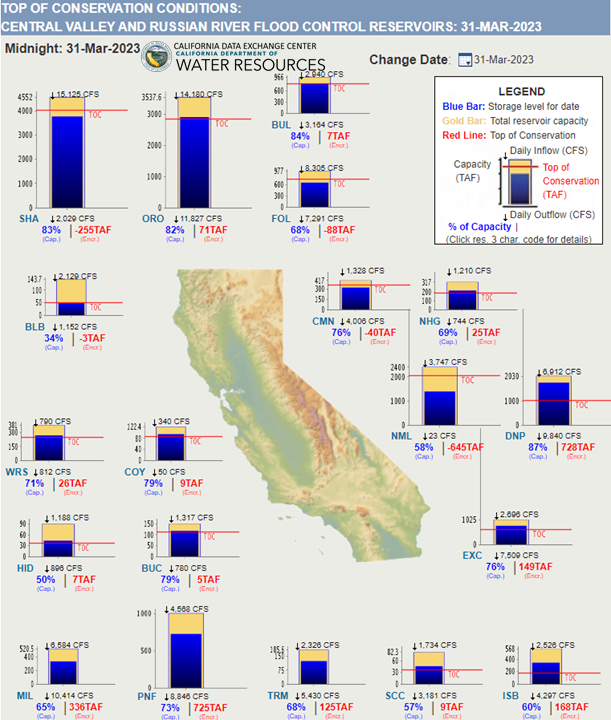 Flooding impacted homes, businesses, roads, vehicles, levees, and agriculture, along with other infrastructure. Many water rescues were performed in the flooded rivers throughout California. Strong wind from the storms, especially the bomb cyclones, brought wind gusts as high as 80-100 mph in some areas, leading to numerous power outages and downed trees. Seven tornadoes occurred in California from January 10, 2023, through March 22, 2023, in Sacramento, Los Angeles (2), Mendocino, Tuolumne, and Santa Barbara Counties, with magnitudes of EF0 or EF1. Mud and debris flows, especially over recently-burned areas, and landslides were also observed due to the heavy precipitation. The impacts of the floods and winds led to over 20 fatalities. Flooding disasters in California cost $3.5 billion (CPI-Adjusted Estimated cost) for December 26, 2022, through March 19, 2023, and resulted in 22 deaths, according to NCEI Billion-Dollar Weather and Climate Disasters. The image below links to the U.S. 2023 Billion-Dollar Weather and Climate Disasters on the NCEI website, which depicts the California flooding as one of the dozens of these types of disasters across the U.S. Also, NCEI provides a PDF document that summarizes all of the U.S. Billion-Dollar Weather and Climate Disasters since the year 1980. 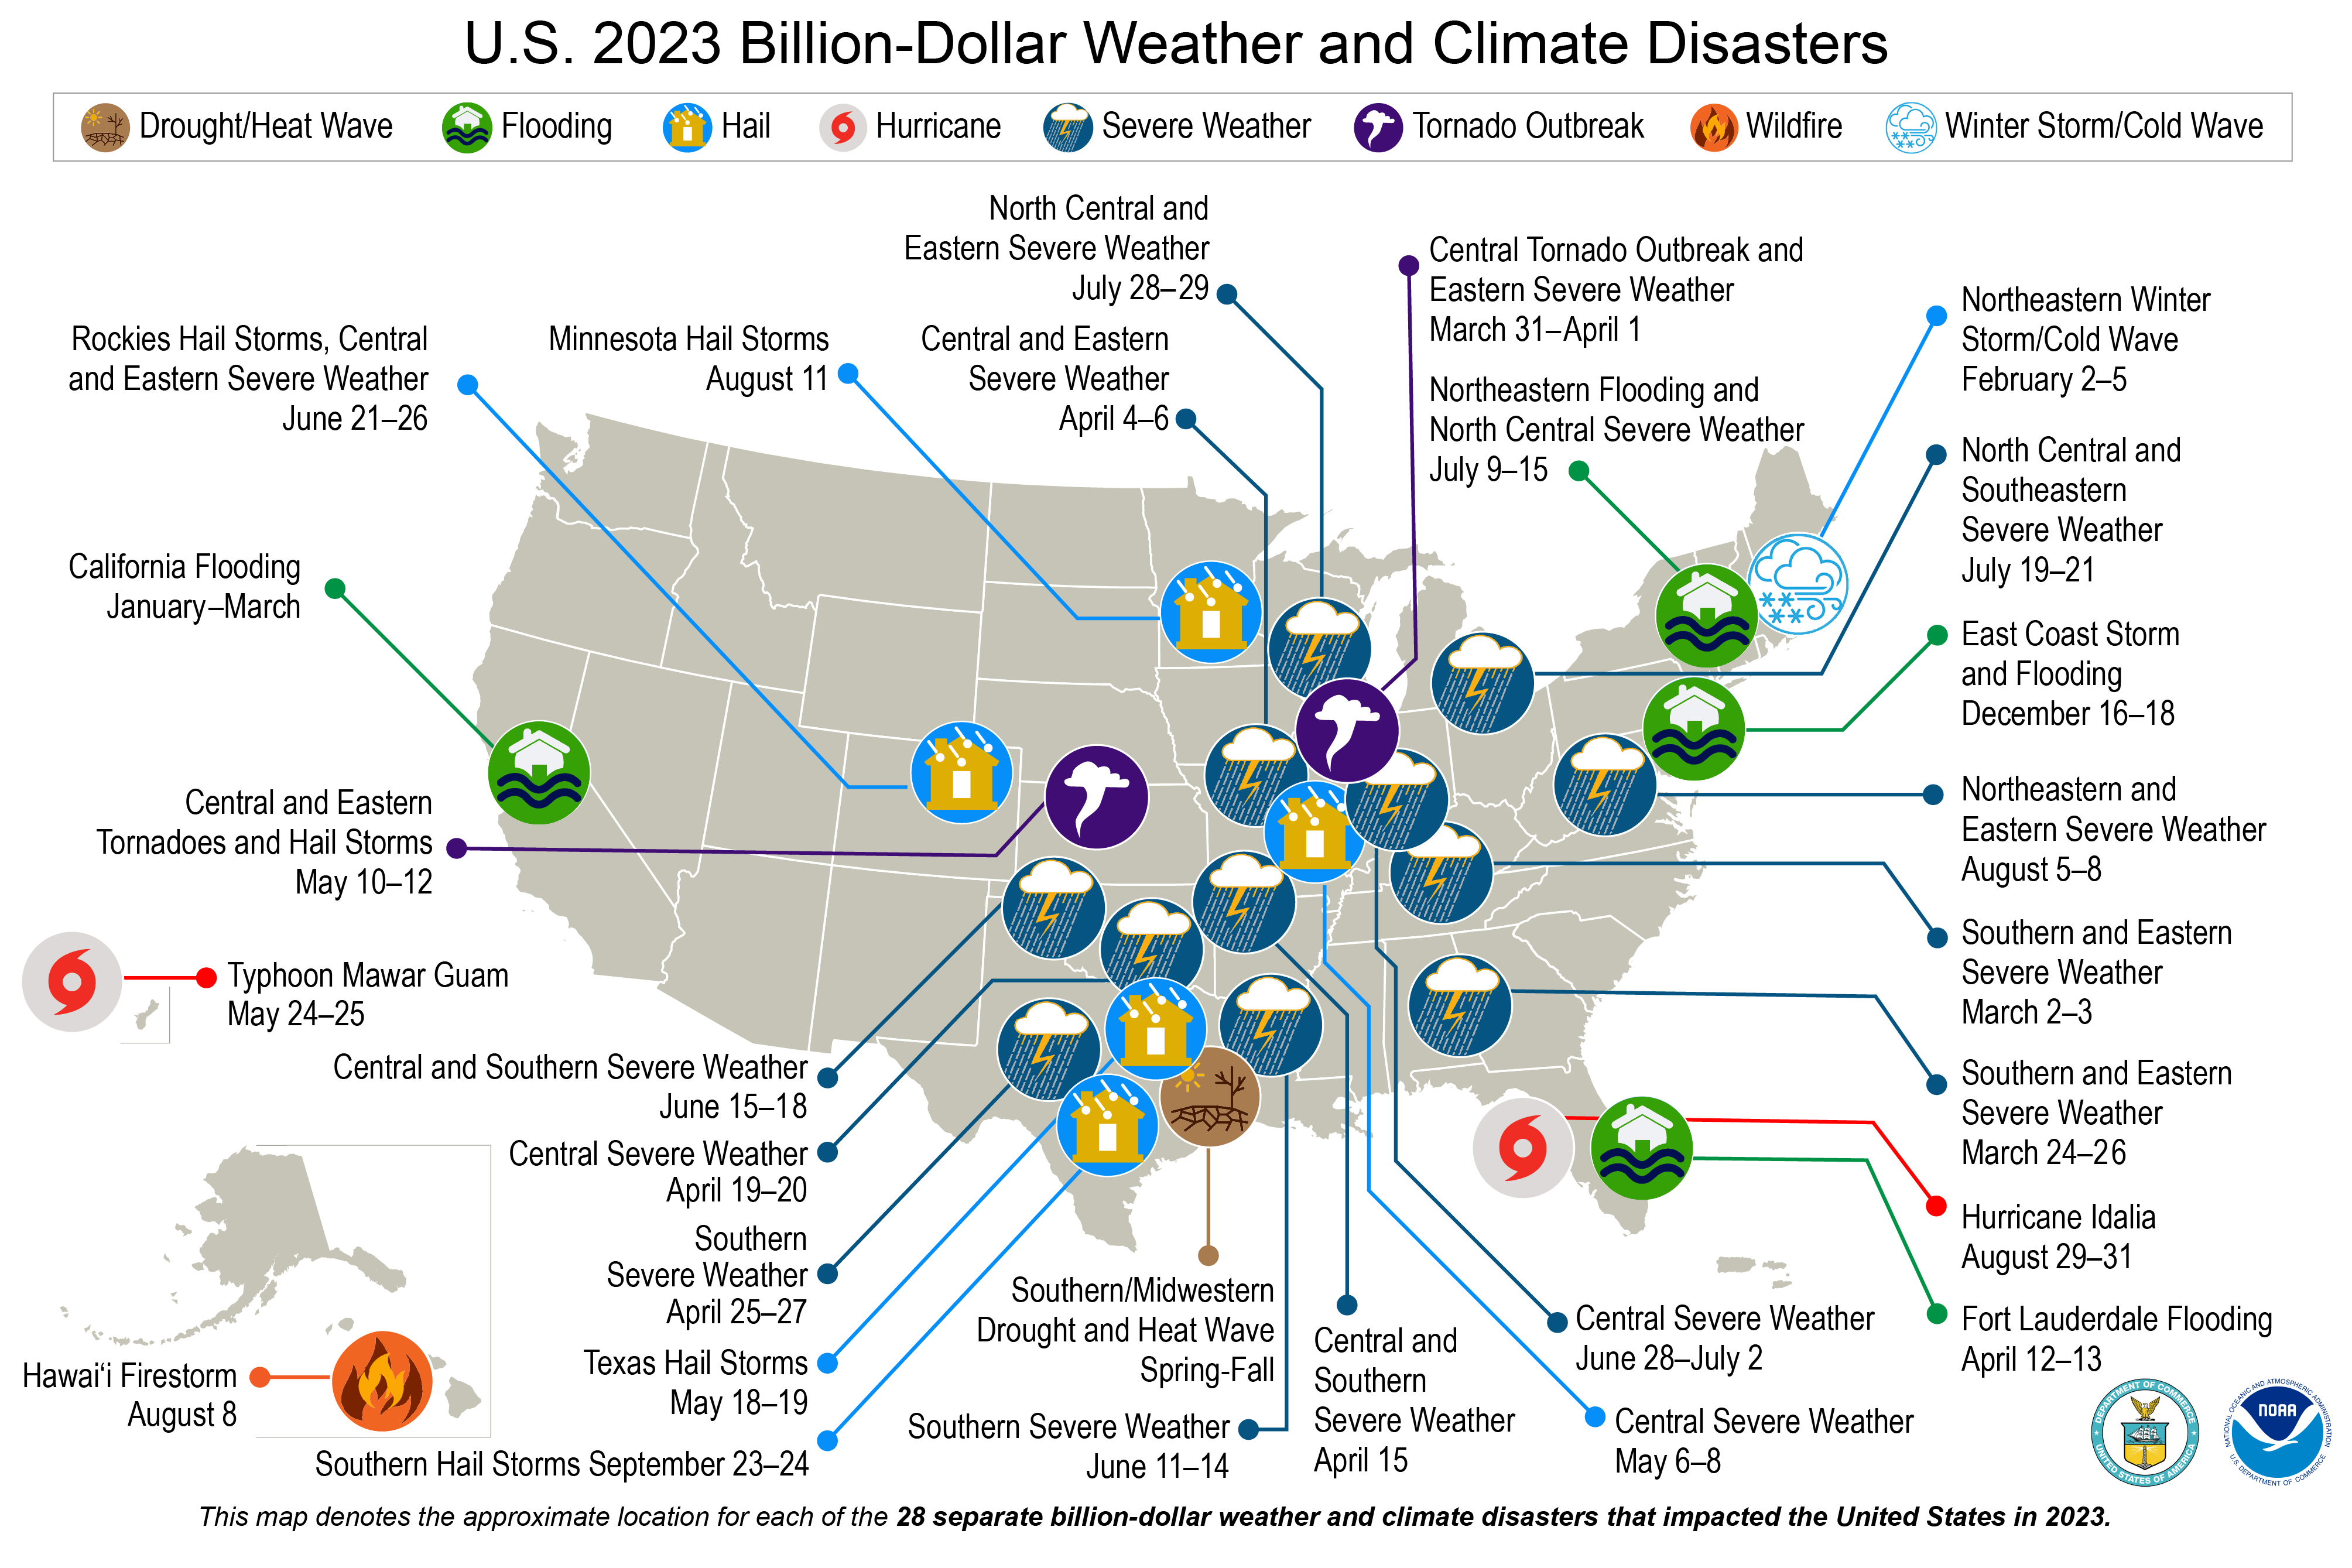 Just after the Christmas holiday, the overall weather pattern changed across the west coast to one that became much more active, with a series of ARs impacting the region through the first 3 weeks of January. The majority of these moisture-laden storms intersected the coast between Cape Mendocino and Point Conception, bringing several rounds of heavy precipitation that initially started with higher snow levels (above 7000 feet), but eventually brought widespread snowfall to mountainous areas after cold-frontal passage. The following section contains a summary of observed precipitation and the evolution of the snowpack from late December 2022 through the majority of January 2023. The table below provides a link to an interactive map displaying quality-controlled precipitaton data in both point and gridded formats. Daily amounts are available starting the morning of December 26, 2022, at 4 AM PST, through January 20, 2023, at 4 AM PST, and multi-day accumulations are available for three distinct periods. The first is from December 26, 2022, at 4 AM PST, through January 2, 2023, which covers the intial wave of precipitation after the Christmas holiday and the intense storm to affect the area on New Year's Eve into New Year's Day. The second is from January 3, 2023, through January 17, 2023, covering several rounds of precipitation with the strongest centered around January 10, 2023. Finally, an all-encompassing point and gridded dataset is available that covers the entire active period.
The two interfaces below provide options to download quality-controlled precipitation data in either gridded, static PNG images (daily only), or point XML format files (daily and multi-day). The data is valid starting and ending at 4 AM PST.
In general, three storm systems, one in early November and two in early December, had precipitation totals hovering near normal through late December. However, after the Christmas holiday, the storm track changed to a very active pattern from late December through the first three weeks of January. The graph below shows both daily and accumulated precipitation amounts at the CA DWR 8-Station (Northern Sierra), 5-Station (San Joaquin Basin), and 6-Station (Tulare Basin) indices from December 27, 2022, through January 20, 2023. Looking at the daily amounts (ending at 4 AM PST), each distinct storm can be seen, including the initial storm on December 27-28, the heavy precipitation event on New Year's Eve and New Year's Day, the next round of precipitation on January 5-6, another storm system centered on January 10, and a final shot of heavier precipitation focused around January 15. Although the greatest accumulated precipitation during this period was observed over the 8-Station and 5-Station indices (24.98" and 24.63", respectively) the biggest anomaly, when compared to seasonal averages, occurred across the southern Sierra Nevada, where the 6-Station Index recorded 16.54". When comparing the precipitation that fell at the 8-Station, 5-Station, and 6-Station indices during the combined months of December 2022 and January 2023 to the historical record, the 8-Station Index (32.81") was the 11th wettest (Wettest: 1997 Water Year with 47.84"), the 5-Station Index (30.35") was the 5th wettest (Wettest: 1956 Water Year with 39.95"), and the 6-Station Index was the 7th wettest (Wettest: 1969 Water Year with 27.08"). This placed the combined December 2022 and January 2023 at 172% of average for the 8-Station Index, 214% of average for the 5-Station Index, and 212% of average for the 6-Station Index.
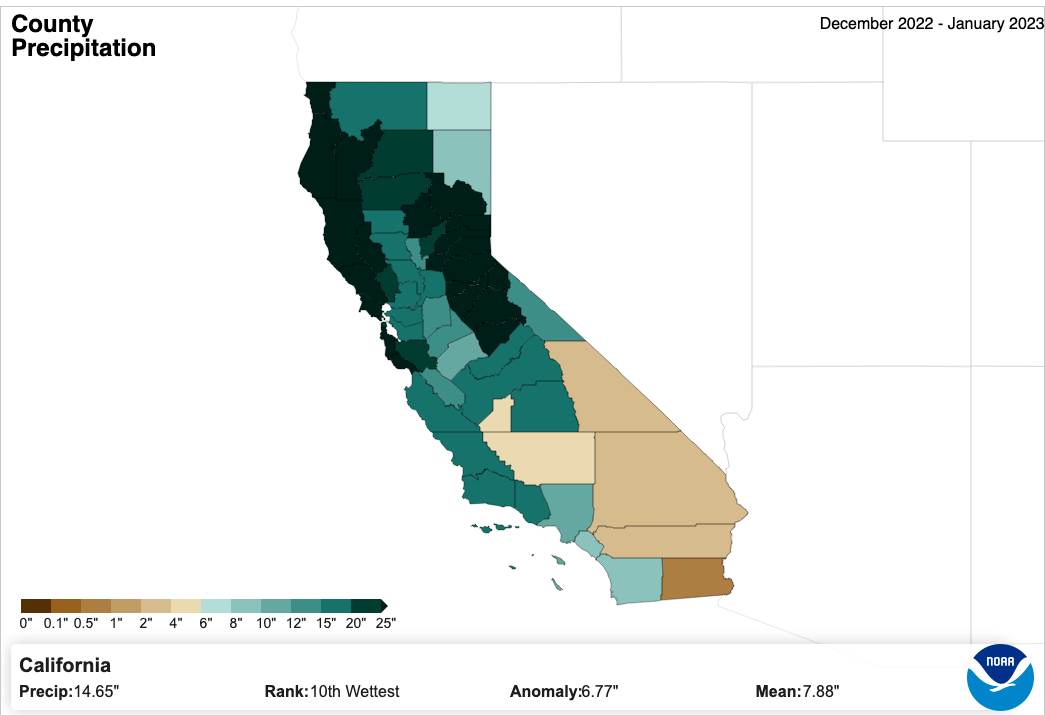
The series of maps below are from the NOAA National Centers for Environmental Information's "Climate at a Glance", depicting county-based precipitation across both California and Nevada for the combined period of December 2022 and January 2023. The buttons below allow the user to view the county-based observed precipitaiton, precipitation rank based on 129 years of data back to 1895, precipitation anomalies, and the precipitation mean using data between 1901 and 2000. With the majority of the ARs intersecting the coast between Cape Mendocino and Point Conception, it is no surprise these coastal areas along with adjacent areas inland across the Central Valley, Sierra Nevada, and state of Nevada saw the greatest anomalies. In terms of precipitation rank, much of the region fell in the top-33%-wettest December plus January, except Del Norte and Imperial counties in California, and Clark County in Nevada. Also, there is a wide swath of counties between the Interstate 80 corridor south across central California and central Nevada that fell in the top 10% of wettest December plus January. Not surprisingly, these areas also saw the greatest hydrologic impacts, especially across the San Francisco (SF) Bay Area, coastal central California, and inland to the Sierra foothills.
Just after the Christmas holiday, the weather pattern shifted to one that brought a series of ARs to the California coast, with the majority intersecting the coast between Cape Mendocino and Point Conception. According to the NOAA National Centers for Environmental Information, this series of storms brought historic amounts of precipitation, with just over 700 individual daily precip records being set between December 26, 2023, and January 20, 2023. The storms that affected the region around New Year's Eve and Day, and January 9-10, featured ARs that moved slowly or even stalled across certain areas. This heavy precipitation resulted in 50 monthly records to be set, with a handful of all-time records being exceeded. The link below will open a webpage in a new tab containing several tables with the new records, the previous records, the date of the previous record, and the period of record for the station.
Although many of the storms impacting the region from late December 2022 through much of January 2023 featured a warmer, high-moisture-content airmass that initially increased snow levels (above 7000 feet) in the warm sector of these systems, after the passage of the cold fronts, the snow levels dropped, with considerable snowfall accumulation across Sierra. SWE across all three water supply regions tracked by the CA DWR increased considerably during the active weather pattern. Statewide SWE was measured at 11.3" on December 26, 2022, and increased dramatically to 33.3" by January 20, 2023. This building of the snowpack took all three water supply regions well above average (197% north, 248% central, and 283% south), higher than the historical 1983 Water Year trace. The graph below shows the evolution of the snowpack through the series of storms between December 26, 2022, and January 20, 2023.
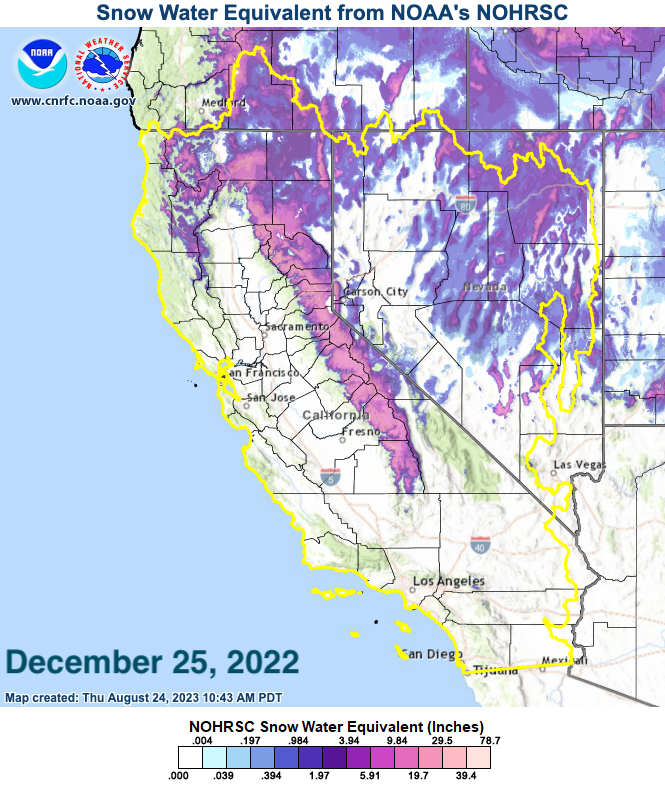
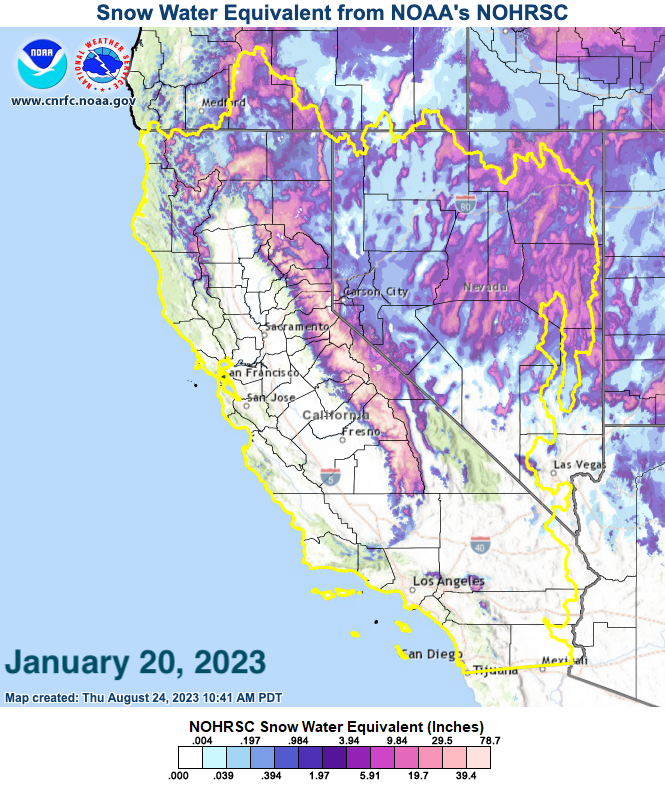
The interface below allows the user to compare the modeled snowpack on Christmas Day, before the prolonged active weather pattern commenced, to the end of the series of ARs that impacted CA and NV on January 20, 2023. The areal extent of the snowpack increased as snow accumulation at lower elevations was significant after individual cold fronts traversed the region and ushered in cooler airmasses. At higher elevations, the snowpack, essential for water supply, also increased dramatically. This modeled snowpack is provided by the National Operational Hydrologic Remote Sensing Center (NOHRSC).
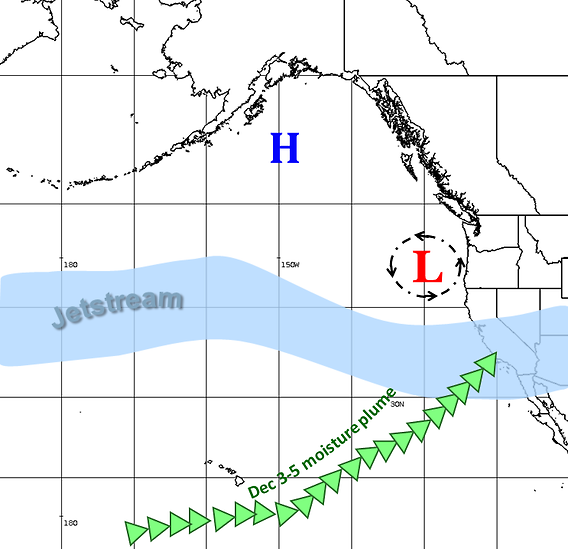
Overview Winter 2022-2023 for California and Nevada was among the top-ten wettest on record as storm after storm hammered the region from December through March. At one stretch, nine atmospheric rivers (ARs) moved across CA in a period of only three weeks from late December through mid-January, causing widespread flooding and landslides. This winter also saw three low pressure systems undergo rapid intensification known as bombogenesis, two of which occurred one week apart in late March. This summary is broken up to cover the storms in December/January and February/March. Each page is then sectioned to focus on time periods during which either one or a series of events impacted the region. This portion will cover December and January. December 3-5 (Sat-Mon), 2022 - Atmospheric River & Upper Low A surface and upper low just offshore of the Pacific Northwest (also referred to as PacNW in this summary) helped pull a 0.50-1” precipitable water (PW) tropical moisture plume into central/southern CA around Point Conception into the morning of the 3rd (Saturday). Additionally, a stationary front set up just north of Point Conception through the rest of southern CA and into southern NV. The tropical moisture then drifted northward throughout the morning, taking aim at the Big Sur Coast before heading back in a southerly direction later in the day and spreading heavy precipitation across the Central Coast. The offshore upper low slowly moved to the southeast the rest of Saturday, bringing additional precipitation to the North Coast in the evening. The moisture and front produced approximately 0.50-1.50” of precipitation across the Central Coast for Saturday with locally-higher amounts over the Big Sur Coast at 4.54” (Big Sur) and 7.44” (Three Peaks). Sunday morning, two cold fronts sat across the region, one just south of Tahoe to Point Conception and the other just offshore of the northern CA coast. The southernmost front was the beneficiary of the tropical moisture plume from the southwest. This moisture continued to move 0.75-1” of precipitable water into central CA, interacting with the cold front as it persisted in its southerly journey. Meanwhile, the approaching surface/upper low began to produce some thunderstorms just offshore of the North Coast while precipitation reached land. The system rotated generally in place off the coast throughout Sunday and into Monday before moving slowly to the south along the northern California coast the rest of Monday. Once the tropical moisture plume began to dissipate, the main focus of precipitation became northern CA for the rest of the weekend and into Monday due to the offshore low. Between the surface/upper low and lingering tropical moisture, two daily precipitation records were broken for December 3rd, one at the Monterey Airport (1.08”) and the other at Englebright Dam (2.05”), while 17 daily rainfall records were broken across CA and three in NV for the 4th. The hot spot for Sunday was at Calaveras Big Trees, which received 4.77” of precipitation. Another three daily records were broken on the 5th in CA at Oroville, Nicolaus, and Volta, as well as three others in NV. Due to the cooler nature of this system, snow levels across the north were relatively low at about 3,000 to 6,000 feet, down from 6,000 to 9,000 feet earlier in the weekend. This allowed snow to fall across the Sierra with totals anywhere from a few inches to nearly a foot. Local storm reports (LSRs) showed totals of up to 20” at Soda Springs and Boreal. This first system did not cause widespread issues as subsequent systems did, but it set the tone for what would end up to be a very wet winter across CA/NV with many record-setting days. December 26 (Mon), 2022 - January 1 (Sun), 2023 - Atmospheric Rivers Late December through New Year's Eve (NYE) saw two landfalling ARs bringing heavy rain/snow, flooding, and land/mudslides to the region. The biggest impacts were experienced during the AR over the New Year’s weekend. This section will discuss how each of these systems progressed, their various impacts, and the difficulty in accurately forecasting the New Year's Eve AR. AR Dec 26-28: A zonal westerly flow set up across the central and eastern Pacific between 30N-40N, allowing individual disturbances to hitch a ride to the west coast. The first system arrived Monday the 26th as a surface low/upper trough riding the north side of a 175-kt upper jet. This system tapped into two tropical moisture sources, the first over the tropical western Pacific near Guam and the second northeast of the Hawaiian islands. Early Christmas morning, total precipitable water (also referred to as TPW in this summary) satellite imagery picked up just under 2.50” PW from the plume near Guam and just over 1.50” near HI where the two merged. This moisture reached the North Coast early Monday morning. The surface low continued to deepen on Monday while slowly moving northeastward. This increased low-level southerly flow across the region with the development of a low level jet (LLJ) through the Sacramento Valley, peaking in the evening at over 50 kt at 925 mb. Just above this, wind profiler data measured WSW winds at 50-70 kt between about 1.5-3 km. This setup is consistent with the Sierra Barrier Jet phenomenon known to enhance precipitation amounts over the Sierra. Favorable WSW winds were also noted across the rest of northern CA and parts of northern NV Tuesday morning. This made for enhanced orographics contributing to heavy precipitation in higher-terrain areas. Additionally, the leading edge of that upper jet reached the North Coast overnight, providing dynamic support to an already stacked system. Meanwhile, the tropical moisture plume continued to move southward the rest of Monday, refocusing over the Bay Area by Tuesday morning. IVT values were near 1000 kg/m/s at San Francisco when the moisture reached the Bay Area. Heavy precipitation passed south of I-80 Tuesday morning with scattered showers filling in across northern CA behind the main line as the upper shortwave approached the coast and the surface low made its way toward the PacNW. Freezing levels also dropped behind the heaviest precipitation, allowing snow to fall down to at least 7,000 feet, while levels in the warm sector were closer to 9,000 to 11,000+ feet. The front end of the moisture plume passed Point Conception in the afternoon before moving into Baja overnight as the upper shortwave followed. The upper-level system then moved across the Great Basin on Wednesday as the tropical moisture plume continued to exit to the south. The 48 hours from Monday to Wednesday saw roughly 4-6+” of precipitation across the mountains of the Central Coast and over the northern/central Sierra. Bonny Doon near Santa Cruz received 8.01”. 69 daily rainfall records were broken across CA and 12 in NV over the period of this system. One monthly rainfall record for December was broken on the 28th at 3.69” for Pinnacles National Park. Heavy rain led to numerous reports of urban flooding and debris flows across hilly areas. The storm also produced strong winds across area peaks, in some locations near or over 100 mph. Accumulating mountain snow occurred above 7,000 feet with storm reports showing snowfall totals between 18-30” above 8,000 feet, leaving statewide SWE well above normal. New Year's Eve AR Dec 29-Jan 1: On Wednesday (28th), models were showing the potential for another AR around NYE, but there was much disagreement on the details. This system would prove to be the more troublesome of the two from a forecast and impacts perspective as models disagreed on the outcome right up to and during the actual event. This AR was defined by three distinct pulses of moisture originating in the topics. The first got wrapped into a large area of high pressure northeast of HI that was consequently aimed into CA early on the 29th (Thurs). The second pulse moved around the northern side of the high pressure, landfalling over northern CA by mid-morning on the 30th (Fri). The high was then displaced by a surface low on the 31st (Sat), allowing a more robust pulse of moisture to landfall near the SF Bay Area, along with the surface low, by mid-morning. Widespread precipitation fell across northern/central CA on Thursday as the first pulse of moisture moved into CA and a warm front sat just offshore of the CA/OR coast. This first moisture pulse was mainly felt across northern CA where about 1-2.75” or precipitation was reported. Intensity then picked up across northern CA on Friday as the second moisture pulse arrived, generally focused across the I-80 corridor. The Friday afternoon sounding out of KOAK - Oakland (12/31 00z) recorded 1.19” of PW (in the top 50 values at number 48 for December), with a saturated profile from the surface up to 700 mb. Inland at KREV - Reno, 0.71” PW (in the top five wettest values for December) was measured. Freezing levels at both sites were near 10,000 feet, indicating that tropical moisture was moving onshore and advecting inland. KREV - Reno also had nearly 80-kt winds at 700 mb out of the WSW, suggesting favorable upslope orographics over the Sierra. Moderate to heavy precipitation continued overnight Friday as the pulse of moisture slowly moved southward and a deeper upper trough and surface low approached from the west. Precipitation amounts for Friday were the highest over the northern/central Sierra at about 4-8” and local amounts of 8-10”. The Central Coast received about 1.50-3.50” with local amounts of 4-5+”. California broke 27 daily rainfall records for the 30th, two of which were records for the month of December and one was an all time record of 9.20” at Echo Peak. Nevada broke 21 daily records, six of which were records for the month of December. The AR continued its deluge into NYE with heavy precipitation still across the I-80 corridor and the main moisture plume centered over the SF Bay Area tilted in a southwest to northeast orientation. TPW satellite imagery measured about 1” PW over that area Saturday morning. There was also a stationary front stretching across northern CA and NW NV with an upper trough approaching from the west and a surface low near SF. The moisture plume slowly moved to the south during the morning, keeping the main focus of precipitation across the Bay Area and through the Sacramento Valley. The combination of the aforementioned features kept precipitation relatively widespread into the northern Sierra during the afternoon even as the main moisture plume slowly drifted to the south. Cameras and observations recorded a mix of rain and snow across the region, with the highest accumulations around the Bay Area and I-80 through to the central Sierra. The surface low and associated front moved inland the rest of the day, sweeping across the region to the southeast, while the moisture continued to slowly move to the south. By the evening, the main moisture was focused across the southern Sierra and southern San Joaquin Valley through to the Transverse Ranges from Santa Barbara to Los Angeles counties. Low-level southerly flow was evident between surface observations and the vertical wind profiler at KVTX (Sulphur Mountain), resulting in good upsloping for the Transverse mountains. Precipitation also continued to rotate around the surface low that was now located over the foothills east of Sacramento. Another band of precipitation focused over northern NV around I-80. Overnight, the heavier precipitation continued across southern CA with PW values along the coast between 1-1.25” just ahead of the main front. Mid-level winds kept transporting moisture inland with SW flow at 700 mb around 40 kt creating favorable conditions for continued precipitation. Highest precipitation amounts for Saturday were around the Bay Area, Central Coast/Big Sur Mountains, and the central/southern Sierra at approximately 3-6”. Downtown San Francisco recorded 5.46” of rain on the 31st, both a daily record and a record for the month of December. It was also the second-wettest 24-hour period on record for San Francisco going back to 1849 when records began. Locally over 7” was measured in the Santa Cruz Mountains. The Transverse Ranges received about 3-5.50”. For December 31st, dozens of daily rainfall records were broken in CA, 17 of which were records for the month and 7 were all-time records, including at downtown Oakland (4.75”) and Gilroy (9.74”). Nevada broke 35 daily records, 9 of which were records for the month of December, with values roughly between 1.25” and over 4” in a 24-hour period. One all-time record was also set in NV at 4.64” in Minden. Sunday morning, the main moisture plume from the AR had mostly left the area to the south into Baja, while the northern edge remained over SE CA. The surface low moved to the southeast along the CA/NV border, reaching just north of Death Valley. The upper trough also began to move across the region, encompassing much of the west by Sunday morning. This allowed showers to continue over SE CA and NV for the rest of the day. Amounts for New Year's Day were much lighter, with the bulk of the remaining precipitation falling over the far southern CA coastal mountains, producing about 1-3.50+”. For days, forecast models had struggled to predict the landfall location of the third moisture pulse on NYE as well as its subsequent movement. The models had mostly disagreed by one predicting the AR landfalling north of the Bay Area and the other to the south. There was also a lack of consensus regarding how quickly the moisture would move across CA. An AR that stalls or drags out its southward movement could drop substantially more precipitation over those areas than originally expected. The ensembles were not much help as there was a decent spread of possibilities with members leaning towards the trajectory and timing of their respective deterministic runs. The other issue was the timing and path of a surface low set to traverse northern/central CA around the same time as the moisture plume. It was apparent early on that the movement of this low could potentially spread tropical moisture further across the region or not depending on how quickly it traveled and where it tracked. The low’s position could also impact the direction of overall flow and either enhance or limit orographics. These model differences were present even 24 hours out from the main event. On the morning of Friday the 30th (00z/06z runs) the GFS continued to focus the main moisture and heaviest precipitation for Saturday across the North Bay/northern Sierra, while the ECMWF focused it over the Santa Cruz Mountains and South Bay. As was discussed above, the moisture plume ended up focused over the SF Bay Area through the I-80 corridor to the central Sierra. It also moved through more slowly than both models had estimated, which was a worst-case scenario forecast-wise with errors in both the landfall location and speed of the AR. This led to significant errors in the QPF (Quantitative Precipitation Forecast), particularly around the SF Bay Area, Sacramento Valley, and central/southern Sierra. For example, San Francisco ended up receiving more than twice the amount of precipitation as initially forecast in the days leading up to NYE due to the models failing to adequately capture the structure of the AR as well as its movement and interaction with a passing surface low. These discrepancies also had a negative impact on the hydrological forecasts, which are heavily dependent on QPF. Details of the hydrological issues and impacts can be found in the Hydrologic Impacts section. Over a 48-hour period from Dec 30 to Jan 1, the Bay Area and central CA received 2” to over 10” of precipitation. Over the Sierra, the 8-Station, 5-Station, and 6-Station indices had received almost 50% of their average Water Year totals. This system also generated gusty winds across the region along with heavy snow, as freezing levels lowered behind the main moisture plume. Wind gusts of over 50-60 mph were observed, exceeding 100 mph in parts of the Sierra. Snow levels began at around 8,000 to 10,000 feet before lowering to 2,500 to 6,000 feet after the tropical moisture passed, allowing for heavy snow to fall across higher elevations. Snow amounts varied from a few inches to 20” to nearly 40” for parts of the Sierra in just 24 hours. A high of 39” was observed at South Lake snow pillow in Inyo County from the 31st to the 1st at an elevation of 9,600 feet. Storm-total snowfall for the 48-hour period was as high as 40-54” (3-4.5 ft), with the 54” observed at Mammoth Mountain and Homewood Mountain Resort in Placer County. At the end of the month, SWE ran from 140% to over 200% of normal across the Sierra. This AR resulted in widespread river and urban flooding with multiple levee breaks along the Cosumnes River, which resulted in the closure of State Highway 99 in southern Sacramento County. Dozens of water rescues were performed, with two fatalities attributed to flooding. Multiple mud/rock slides were reported, along with downed trees and powerlines closing a number of roads and highways as well as causing multiple power outages. For the period of time between Christmas and New Year’s, the Sierra observed 5-20” of precipitation with roughly 2-15” across much of the rest of the state. While a ridge moving in behind this last storm brought a little relief, that was not the end of what would become a very long and wet winter for California and Nevada. The next in a series of storms was on the way in what ended up being multiple systems inundating the region for essentially two straight weeks. January 4-17 (Weds-Tues), 2023 - Multiple ARs & a Bomb Cyclone The zonal westerly flow that allowed multiple systems to reach CA in late December/early January remained in place, continuing to provide a path for disturbances to cross the eastern Pacific. Additionally, a general pattern of high pressure west of Baja and low pressure to the north drew tropical moisture into CA for the majority of the systems that moved through during this stretch. The two-week period from early to mid January included a bomb cyclone as well as multiple ARs. Any one of these alone would have been noteworthy, but this stretch of time saw these systems impact the region nearly back-to-back. Bomb Cyclone Jan 4-5: A strengthening surface low approached the west coast on Tuesday (Jan 3rd) along with an upper shortwave at the nose of a strong zonal upper jet containing 300 mb winds near 160 kt across the western and central Pacific. The system was expected to undergo rapid intensification over the next 24 hours, promoting strong low-level southerly flow and drawing in tropical moisture as it approached. As of Tuesday, TPW satellite imagery reported PW values around 0.50” near the core of that moisture plume. The surface low did in fact undergo rapid intensification, going from 1000 mb at its core on 00z Jan 3rd to 969 mb at 00z Jan 4, strengthening by 31 mb in 24 hours. The low reached a minimum central pressure of 956 mb at 18z on Wednesday the 4th. Precipitation began over northern and central CA by early Wednesday morning as a warm front ahead of the main low arrived just offshore. As alluded to above, the low picked up some tropical moisture from the southwest that reached northern CA in the early morning. Precipitation spread to the northeast the rest of the morning as the warm front made landfall and the surface low moved northeastward towards BC. The upper shortwave strengthened, closing off into an upper low by the late afternoon, eventually following the path of its surface counterpart northeastward, while troughing on the southeastern edge of the system impacted CA and the plume of moisture traveled southward across the state. The surface system’s cold front moved onshore in the evening, bringing additional heavy precipitation to CA. Low-level SSE winds ahead of the cold front contributed to favorable upsloping over the western side of the Shasta Lake drainage and eastern slopes of the northern CA coastal mountains, while southerly flow over the Transverse Ranges also brought favorable upsloping just as the moisture plume reached Point Conception. The cold front continued to move across CA Thursday morning, bringing additional precipitation to the region. Thunderstorms developed along the coast and across the valley overnight Wednesday as well. The heaviest precipitation on Thursday was mostly focused over the San Gabriel and San Bernardino mountains as well as the mountains of San Diego County. Favorable southwest flow to the north generated upsloping across the Sierra, allowing showers to persist for Thursday. This was an overall colder system with snow levels initially 7,000 to 9,000 feet before dropping to 2,000 to 5,000 feet. This allowed higher-terrain areas to receive snow ranging from a few inches to nearly three feet (≈4-33”). Strong pressure gradients due to the strengthening low also brought wind gusts of 40-60 mph to the region and over 80 mph across the mountains. Precipitation amounts for Wednesday were around 1-4.50” with locally 5-7.50” over the Big Sur Mountains. Another 1-3” fell across the Sierra and along the CA coast on Thursday. Heavy rain led to numerous reports of urban flooding and debris flows. At least one fatality occurred due to a levee break in Sacramento County, while a falling tree resulted in an additional fatality in Sonoma County. Series of Back-to-Back Storms Jan 6-17: A series of systems would impact the region over the next week and a half, each pulling in tropical moisture. These storms arrived in nearly back-to-back fashion on Jan 6-8, Jan 9-10, Jan 11-14, and Jan 15-17. This section will describe the meteorological conditions surrounding each system and the associated impacts. On Friday (Jan 6th), isolated to scattered showers continued over northern CA/NV from the previous trough as the next system approached in the form of a surface low and upper trough. Precipitation from this next system arrived in northern CA Friday afternoon ahead of a cold front associated with the approaching low and a 1” PW moisture plume. The cold front arrived just offshore of the northern CA coast Saturday (7th) morning, followed by the moisture, which reached the central CA coast in the early afternoon. The plume of moisture was focused around the Bay Area southward to Monterey Bay at about 1.2” PW according to TPW imagery. The moisture plume weakened as it moved to the south overnight while the cold front also swept through, spreading heavier precipitation across northern/central CA. Highest precipitation amounts were across the northern/central CA coastal mountains and through to Shasta at 2-4.50” inches. Locally-higher amounts were observed near Cape Mendocino with 6.16” at Honeydew. The trailing upper trough moved through to the northeast Sunday morning, continuing scattered showers and isolated thunderstorms from southern OR down to Point Conception. Precipitation from this system began to taper off Sunday afternoon ahead of the next and more potent storm that arrived in the evening. The second AR was followed by an upper low. By Sunday afternoon (Jan 8th), a moisture plume of about 1.4” PW could be seen approaching the CA coast. The leading edge of this system arrived in the evening before spreading 1” PW of moisture from Mendocino County all the way to southern California (also referred to as soCal in this summary) and inland to the Sierra foothills overnight, while 1.5” PW of moisture still remained offshore. Additionally, an approaching trough acted to veer low-level southerly flow in a more southwest direction, resulting in enhanced orographics. The combination of these factors brought widespread moderate to heavy precipitation across northern/central CA overnight Sunday. Monday morning, a cold front arrived along the northern CA coast as the moisture plume focused over central CA from Point Arena to Point Conception. TPW satellite showed about 1” PW inland and 1.5” just off the coast. This PW was roughly 250% of normal measured at 1.25” in the 01/09 12z sounding at KOAK (in top 25 for January) and 1.29” at Vandenberg (in top 15 for January). The moisture continued to slowly shift southward the rest of the day as the front moved onshore. Low-level southerly flow ahead of the front resulted in ideal upsloping as the vertical wind profiler at KVTX showed southerly winds of 20-35 kt. The Transverse Ranges took full advantage of these favorable orographics, dumping 10-13+” of precipitation over Santa Barbara and Ventura counties from Sunday night (8th) to Monday night (9th), peaking at 13.28” at San Marcos Pass above Santa Barbara. Heavy precipitation continued to focus over the Transverse Ranges overnight Monday even as the main moisture shifted to the south, thanks to persistent upsloping from southerly flow. Meanwhile, another round of precipitation was moving onshore up north from the Russian River basin through Monterey County as a surface/upper low continued to approach. The front associated with the approaching system moved onshore overnight with the surface low reaching just west of Cape Mendocino Tuesday (10th) morning as the upper low also began to make landfall. The upper-level system and surface cold front moved across CA the rest of Tuesday, dropping showers and thunderstorms as the tropical moisture continued to weaken while passing across soCal. Models did a poor job of predicting the amount of precipitation across the Transverse Ranges that resulted from upsloping. The heaviest precipitation from this system fell in the 24 hours from 12z on the 9th to 12z on the 10th across the Transverse Ranges and Big Sur mountains, where about 4-8” fell on average. The western portion of the Transverse Ranges received 10-15” (14.84” at Gibraltar Reservoir) while 3.50-7” fell across the Sierra. Snow levels ranged from about 4,000 to 9,500 feet across the region during this storm, allowing snow to fall once again across the mountains. Snow totals ranged from a few inches to over a foot in the northern Sierra and over 40” for parts of the southern Sierra. Cottonwood Lakes snow pillow at just over 10,000 feet estimated 47” of snow for the storm's duration. This AR led to numerous reports of urban area flooding and debris flows. Downed trees and various wind damage occurred as the region saw gusts of 50 mph to over 80 mph. There was even a small EF-1 tornado near Small Reservoir and Hogan Dam Road in Calaveras County around noon on January 10th. Other funnel clouds were also spotted across CA. Seventy-four daily rainfall records were broken across CA and twenty-two in NV. Nine of those were monthly records for January in CA with two being all-time records at 6.05” in San Luis Obispo and 13.16” for a site in the Transverse Ranges. After that, there was a brief pause between systems due to a passing ridge; however, another atmospheric river was already quickly on its way thanks to a large low-pressure system in the Gulf of Alaska/eastern Pacific that acted to funnel more tropical moisture into CA. This next round of moisture was set to arrive on Wednesday the 11th. A 1.3” PW plume of moisture was offshore along 130W Wednesday morning with about 0.75-1” PW reaching the northern CA coast as a warm front sat offshore out ahead of the main surface low/cold front. Precipitation was observed on radar across much of CA north of Monterey County before spreading further into central CA in the evening. The plume of tropical moisture began to narrow and shift to a more N-S orientation offshore of CA ahead of the approaching trough Thursday morning. This continued much of the precipitation for Thursday along the northern CA coast and in the Shasta basin due to southerly upslope flow. Tropical moisture continued to funnel into northern CA overnight before gradually moving southward along the coast and weakening throughout the day Friday. The upper trough arrived along the west coast Friday (13th) morning along with the cold front. Freezing levels exceeding 8,000 feet came in with the warmer air mass ahead of the cold front, dropping to 5,000 to 6,500 feet behind the front as it headed inland the rest of Friday. The trough closed off into an upper low by Saturday morning offshore of OR, with a front along the northern CA coast and into central CA. Another surge of tropical moisture also rotated around high pressure located just NE of HI before being pulled into southern CA later Saturday morning. Decent moisture lingered over northern areas from the previous plume with PWs coming in at nearly an inch along the CA coast from Point Arena to Point Conception. This moisture shifted southward across CA the rest of Saturday (14th), combining with the new moisture plume south of Point Conception as the surface/upper low moved northward towards the PacNW. This brought moderate to heavy precipitation to much of the CA coast. The trough at the tail end of the upper low would swing through CA overnight Saturday, spreading additional precipitation into coastal soCal. The moisture plume exited to the south into Baja Sunday morning. Storm-total precipitation from the 11th-14th came out as 4-10” over the North Coast, 2.50-7.50” for the Bay Area, 3-11” along the Central Coast, 2.50-10” across the Sierra, and 2.50-5.50” over the Transverse Ranges. Another surge of tropical moisture was then headed for southern CA Sunday into Monday. This moisture plume of about 1.1” PW, aided by onshore flow, brought more precipitation to southern CA overnight. Additionally, a surface low and upper trough would follow, moving across CA on Monday. The low arrived onshore just north of Monterey Bay Monday morning, spreading precipitation from Monterey Bay to the I-80 corridor. The system then reached the CA/NV border in the afternoon as another disturbance moved south along the CA coast. The trough overhead then expanded into southern CA in the evening before moving across CA/NV through Tuesday morning. This dropped showers and thunderstorms across the region, with the majority of the precipitation over central/southern CA. Amounts came to 2-5” along the Central Coast, central/southern Sierra, and Transverse Ranges, with locally near 6” over the central Sierra. Highest reported totals were in the San Diego County mountains at just over 10”. Once again, snow levels were lower for these storms at about 3,000 to 6,500 feet, allowing additional snow to fall on an already-high snow pack. Snow totals ranged from as low as 5” to as much as 40”, with generally 10-30” observed above 7,000 feet in elevation. A maximum of 41” of snow was reported at the Tenaya Lake snow pillow at 8,100 feet. Strong winds occurred again as well, with gusts of 40 mph to nearly 70 mph measured across the region. These last storms in mid-January were responsible for additional urban-area flooding and downed trees. For the period of January 4th to the 17th, roughly 10-20” of precipitation fell across the higher terrain of CA. Locally, areas reported totals of 20-30”. Summary December through mid-January proved to be a very active period for CA/NV as ten ARs inundated the region, along with a bomb cyclone. Nine of these ARs occurred in only a three-week time period, causing widespread flooding and landslides. There were also numerous water rescues and multiple fatalities related to either flooding or falling trees from strong winds. These systems also led to drought improvements for most of the western U.S., as well as filled many reservoirs across CA that had been well below average at the start of winter. SWE at each of the station indices was over 200% of normal and 251% of normal statewide by the end of the active period. CA received 80% of its average seasonal snowpack in three weeks and 46% of the statewide average water year amount of precipitation. For the month of December, 253 daily precipitation records were broken in CA and 110 in NV. For January, 218 daily records were broken across CA and 69 for NV. As many as 14 of these were all-time records for CA and one for NV. After a series of back-to-back storms from early to mid-January, California and Nevada finally received a break in major systems until late February, when a wet pattern returned and stuck around through the month of March (Feb/March Storm Summary). Weather Graphics
The table below provides links to atmospheric soundings across the region during each storm event period for December and January. Moisture was well above normal in most instances. During the New Year's Eve AR, KREV (Reno) experienced one of the top-five wettest PW values for December, while KOAK (Oakland) was in the top 50. These were overall warmer systems due to the tropical origin of the moisture plumes. This resulted in freezing levels around 8,000 to 12,000 feet before lowering to about 3,000 to 6,000 feet towards the end of each event. Strong low-level winds out of the southwest to west-southwest as high as 50-80 kt (700-850 mb) resulted in favorable upsloping across area mountains for many of these events.
The table below contains links to snow level plots from vertically-pointed radars, used to determine the bright band location where precipitation transitions from frozen to liquid. Snow level radar loops are provided during each storm period for December/January. The systems that included moisture sources from the tropics tended to experience snow levels of 7,000 to 12,000 feet before dropping to 3,000 to 6,000 feet behind the main moisture plume. The result was heavy snow across area mountains, with CA receiving 80% of its seasonal snowpack in only three weeks.
The table below provides links to 6-hourly NCEP/NCAR Reanalysis data composites at different levels of the atmosphere during the December/January storm events. This also includes departure-from-normal imagery.
The table below links to infrared and precipitable water imagery at 1-hour intervals during the storm events of December/January. The infrared satellite imagery shows the colder cloud tops during periods of heavy precipitation. The precipitable water imagery shows the origins of the tropical moisture plumes that were funneled into the region, as well as the evolution of the moisture as it drew nearer. In many instances, low-pressure systems picked up tropical moisture on their way to the west coast.
The links below lead to loops of National Weather Service (NWS) radar data covering the California-Nevada River Forecast Center (CNRFC) service area during each storm event in December/January. Each image contains a radar mosaic made from individual radars across the region at the top of the hour.
Overview Several ARs impacting California and Nevada from late in 2022 through the first half of January resulted in flooding on many area rivers, while reservoirs saw significant increases in storage. This was particularly true across central and southern California, where numerous basins experienced increased river flows. However, for the most part, the higher-elevation basins were spared any significant flooding due to relatively lower snow levels. The following section will discuss the hydrology for several areas, including: the Cosumnes River, Bear Creek (Merced County), Salinas River, Pajaro River, San Joaquin River/southern Sierra basins, and portions of southern California (Santa Ynez River and Ventura River). Cosumnes River Summary The CNRFC has two official forecast locations on the Cosumnes River: Michigan Bar and McConnell. Upstream of Michigan Bar, the Cosumnes River watershed consists of 535 square miles ranging from 837 to 7,736 feet in elevation. There are no major dams, leaving downstream reaches vulnerable to high flows following periods of intense rainfall. The local contributing area between Michigan Bar and McConnell is 189 square miles, consisting of gradually sloped land ranging from 30 to 1,726 feet in elevation. Between Michigan Bar and McConnell, incidental flood protection is provided by agricultural levees maintained by private landowners and a local Reclamation District. Identifiers for streamgages at these two locations are provided in the table below.
The figure below shows the stage at Michigan Bar for the period December 2022 through March 2023. The table below summarizes all exceedances shown in the figure. On December 31, 2022 at 10 AM PST, Michigan Bar peaked at 4.8 feet above flood stage, and remained above flood stage for 31 hours. Michigan Bar exceeded monitor stage eight times for a total duration of 32 days above monitor. 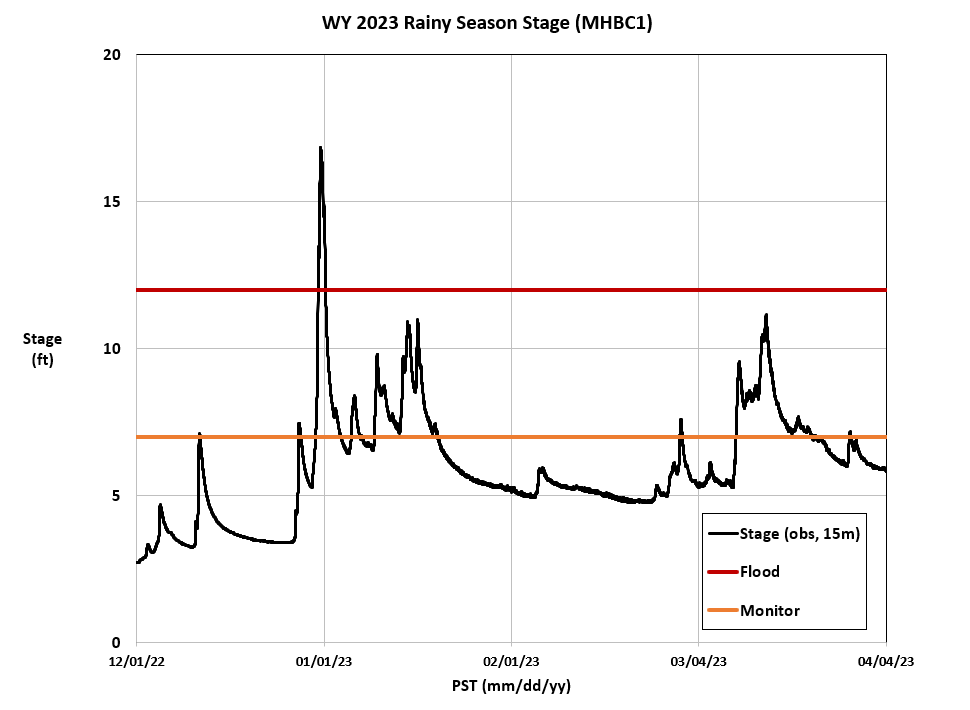
Downstream on the Cosumnes River at McConnell, there were complications with the stream gauge being out of service for portions of December, and also being relocated. This is reflected in the stage hydrograph shown in the figure below. On December 31, 2022 at 12 AM PST, the Cosumnes River at McConnell reached 0.8 feet above flood stage. This may have been the peak, but no data is available for the next nine days to confirm. There were two additional dates in which the peak stage was below flood stage by only a small margin: 0.2 feet below flood on January 15, and 0.1 feet below flood on March 15. McConnell was above monitor stage five times for a total duration of 28 days. The table below summarizes all exceedances shown in the figure, providing values of peak stage, and exceedance duration. Note that there is no empirically-based rating curve for this location. As such, flow values for these events are not available. 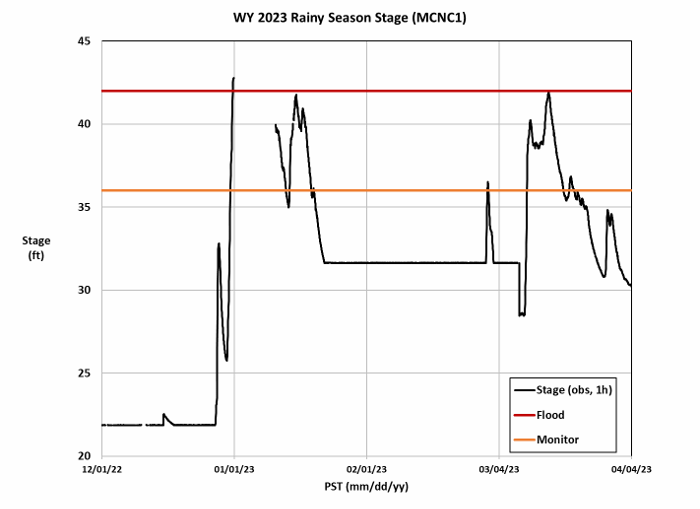
Cosumnes River - 2022/2023 New Year's Flood Event During the New Year's event, in which both Michigan Bar and McConnell exceeded flood stage, water leaving the Cosumnes River in typical areas along with levees at multiple locations being breached or overtopped resulted in flooding. Highway 99, which crosses the Cosumnes River near the McConnell gauge, was flooded and was closed between the City of Elk Grove and Galt. Dozens of motorists were stranded and two deaths resulted. Highway 99 was also partially closed (only one lane open) in the City of Sacramento between Fruitridge and Florin roads. The community of Wilton, which lies along the south side of the Cosumnes River and upstream of McConnell, was also ordered to evacuate. The majority of the precipitation fell within a three-day period from December 30, 2022, to the end of January 1, 2023. The table below lists the measured precipitation at 8 gauges for this 72-hour period.
As part of regular forecasting operations, the CNRFC estimated the 6-hour mean areal precipitation (MAP) for subbasins upstream of Michigan Bar. These were combined to obtain the 6-hour MAP series for the entire watershed upstream of Michigan Bar. This series and the hourly flow hydrograph at Michigan Bar are shown in the figure below. The total storm MAP was 11.1 inches (from 12/29 16:00 to 01/02 10:00 PST) with a peak 6-hour MAP value of 2.2 inches. A distinguishing characteristic of the MAP series is that an average intensity of 1.9 inches per 6 hours (0.3 inches per hour) was sustained over an 18-hour period (12/30 16:00 to 12/31 10:00 to PST), resulting in 5.7 inches in the 18-hour period. The SWE in the watershed was estimated at 2 inches at the beginning of the event, and about 1.8 inches at the end. The computed rain-snow elevation varied from about 5,000 feet at the beginning of the event, to 8,000 feet during the period of greatest precip, and down to about 4,000 feet after the event. Overall, rainmelt was a small contributor to the event with snow present in only the uppermost elevations of the watershed. 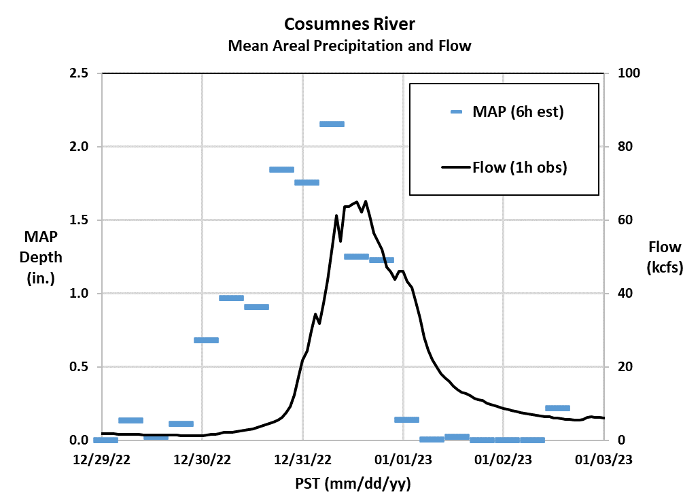 On the morning of December 28, 2022, CNRFC forecasted flood stage exceedance at Michigan Bar to occur on December 31, 2022 (left figure below). The magnitude and shape of the forecast hydrograph remained fairly unchanged until the morning of December 30, the day before the flood exceedance. On the morning of December 31, when flows had increased more rapidly than forecast and flood stage had already been exceeded, the forecast better reflected the magnitude of the event (right figure below). In Figures 4a and 4b, the green dashes represent the forecasted 6-hour watershed average of rain plus snowmelt. Comparing these to the blue dashes, which represent 6-hour observations (estimates), it is clear that the forecast 18-hour period of intense precipitation was underestimated in the earlier forecasts. Click on the images below to enlarge and open in a new tab. 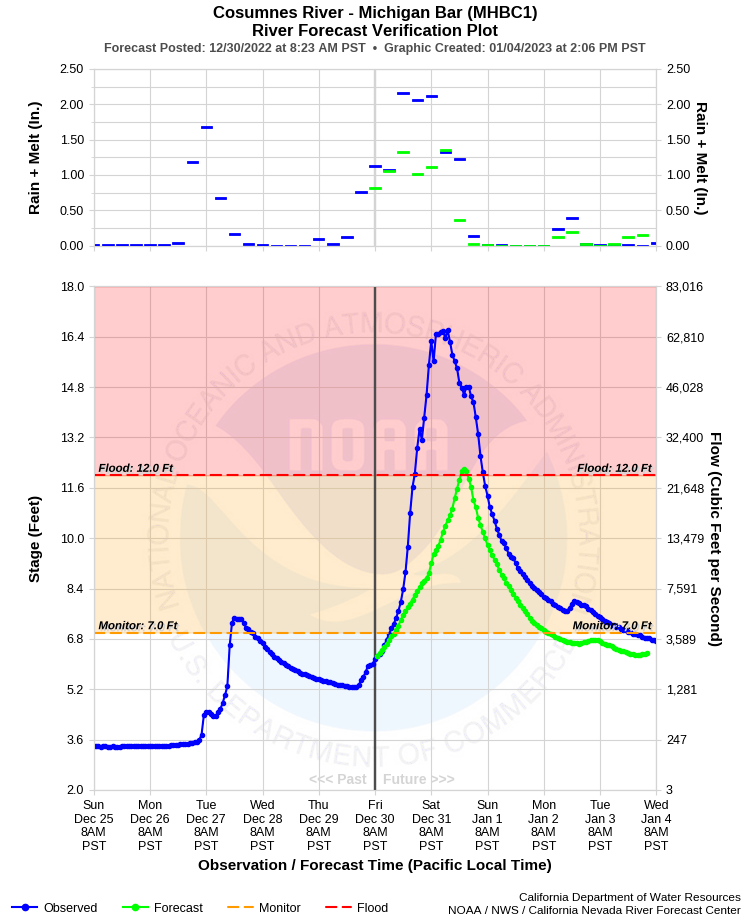 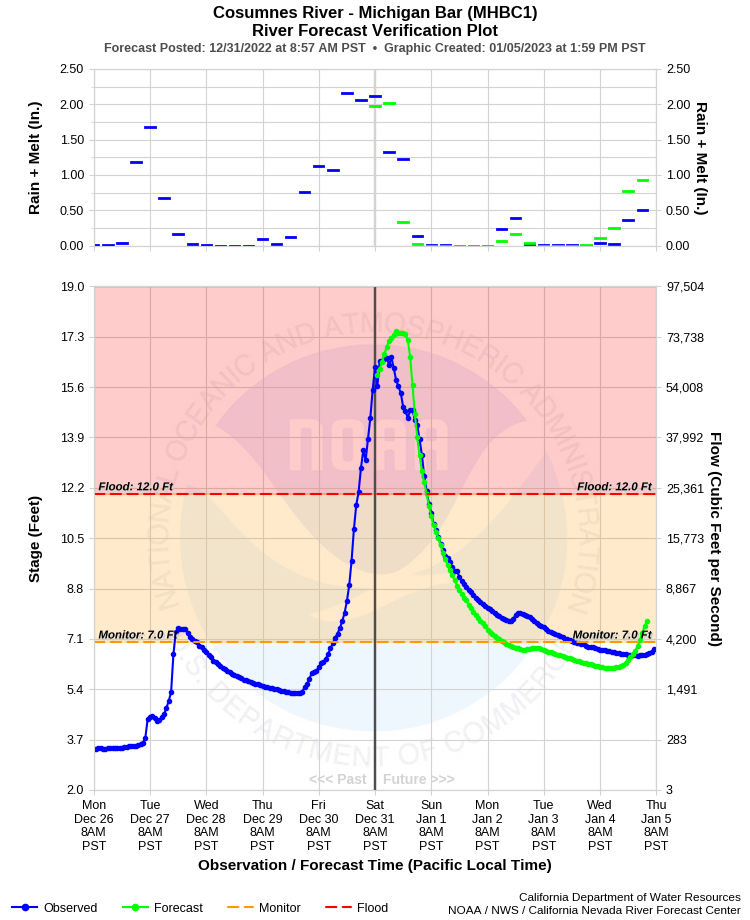 The flow downstream at McConnell consists primarily of flow routed downstream from Michigan Bar. The routed flow is subject to channel losses and attenuation. During this event, the hydrograph at McConnell was likely also reduced due to levee failures. On December 28, 2022, the morning forecast predicted exceedance of monitor stage to occur on late December 30, 2022 (left figure below). The shape and timing of the forecast hydrograph compared well with observed, but the volume and peak were low. Not until the morning forecast of December 31, 2022 (right figure below), was flood stage exceedance forecast for later in the day. The cause of the early low forecasts at this location was again the under forecast of the 18-hour period of the most intense precipitation, which resulted in the low forecast hydrograph at Michigan Bar being routed down to and driving the forecast at McConnell. Note that observed flow hydrographs (blue) in the figures below do not have flow values on the 2nd y-axis, as the location does not have an empirical rating curve. Click on the images below to enlarge and open in a new tab. 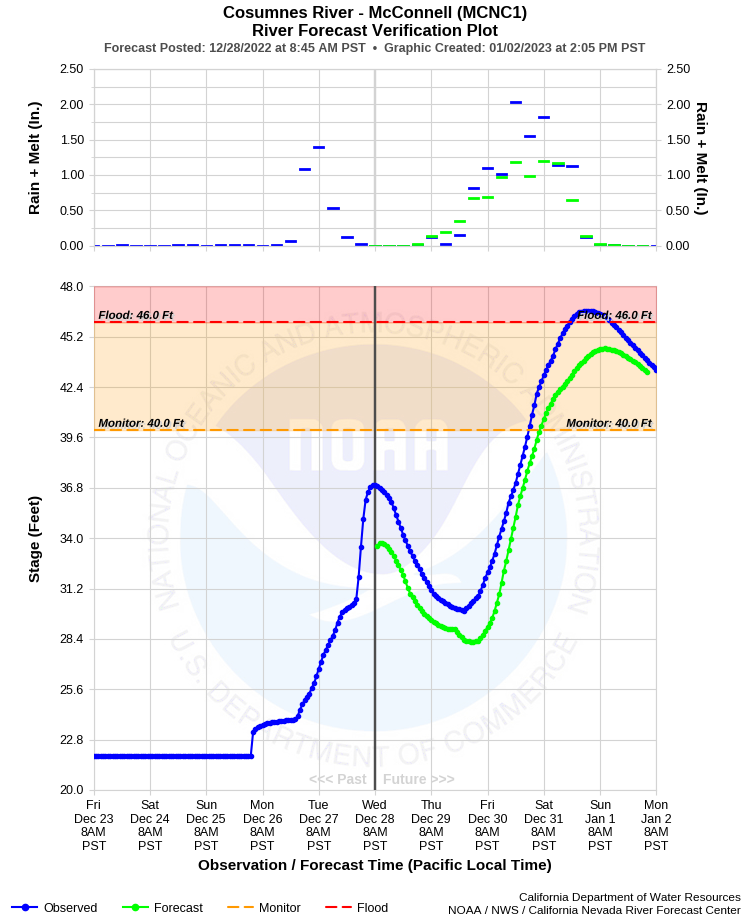 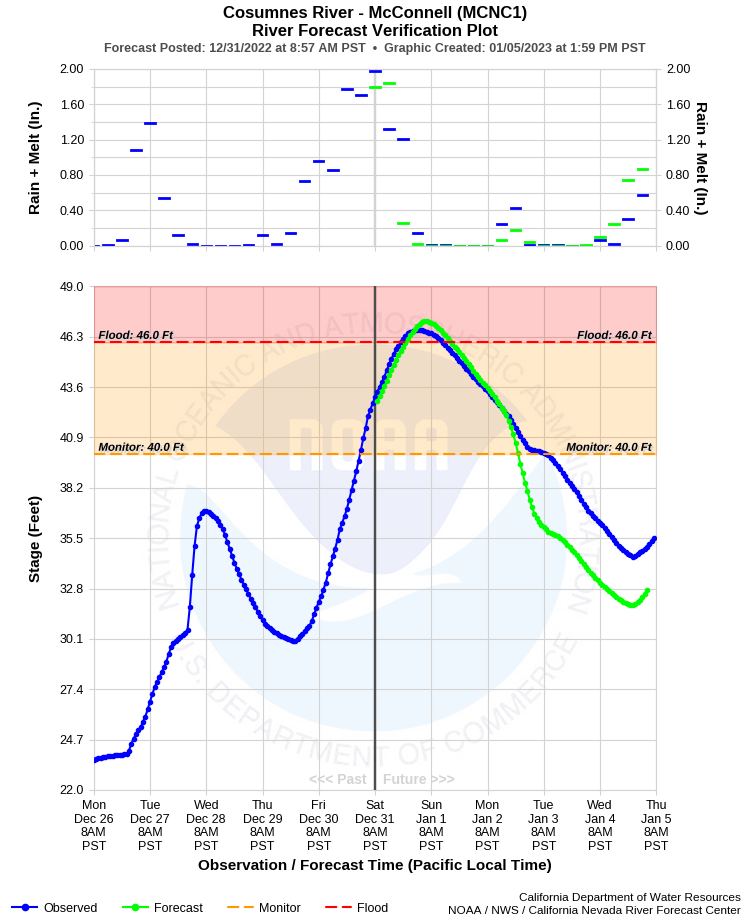 Bear Creek Summary The CNRFC has one official forecast location on Bear Creek: McKee Road. The Bear Creek watershed above McKee Road consists of 206 square miles ranging from 174 to 4,190 feet in elevation. Reservoirs providing flood protection include Bear Creek Reservoir and Burns Creek Reservoir. Identifiers for the stream and pool gauges used in this discussion are provided in the table below.
The figure below shows the stage at McKee Road for the period December 2022 through March 2023. A summary of monitor and flood stage exceedances during this period is provided in the table below the figure. On January 10, McKee Road exceeded flood stage by 3.2 feet, and remained above flood stage for 20 hours. There were three additional events in which monitor stage was exceeded, for a combined duration of 5 days. 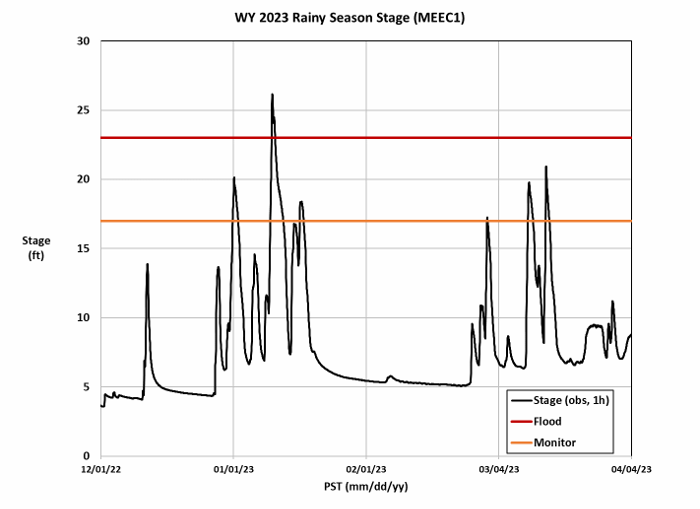
Bear Creek - Early January 2023 Flood Event During this event, in which flood stage was exceeded at McKee Road, Bear Creek overtopped its banks in the city of Merced. Residents living between M and G streets were under mandatory evacuations by city officials. The Merced County community of Planada, CA, which has a population of about 4,000 people, was evacuated due to rising waters. Other residential areas were also given evacuation warnings. Numerous road closures were in place around the city and the county due to flooding. All classes in the Merced City School District and Merced Union High School District were canceled. The majority of precipitation fell within the three-day period from January 8, 2022 to the end of Jan 11, 2023. The table below lists measured precipitation at 5 gauges for this period.
The CNRFC estimated the 6-hour MAP for the combined subbasins upstream of McKee Road. These were combined to obtain the 6-hour MAP series for the entire upstream watershed. The 6-hour MAP series and the hourly flow hydrograph at McKee Road are shown in the figure below. The total storm MAP was 6.5 inches (from January 7 16:00 to January 11, 2023 10:00 PST) with a peak 6-hour MAP value of 1.8 inches. There was no snow in the watershed during the event. 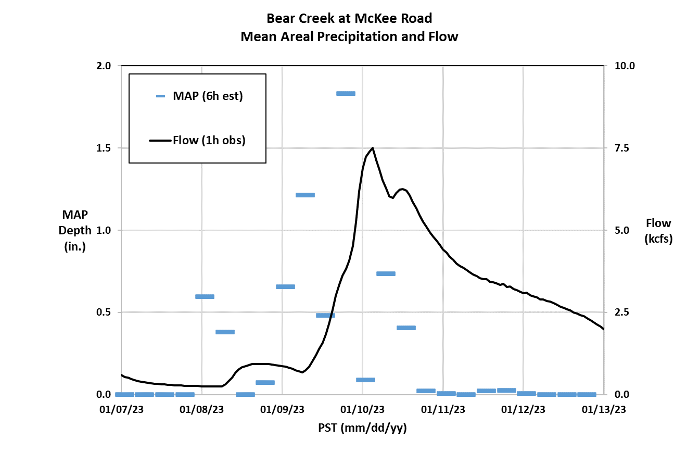 Upstream of McKee Road, Burns Creek Reservoir peaked at 1.34 feet above the spillway crest, while Bear Creek Reservoir peaked 7.3 feet below the spillway crest. The peak combined storage of the two reservoirs peaked at 13,500 ac-ft (figure below). 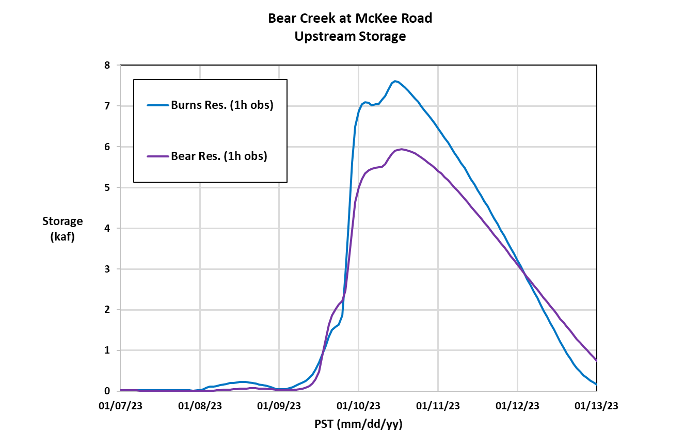 On January 6, 2022, the CNRFC forecasted Bear Creek at McKee Road to exceed flood stage on January 9 (left figure below). The forecast on the morning of January 9 (right figure below), was more sharp and predicted the rapid rise that would continue through the day, as well as captured detail in the shape of the hydrograph while near flood stage. Overall, the forecast at this location was very good and provided 3 days of lead time. Click on the images below to enlarge and open in a new tab. 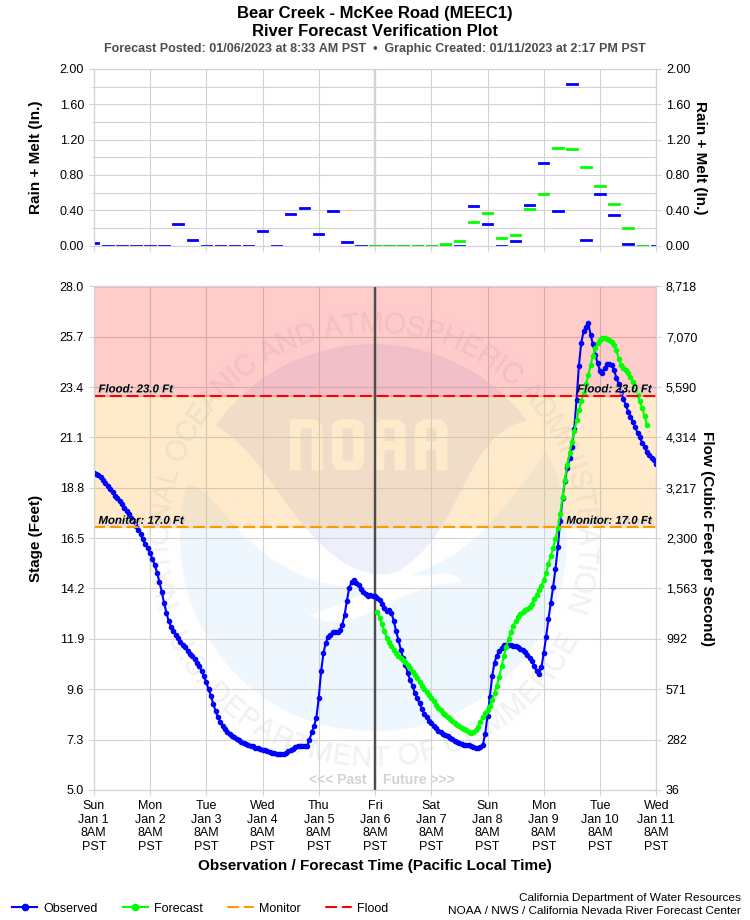 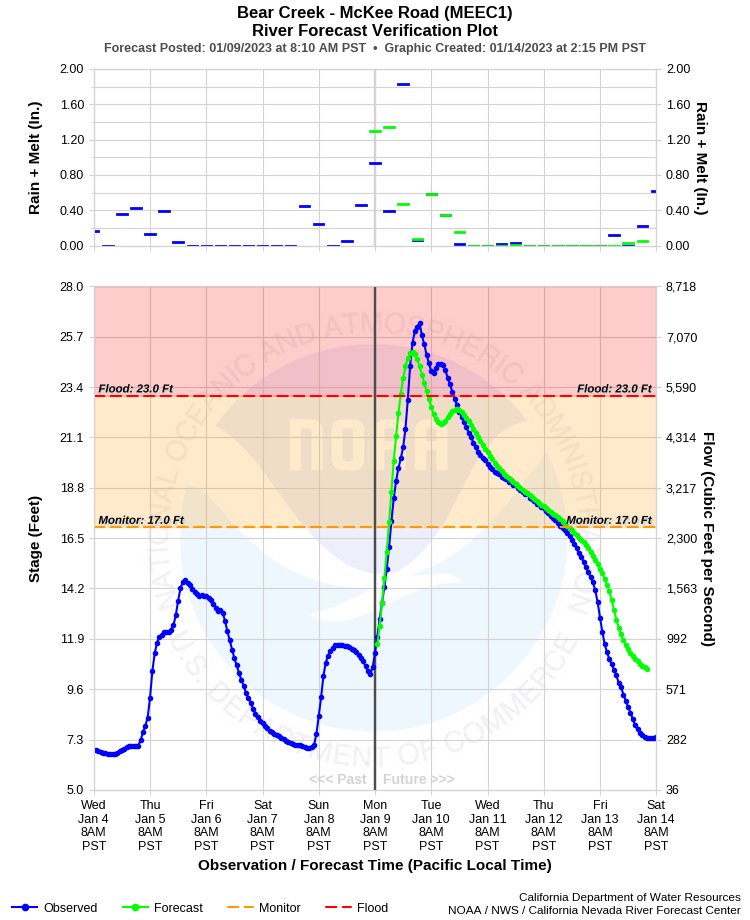 Salinas River - January 2023 Flood Event The January 9-10 event that hit the Salinas basin resulted in extremely large 24-hour precipitation totals, including a maximum of over 6 inches in the Salinas headwater basin (PRBC1 - Paso Robles). A nearby long-term precipitation station at San Luis Obispo reported 6 inches on January 9, breaking a 130-year-old record. Precipitation was under-forecast, resulting in a low streamflow forecast at PRBC1. The graphic below shows the underpredicted streamflow and precipitation forecast from the early morning hours of January 9 (green) compared to the observed (blue). Click on the image below to enlarge and open in a new tab. 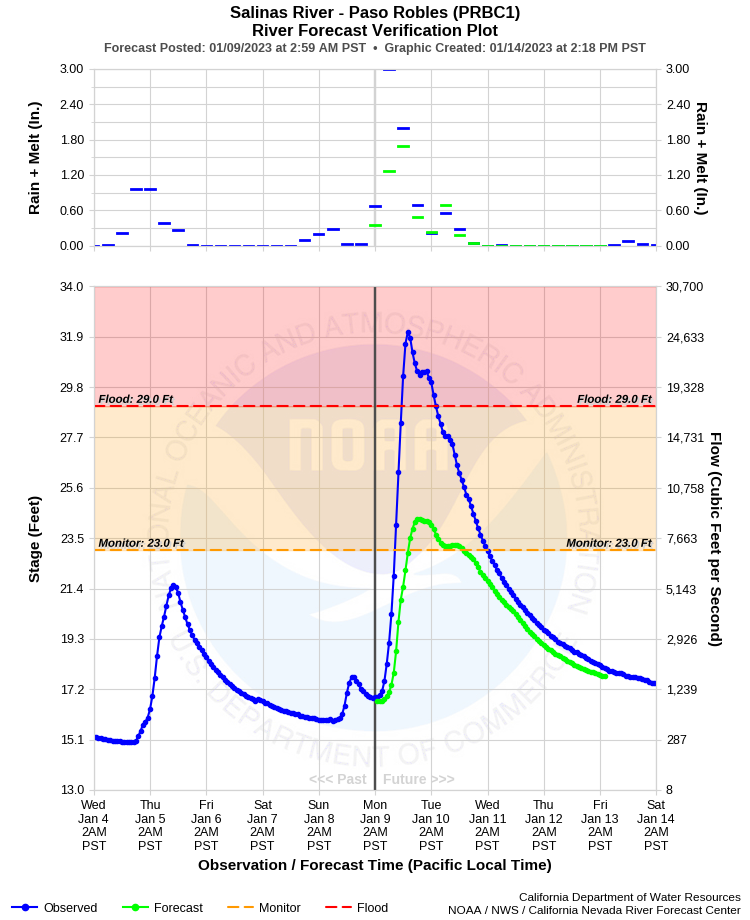 Many hydrologic issues also influenced forecast quality, especially for locations further downstream on the Salinas. Understanding of the relationship between river stage and discharge was constantly evolving throughout the event. Below are two rating curves for the Salinas River at Bradley. The peak flow estimate at Bradley changed from roughly 60,000 cfs to about 45,000 cfs once a streamflow measurement was taken, and a new rating curve was updated on January 11th. This change in streamflow volume directly impacted downstream forecasts. Long-term changes in channel roughness and geometry (scour and deposition) led to the issuance of updated rating curves throughout the event at many downstream locations including Bradley, Soledad, Chualar, and Spreckels. 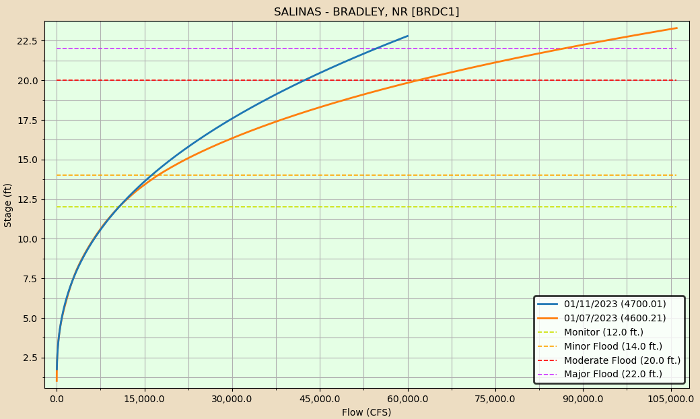 Gauge outages also occurred, most notably at Bradley and Soledad, further complicating peak streamflow prediction. The graphic below shows the gauge issues at Bradley that occurred around the peak. Flow estimates became unreliable in the early morning hours of January 10 and remained much of the day. 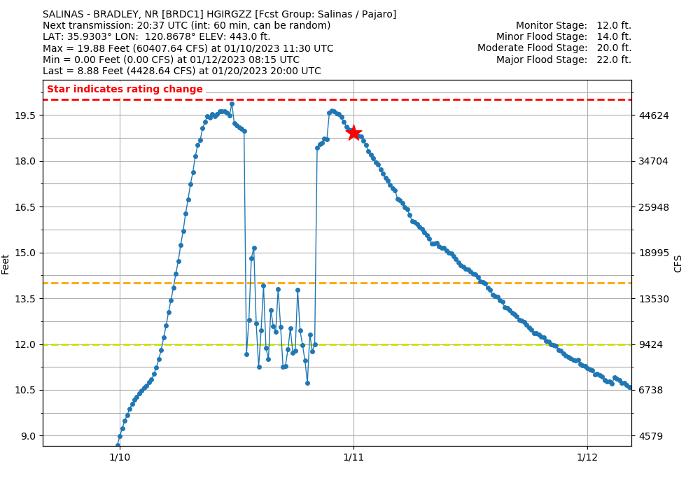 Channel and floodplain losses presented a third hydrologic factor affecting river forecasts. Three consecutive extremely dry years left a large groundwater deficit in the Salinas basin. A large amount of water in the channel recharged local aquifers, resulting in much lower flows downstream. Numerous levee breaches resulted in further flow decreases. These two items were probably the most important in the overprediction of flows at Soledad. CNRFC staff estimated roughly 50-60% volume loss between Bradley and Soledad for the January 10-12 period. The same reach also presented challenges in the form of travel time. The Salinas had seen litle sizeable flow in many years, allowing bankside vegetation to propagate. During this event, that vegetation had the effect of increasing friction and reducing the river's downstream speed. All these factors resulted in significant hydrologic uncertainty when forecasting for downstream locations like Spreckels. While the Salinas headwaters were generally under forecast, forecast peak stages in the lower reaches were too high and too early. The significant volume loss, rating curve changes, and vegetative growth in the channel all played a role in the forecast error. This is evident in the morning forecast on January 10. Click on the image below to enlarge and open in a new tab. 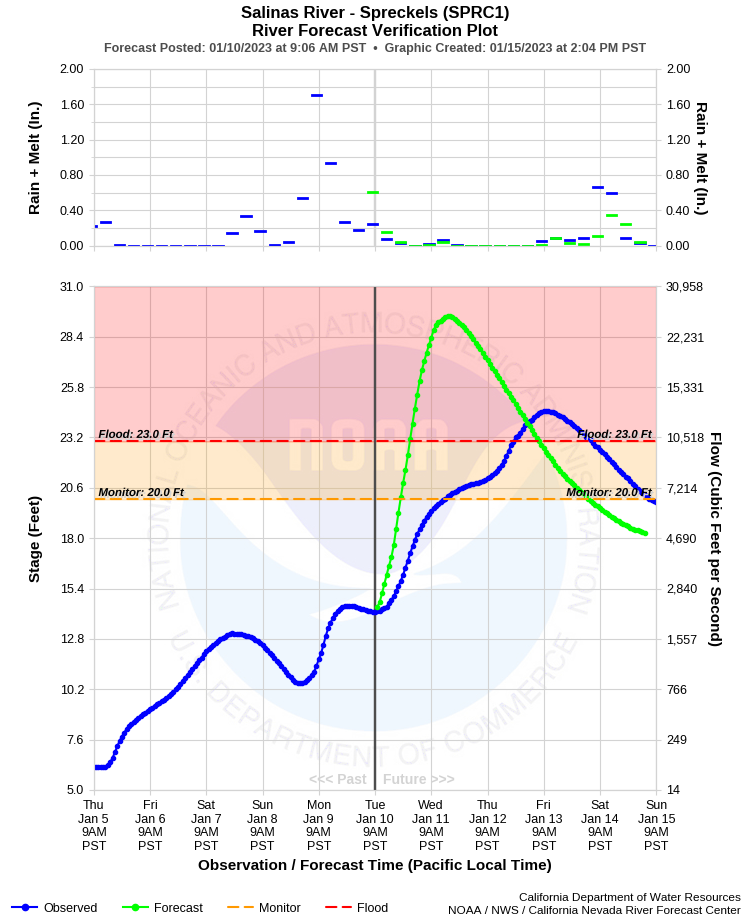 Upon identifying and understanding these factors, forecasters were able to adjust and improve subsequent predictions. However, forecasts at Spreckels continued to be overdone for most of the event. Further flooding along the Salinas in January and additional flooding in March made an economic impact, primarily agricultural. See late February and March 2023 storm summary for more information. Click on the image below to enlarge and open in a new tab. 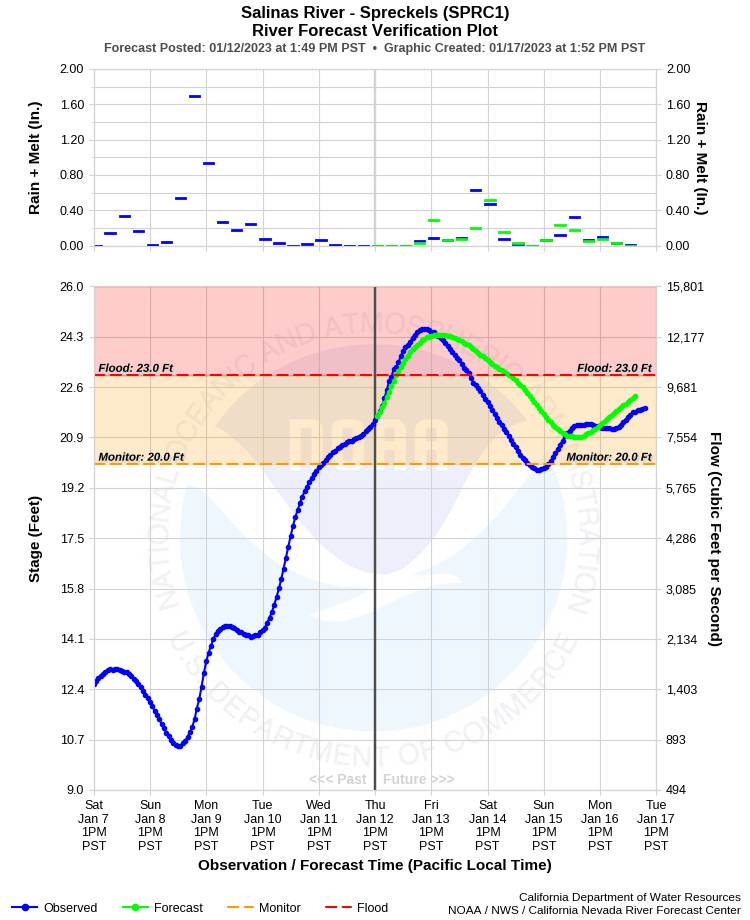 Pajaro River - January 2023 Flood Event The Pajaro River also experienced high water during the January and March events. Similar to the Salinas, substantial volume loss was observed in the January event. Willow Creek and Tres Pinos Creek are headwater creeks that feed into the San Benito River upstream of Hollister. The January peak flows for Willow Creek at San Benito and Tres Pinos Creek were 2,800 and 4,700 cfs, respectively. However, the peak flow further downstream at Hollister was only 2,600 cfs. This was the main driver in the overprediction further downstream on the Pajaro River near Chittenden. Click on the image below to enlarge and open in a new tab. 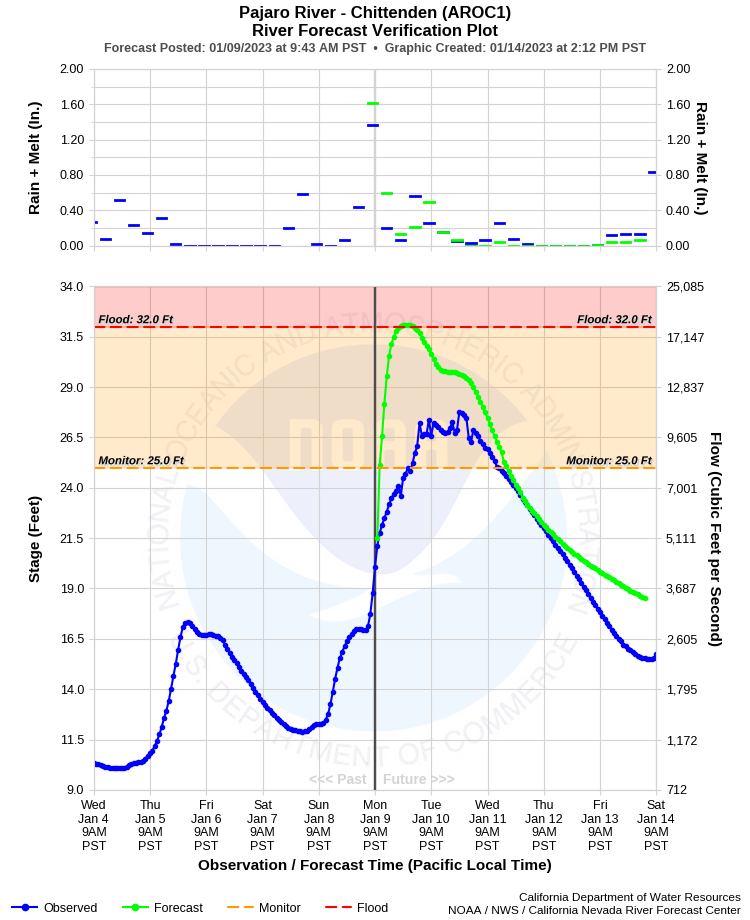 San Joaquin River Basin and Southern Sierra - River Conditions As of Water Year 2023, there were 9 official CNRFC forecast points for 4 major rivers (Stanislaus, Tuolumne, Merced and San Joaquin rivers) in the San Joaquin and southern Sierra area (see table below). With the impact of a series of AR events, the area received a total of 5-8 inches in the valley, 10-20 inches in the foothills and 20-30 inches in the mountains during the period from late December 2022 to mid-January 2023. However, with relatively dry soil conditions due to consecutive years of droughts, and the fact that reservoirs had larger deficits which were able to hold the incoming water, all forecast points in the area remained below flood stages during the period, with 3 of the forecast points on the San Joaquin River going slightly above monitor stages. The peak stages information and comparison with historical events are summarized in the table below. First, monitor stages were reached for three forecast locations (Newman, Patterson and Vernalis) along the San Joaquin River at the end of the period on Jan 17. Along the Merced River, the peak stage at Happy Isles (HPIC1) reached 5.2 ft on Dec 31, 2023, which is 2.8 ft below the threshold flood stage. The subsequent river rises were limited due to below-freezing temperatures in the high-elevation basins. In addition, the peak stage for HPIC1 was also slightly below the peak stage observed during the recent storm event in Oct 2021, and was much lower than the peak stage during the significant flooding event that occurred in Jan 1997 (13.27 ft). Moving downstream, the Merced River at Stevinson peak stage reached 1 ft below the monitor stage at the end of the AR events on Jan 17. Similarly, Tuolumne River at Modesto (MDSC1) and Stanislaus River at Orange Blossom (OBBC1) also were below monitor stages for the event period. Overall, the observed peak stages for the forecast locations were relatively low compared to historical or recent flood events, aided by the fact that reservoirs were able to hold the water during the storm period without making huge releases. The flooding impacts near the forecast locations in the area during this period were limited.
San Joaquin River Basin and Southern Sierra - Reservoir Conditions The table below summarizes the storage percentage and the deficit for the reservoirs before and after the series of ARs that occurred between the period of Dec 25, 2022, to Jan 17, 2023. Given the dry antecedent conditions, reservoirs in the southern Sierra area had a wealth of storage deficits at the beginning of the wet season. Therefore, even with a large amount of water brought by the ARs coming into the rivers, most upstream reservoirs were able to hold the incoming water and make controllable releases. For example, as shown in the table below, the total storage gain during the period for Don Pedro Reservoir (NDPC1) was 462,335 acre-feet (22.8% of storage capacity), with the observed daily average inflow peaking at 22,250 cfs on Jan 10, 2023. However, the maximum daily release outflow was 2,787 cfs (12.5% of the peak inflow), and was only 22.8% of the water year maximum daily outflow later in the snowmelt season. Don Pedro Reservoir increased releases to 5,000 cfs right after the event, indicating it was able to hold much of the water during the active AR period and delay larger releases into the Tuolumne River.
Reservoir conditions (percent full, inflow, and outflow) are displayed below. The highlighted period is from Dec 25, 2022, to Jan 17, 2023 which marked the beginning and end of the series of the storms. Click on the image below to enlarge and open in a new tab. 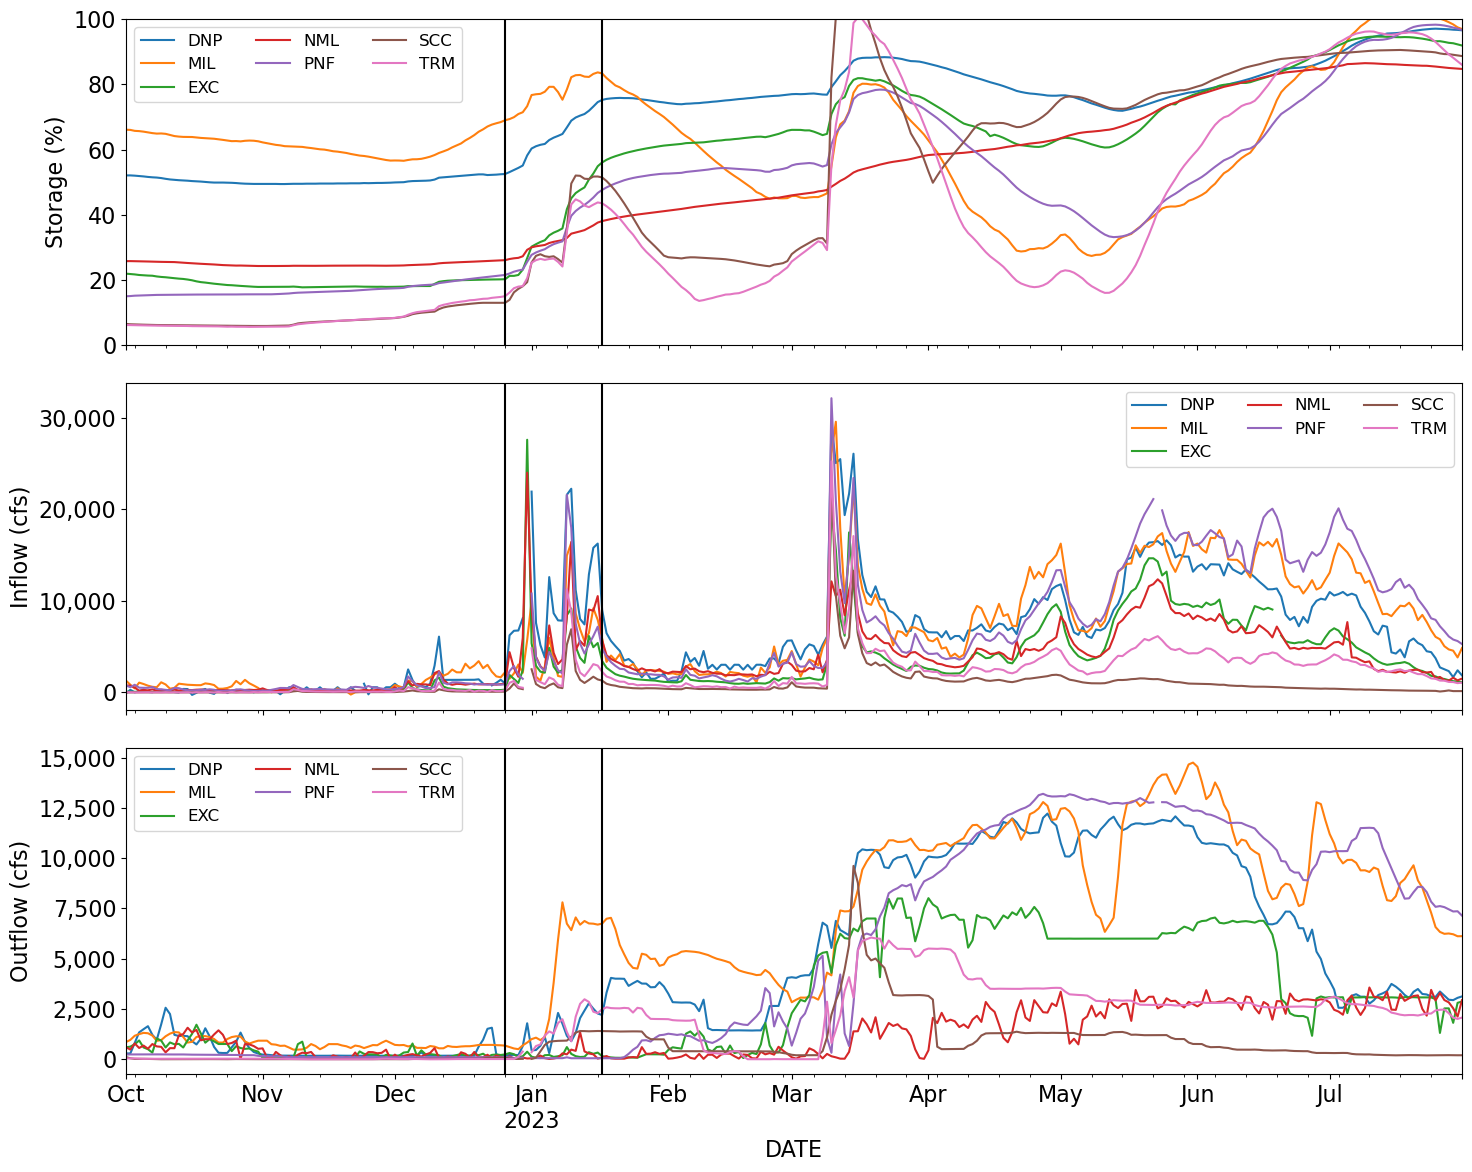 Southern California Many CNRFC forecast locations in southern California have small catchments an exhibit fast hydrologic responses. During the very active period from late December 2022 through March 2023, the January 9-10 storm proved most impactful in terms of flooding for many locations. Numerous forecast points across the area exceeded flood stage during this event, including the Sisquoc River at Garey, Sespe Creek at Fillmore, Ventura River at Foster Park, and the Santa Ynez River at Narrows. Other locations further south reached flood stage in a subsequent storm on January 14-16 that mainly impacted watersheds south of Los Angeles. Flooding on the Ventura River at Foster Park (VRVC1), where flood stage was exceeded by more than 7 feet on the afternoon of January 9, deserves special attention due to the large difference between forecast and observed stage/flow shown in the hydrograph below (click on the image to enlarge and open in a new tab). Initial flow estimates from the USGS gauge showed the river peaking at over 45,000 cfs, while the forecast peak was closer to 20,000 cfs. However, there remains a great deal of uncertainty regarding the peak and near-peak flows. As of this writing, the USGS has removed these estimated flows pending rating curve development (second image below). The last data point prior to the peak had an estimated flow of approximately 26,000 cfs, much closer to the forecast flow and far less than the initial peak estimate from the USGS. 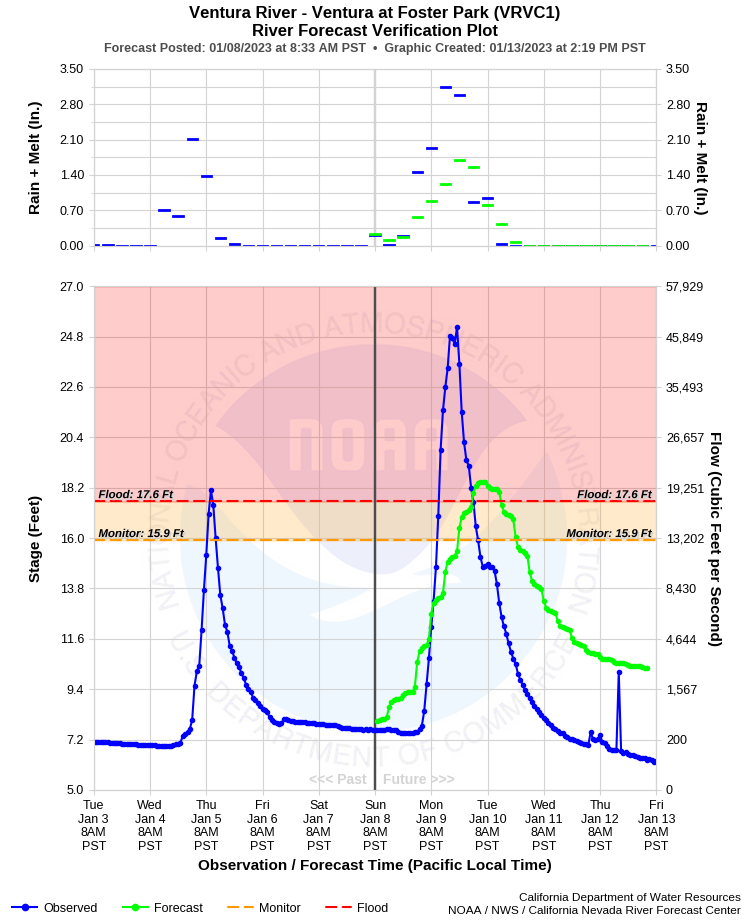 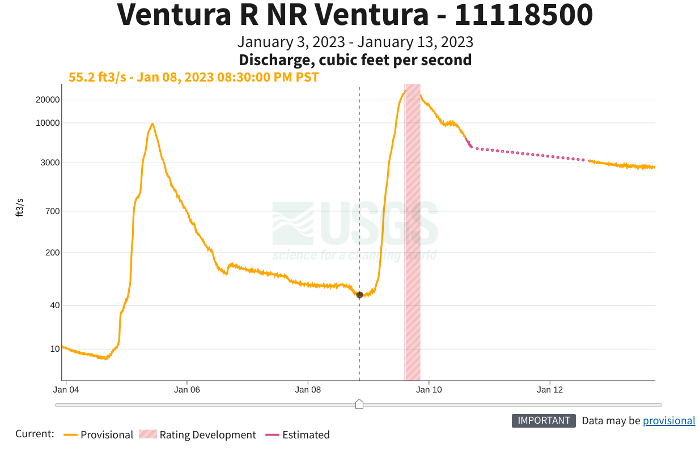 The Santa Ynez River at Narrows (NRWC1) also saw major impacts. Upstream of the gauge, Cachuma Lake added approximately 90,000 acre-feet of storage and rose more than 40ft in the 2 days from January 9 to 11. The lake later filled for the first time since 2011. Outflows during the event were minimal, around 2,000 cfs at the peak, and were not a major contributor to the flooding experienced downstream. However, in a subsequent event in late February, outflows increased to as much as 25,000 cfs, which produced a peak similar to the early January event on the Santa Ynez River at Narrows. The forecast flow at NRWC1 was roughly 1/3 of the observed peak flow on January 10 due to a dramatic under prediction of precipitation. The image below shows forecasts in green and observations in blue. Note the predicted amount of precipitation in the upper portion of the image. QPF for the 12-hour period beginning in the early morning of January 9 called for approximately 1.5", while the observations were estimated at more than 6" over the watershed. Click on the image below to enlarge and open in a new tab. 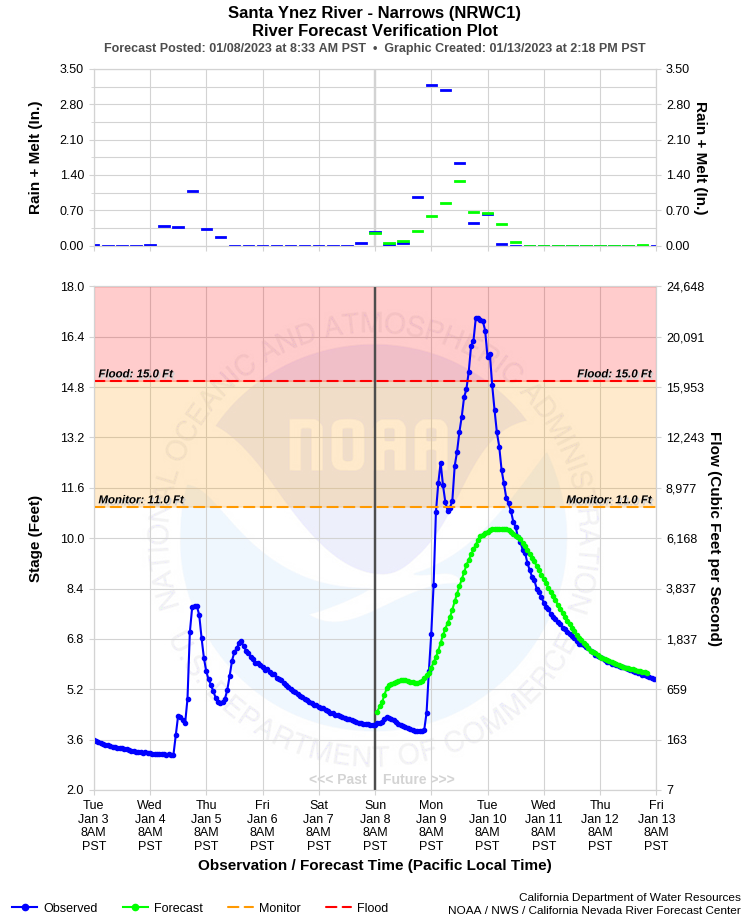 In addition to the heavy rain and flooding in Southern California, significant amounts of snow accumulated in the higher terrain during the winter. Heavy snow in late February left some residents trapped in their homes for over a week in the San Bernardino Mountains. Roads became impassable for extended periods of time as new snow accumulated faster than road crews were able to plow. Winter 2022-2023 QPF Verification Summary CNRFC meteorologists create gridded QPF out to 6 days with a temporal resolution of 6 hours. The CNRFC domain is divided into 17 river forecast groups (see image below showing the boundaries of each forecast group), with QPF and river forecasts issued at least once daily in the morning (12Z issuance) and also in the afternoon (18Z issuance) on weekdays during the winter operations season (November 1 through April 15) with additional forecasts issued on an as-needed basis. CNRFC hydrologists generate a gridded quantitative precipitation estimate (QPE) grid every morning by quality controlling observed precipitation data at just over 1,000 gauges located across the CNRFC domain. CNRFC QPE was compared to the CNRFC QPF, NBM (National Blend of Models), GFS (Global Forecast System), and WPC (Weather Prediction Center) for verification of the river forecast groups and individual stations for the period from December 1, 2022, through March 31, 2023. Verification statistics were created for the Mean Absolute Error (MAE), Root Mean Squared Error (RMSE), and Percent Bias (PBIAS) where the QPE was greater than 0.00". Heidke Skill Score (HSS) was also used to evaluate precipitation amounts. If QPE was greater than 0.00", and the QPF was within the thresholds of 0.10" for 6 hours, 0.25" for 24 hours, or 0.50" for 72 hours, then the event was considered successful and true. If the QPF and QPE difference was outside the thresholds, then it was a miss and would count negatively. The focus for the verification this winter will be on CNRFC river forecast groups for Days 1-3 QPF, Days 4-6 QPF, and comparing the morning (12Z issuance) vs afternoon (18Z issuance) CNRFC QPF, and looking at newly-deliniated River Forecast Groups for the 2023 WY. Click on the image below for a larger version. 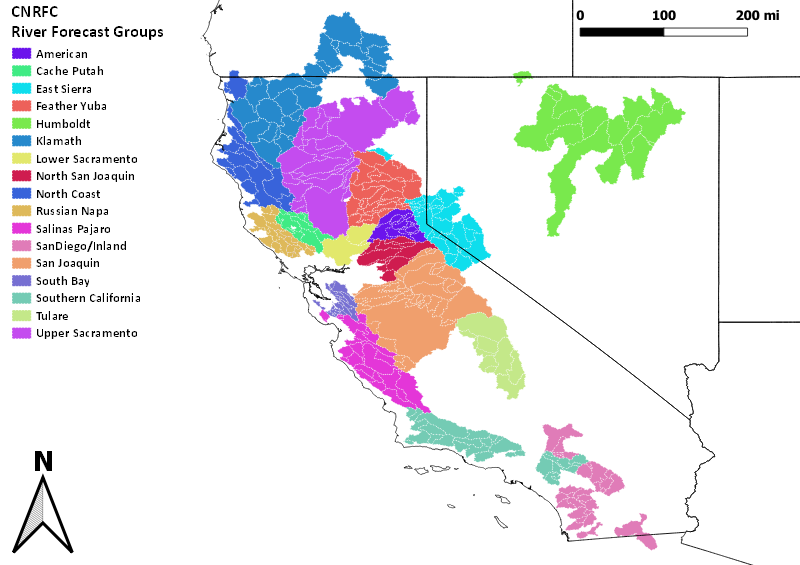 CNRFC River Forecast Groups: Days 1-3 Totals With three-day QPF totals useful to water resource managers, we will first look at the verification of the days 1-3 QPF. For all 17 river forecast groups, the NBM showed the most skill, using the HSS, compared to the CNRFC, WPC, and the GFS. The Humboldt forecast group showed the most skill for all sources with the GFS the least reliable. The Lower Sacramento forecast group came in second for the most skill, with the NBM and GFS showing more skill than the CNRFC and WPC. The GFS had the lowest MAE and overestimated the least in PBIAS. The Feather/Yuba river forecast group had the least skill and lowest HSS, with the NBM higher than the other sources, while also having the highest MAE. CNRFC and WPC overestimated QPF for all 17 river forecast groups, with the exception of a small under bias for the Southern California forecast group as seen in the PBIAS plot. The NBM and GFS showed underestimates in a few river forecast groups. These included Southern California for both the NBM and GFS. The Salinas/Pajaro showed an underestimate for the GFS. Also, small under bias was observed for the Russian/Napa, North Coast, and Tulare forecast groups in both the NBM and GFS, as well as the Salinas/Pajaro for the NBM, and South Bay for the GFS. In the East Sierra, all models highly overestimated in PBIAS. The NBM did the best in MAE and RMSE, but all sources were considered high. The Humboldt forecast group had the lowest MAE and RMSE (near 0) for all sources, while also slightly overestimating the QPF for PBIAS. The Feather/Yuba group had fairly high MAE and RMSE for all sources, but especially for the RFC and WPC. For the North Coast group, all sources had fairly high MAE and a little better RMSE, but the GFS performed the worst, while the CNRFC and NBM had little bias. The NBM and GFS showed a slight underestimate. The image below displays the 17 CNRFC river forecast groups' Mean Absolute Error (MAE) of QPF for four sources (12Z morning CNRFC, 12Z GFS, NBM, and WPC) versus the CNRFC QPE from December 1, 2022, through March 31, 2023. Click on the image below to enlarge and open in a new tab. 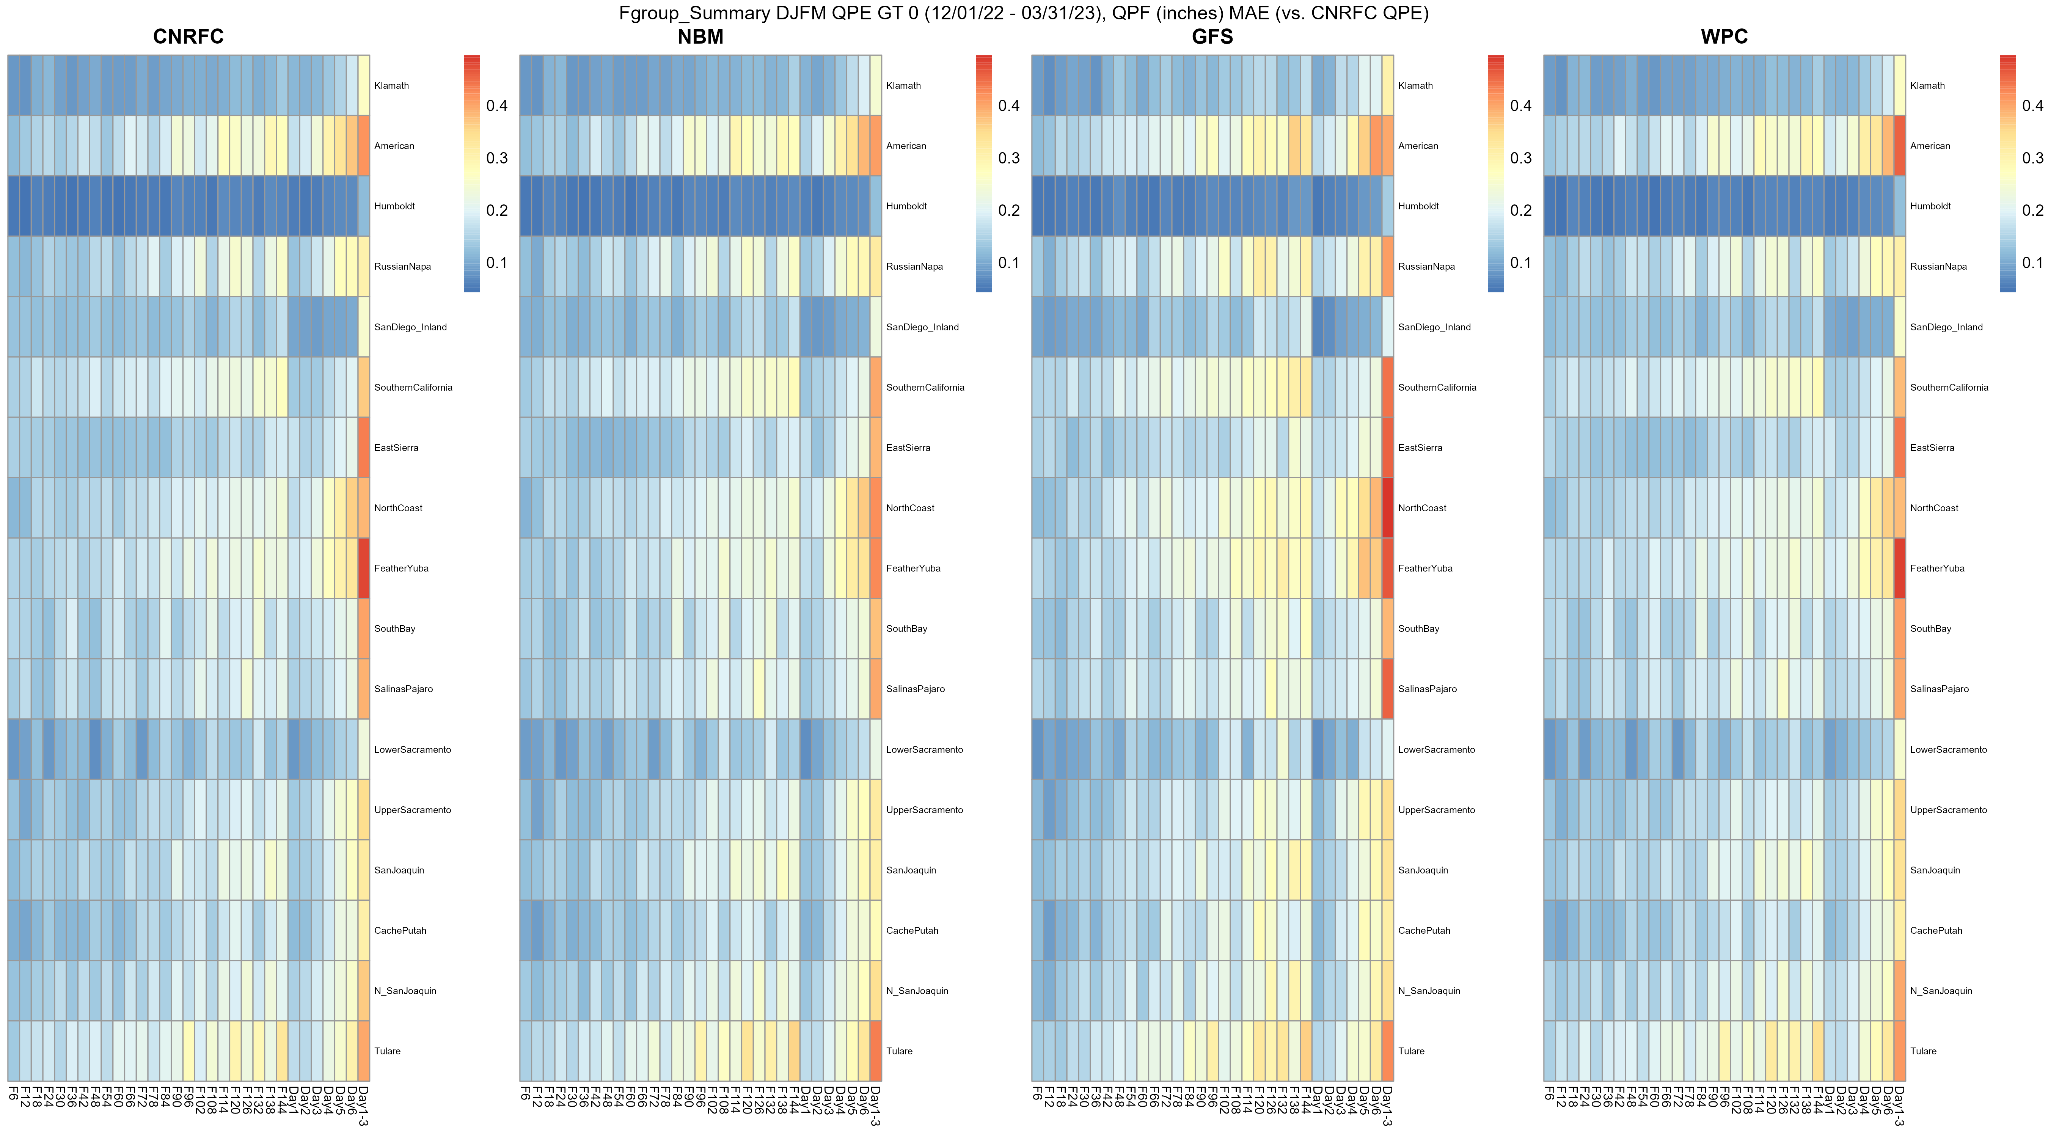 The image below displays the 17 CNRFC river forecast groups' Root Mean Squared Error (RMSE) of QPF for four sources (12Z morning CNRFC, 12Z GFS, NBM, and WPC) versus the CNRFC QPE from December 1, 2022, through March 31, 2023. Click on the image below to enlarge and open in a new tab. 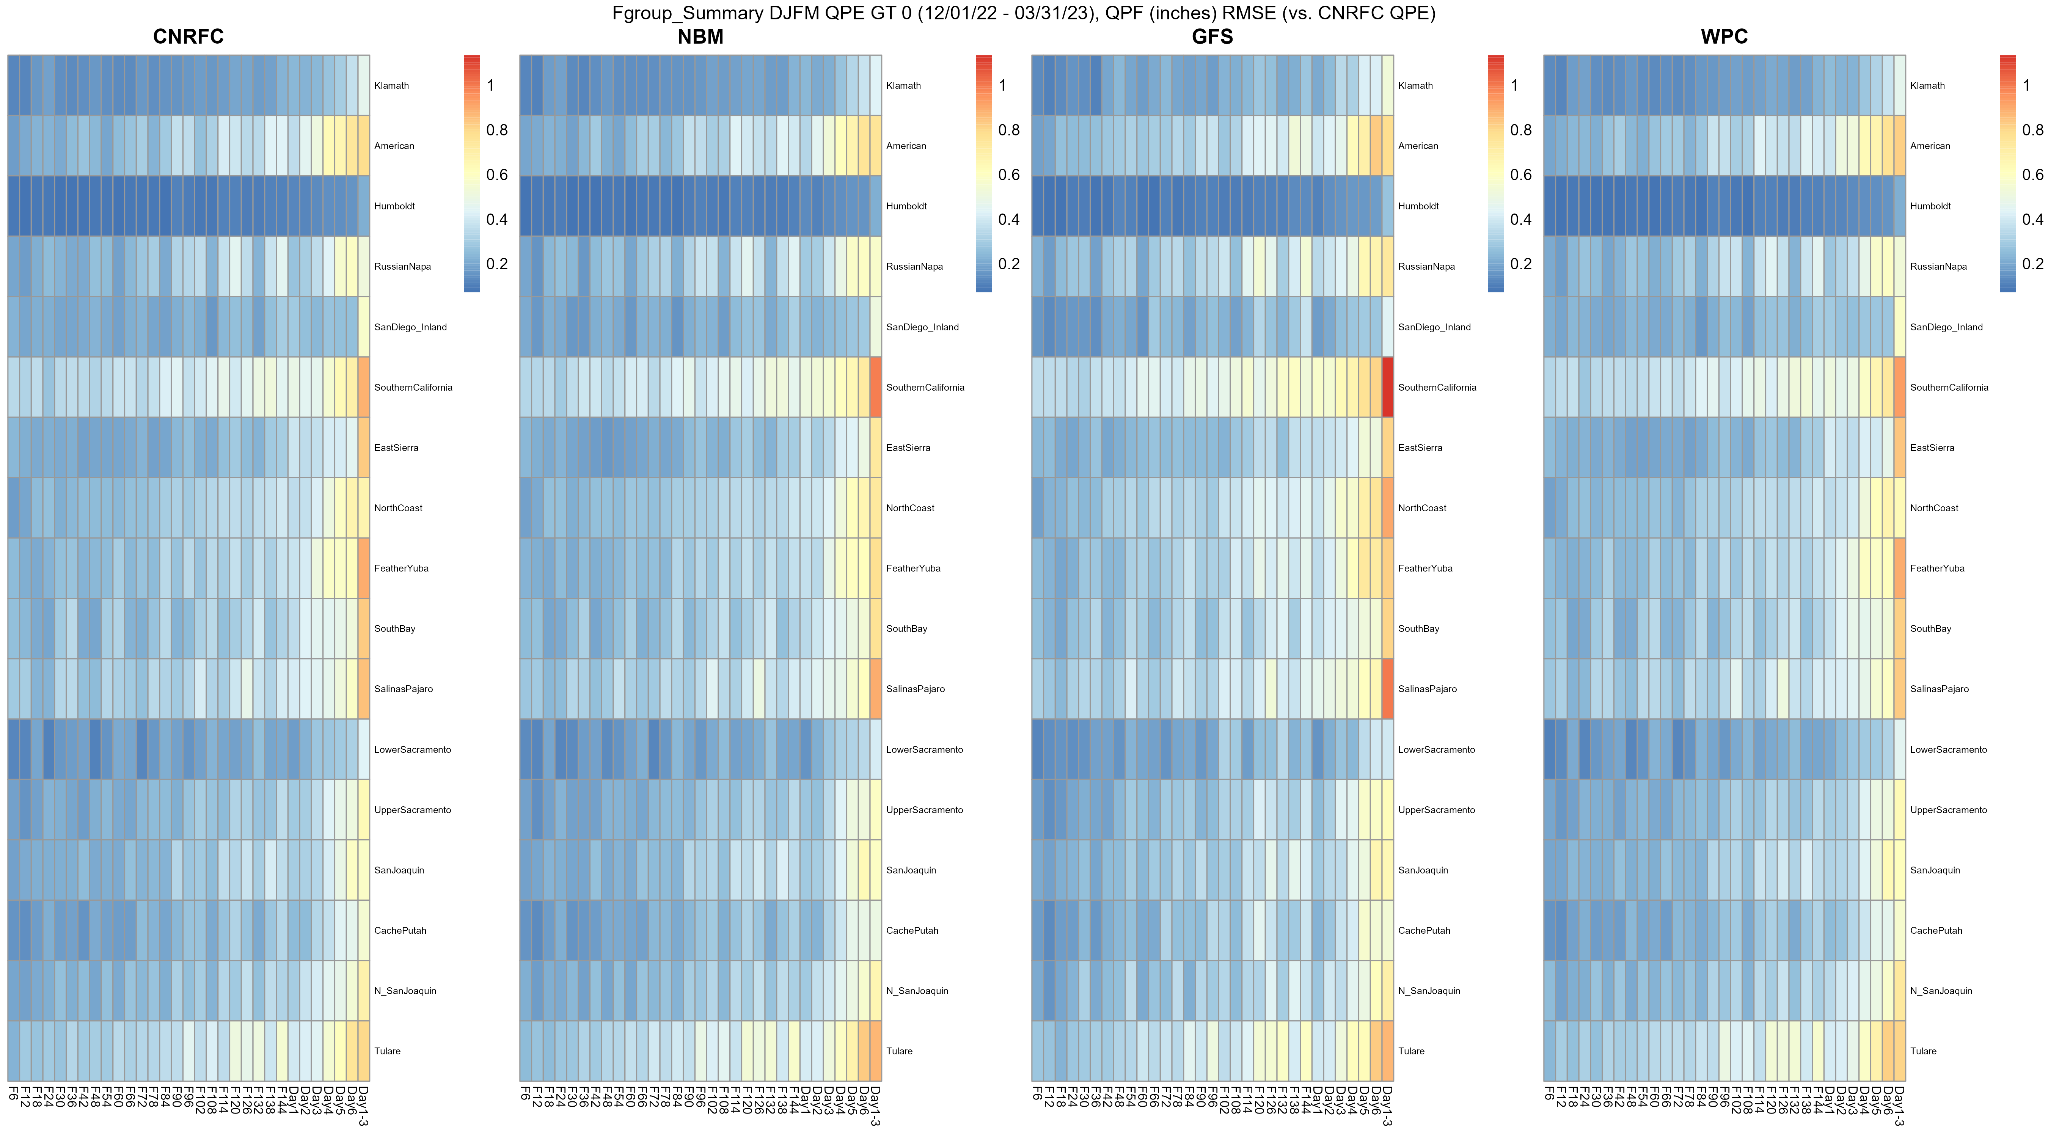 The image below displays the 17 CNRFC river forecast groups' Percent Bias (PBIAS) of QPF for four sources (12Z morning CNRFC, 12Z GFS, NBM, and WPC) versus the CNRFC QPE from December 1, 2022, through March 31, 2023. Click on the image below to enlarge and open in a new tab. 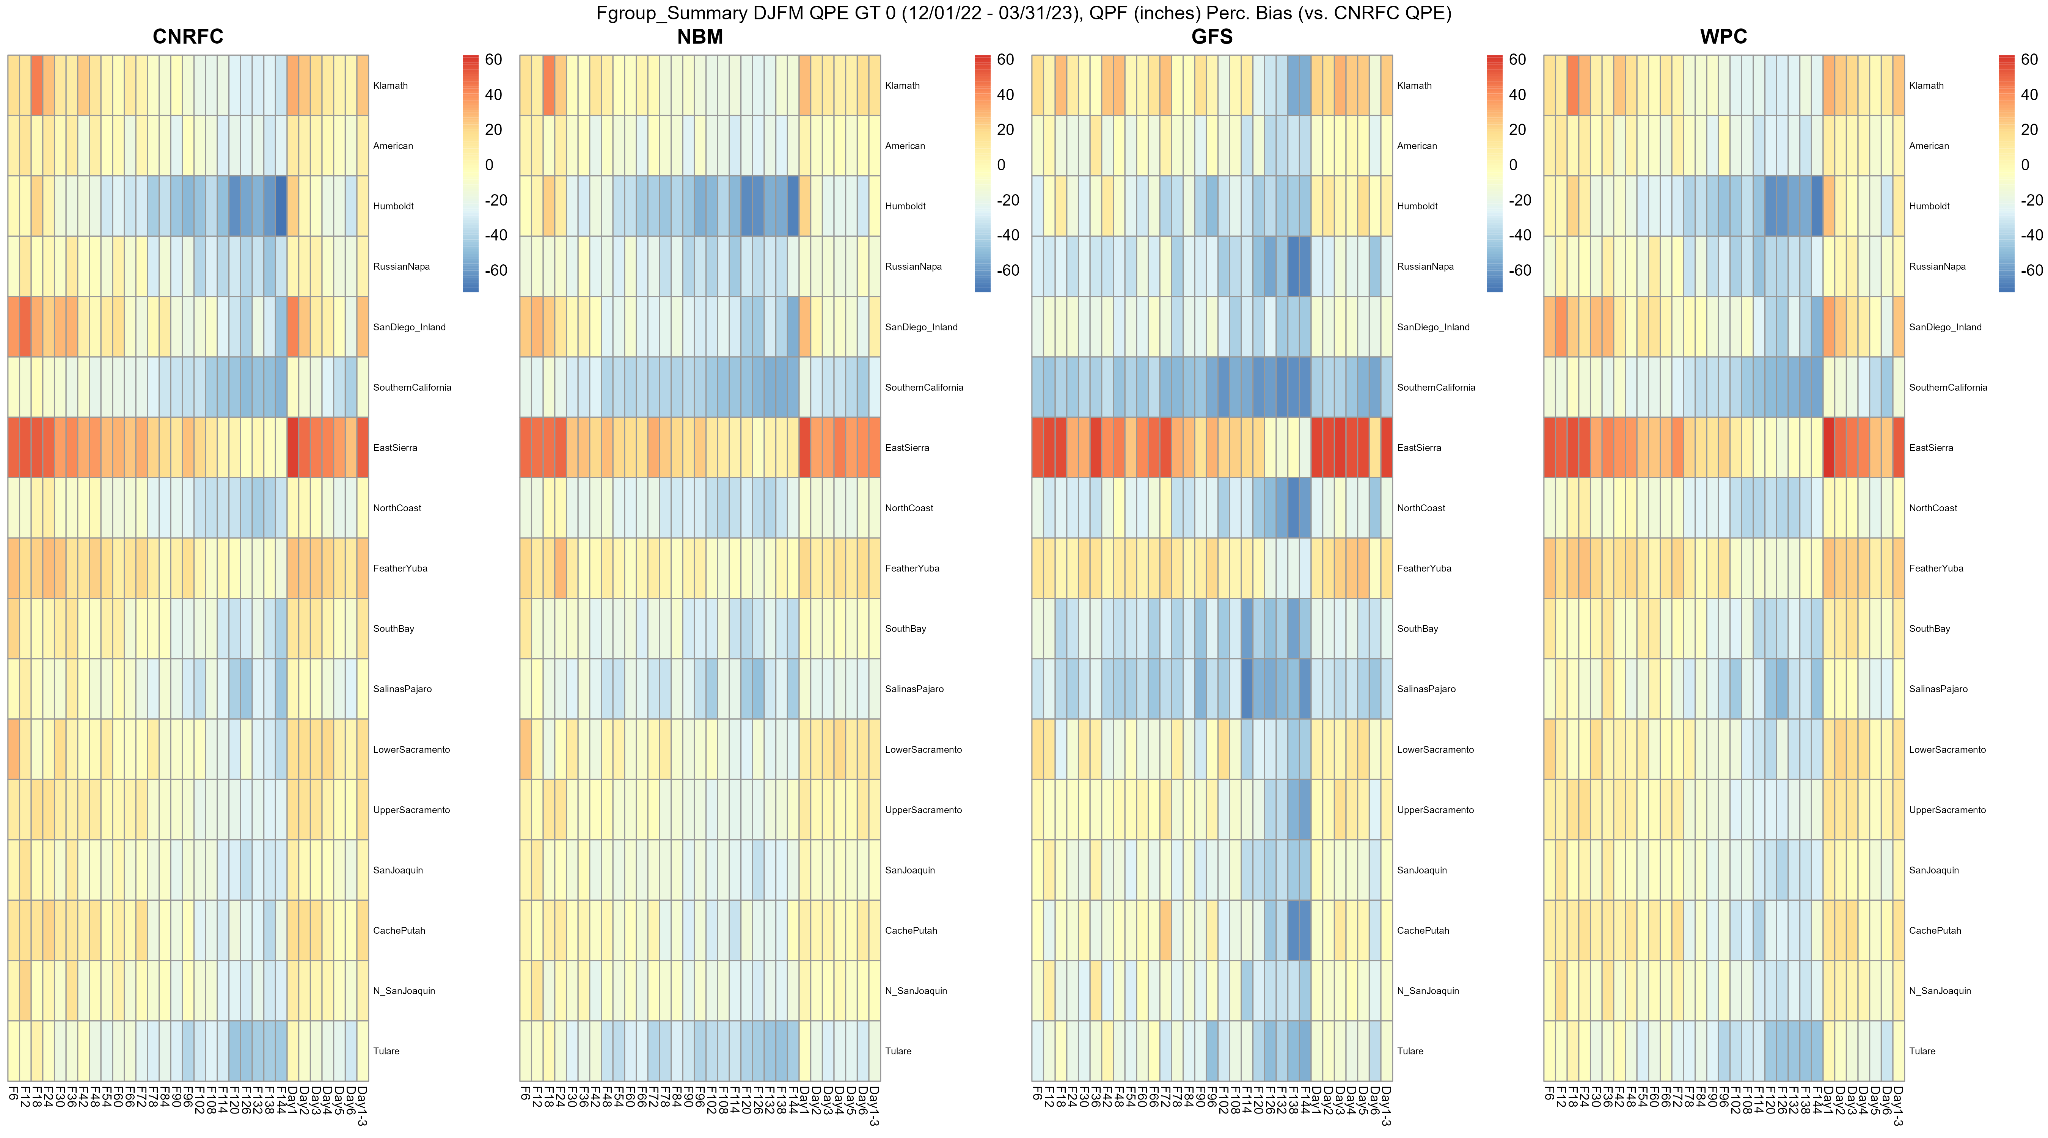 The image below displays the 17 CNRFC river forecast groups' Heidke Skill Score (HSS) of QPF for four sources (12Z morning CNRFC, 12Z GFS, NBM, and WPC) versus the CNRFC QPE from December 1, 2022, through March 31, 2023. Click on the image below to enlarge and open in a new tab. 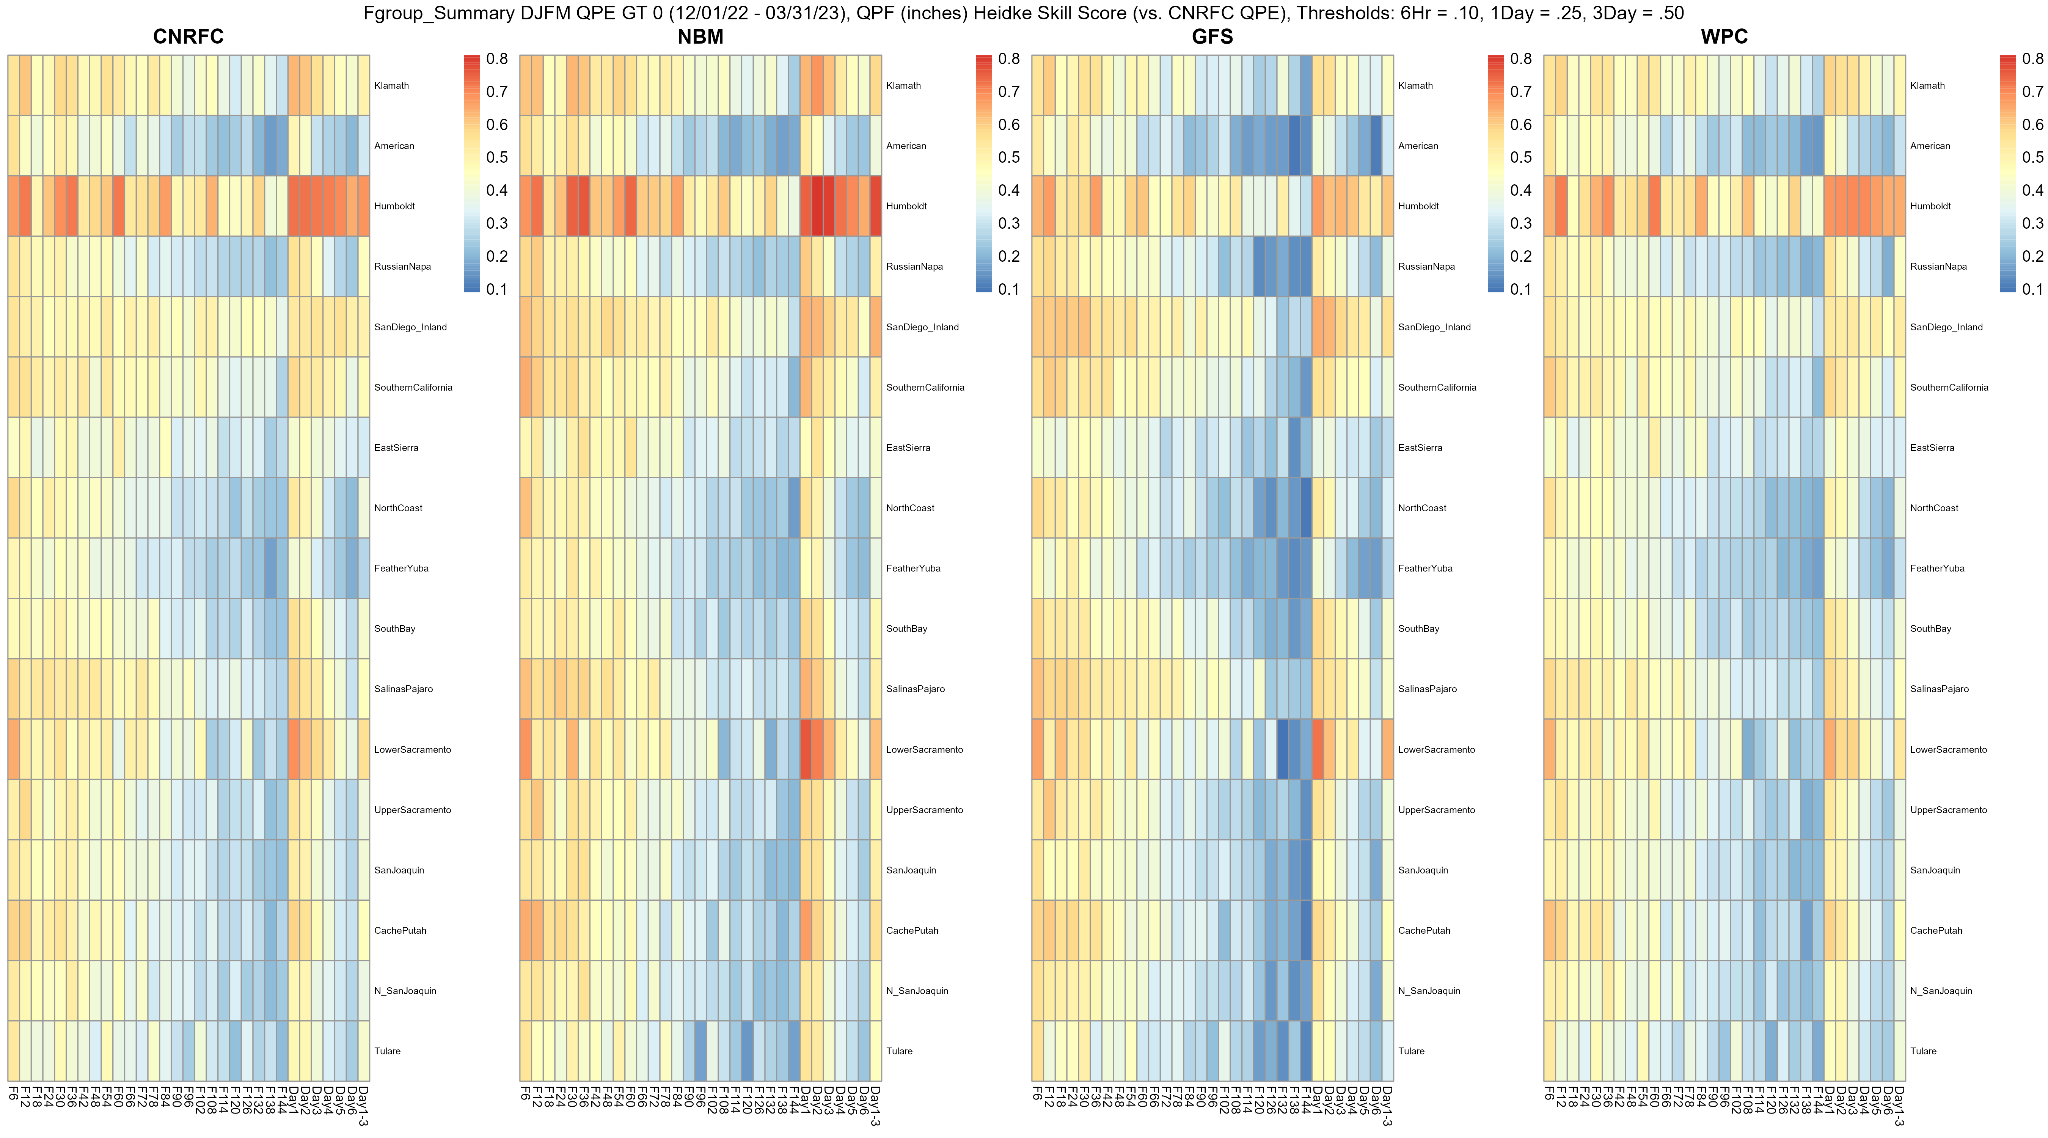 New River Forecast Groups for 2023 WY For the 2023 WY, the Southern California forecast group was divided into the San Diego/Inland and Southern California forecast groups. For Days 1-3, the GFS performed the best compared to the CNRFC, NBM, and WPC for the San Diego/Inland forecast group when looking at MAE, RMSE, and PBIAS. However, the NBM performed better than the GFS when looking at the Heidke Skill Score, similar to the other 16 river forecast groups. For the Southern California forecast group, none of the models performed particularly well, but the GFS performed the worst. Another forecast group divided for the 2023 WY was the Central Coast, with the new forecast groups named the Salinas/Pajaro and South Bay. Looking at the South Bay forecast group for Days 1-3, all the models had a fairly high MAE and RMSE, with the NBM being the best. The MAE and RMSE were slightly higher for the Salinas/Pajaro forecast group, with GFS performing the worst. CNRFC and WPC slightly overestimated, while the GFS slightly underestimated. However, the NBM was near 0 for PBIAS in the South Bay. For the Salinas/Pajaro, the CNRFC and WPC PBIAS were near 0, the NBM showed a slight underestimate, and the GFS showed a large underestimate. RMSE and MAE were fairly high, with the GFS being the worst. The NBM was slightly better in HSS compared to the other sources for the South Bay and Salinas/Pajaro groups. The individual forecast points in the Salinas Pajaro group varied by point and source on how much skill they showed. For the South Bay, the NBM was the best and showed good skill with HSS for all locations except the Los Gatos Creek - Lake Elsman (LESC1) basin. A Closer Look at a Couple River Forecast Groups for Specific Time Periods and Locations The spread of the numerical weather models for the late December 2022 through early January 2023 storms was larger than the late February through March 2023 storms. At some locations during the more impactful storms, the models for the most part underestimated the precipitation. Looking closer at the North San Joaquin forecast group, and in particular the Cosumnes River - Michigan Bar (MHBC1) basin, the QPE was quite a bit higher than the models for the majority of the 6-hour QPF out 3 days, with the exception of at 12 hours lead time, the NBM and GFS were slightly higher on January 1, 2023. In general, for the period from December 1, 2022, through March 31, 2023, the models overestimated the precipitation at Michigan Bar as well as all of the other forecast basins in the Northern San Joaquin group, with the exception of a slight underestimate for all models (greatest in the GFS) at Littlejohns Creek - Farmington Reservoir (FRGC1). In contrast, from December 26, 2022, through January 1, 2023, all the models underestimated the Days 1-3 precipitation in the Northern San Joaquin group. The image below displays 6-hour QPF amounts for the CNRFC, GFS, NBM, and WPC, along with 6-hour QPE amounts out to 72 hours (3 days) for the Cosumnes River - Michigan Bar (MHBC1) basin from December 1, 2022, though March 31, 2023. Click on the image below to enlarge and open in a new tab. 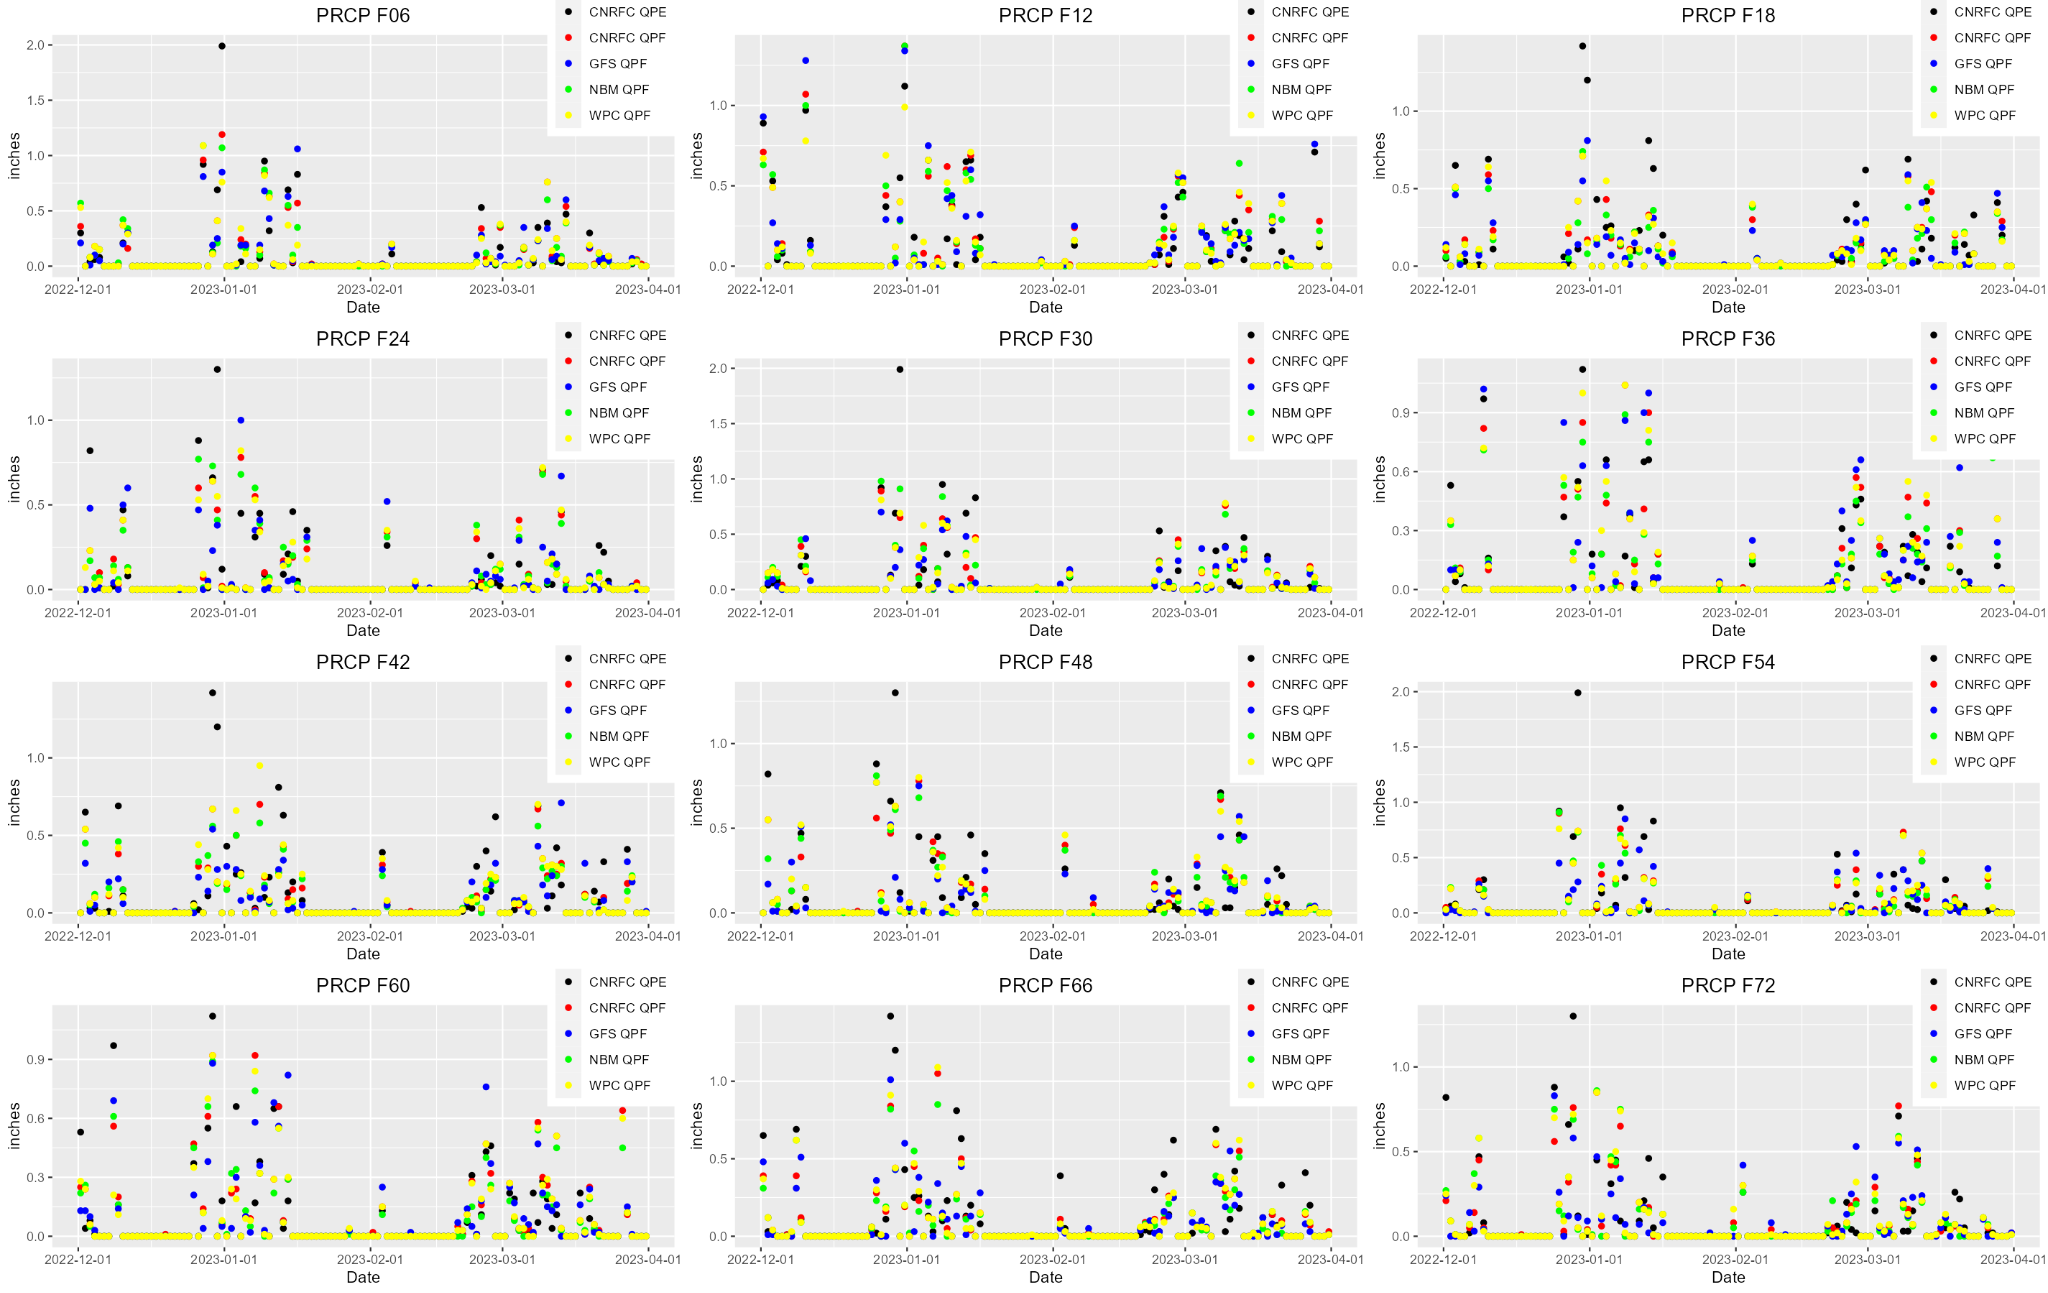 The image below displays 6-hour QPF amounts for the CNRFC, GFS, NBM, and WPC, along with 6-hour QPE amounts out to 72 hours (3 days) for the Cosumnes River - Michigan Bar (MHBC1) basin from December 26, 2022, though January 1, 2023. Click on the image below to enlarge and open in a new tab. 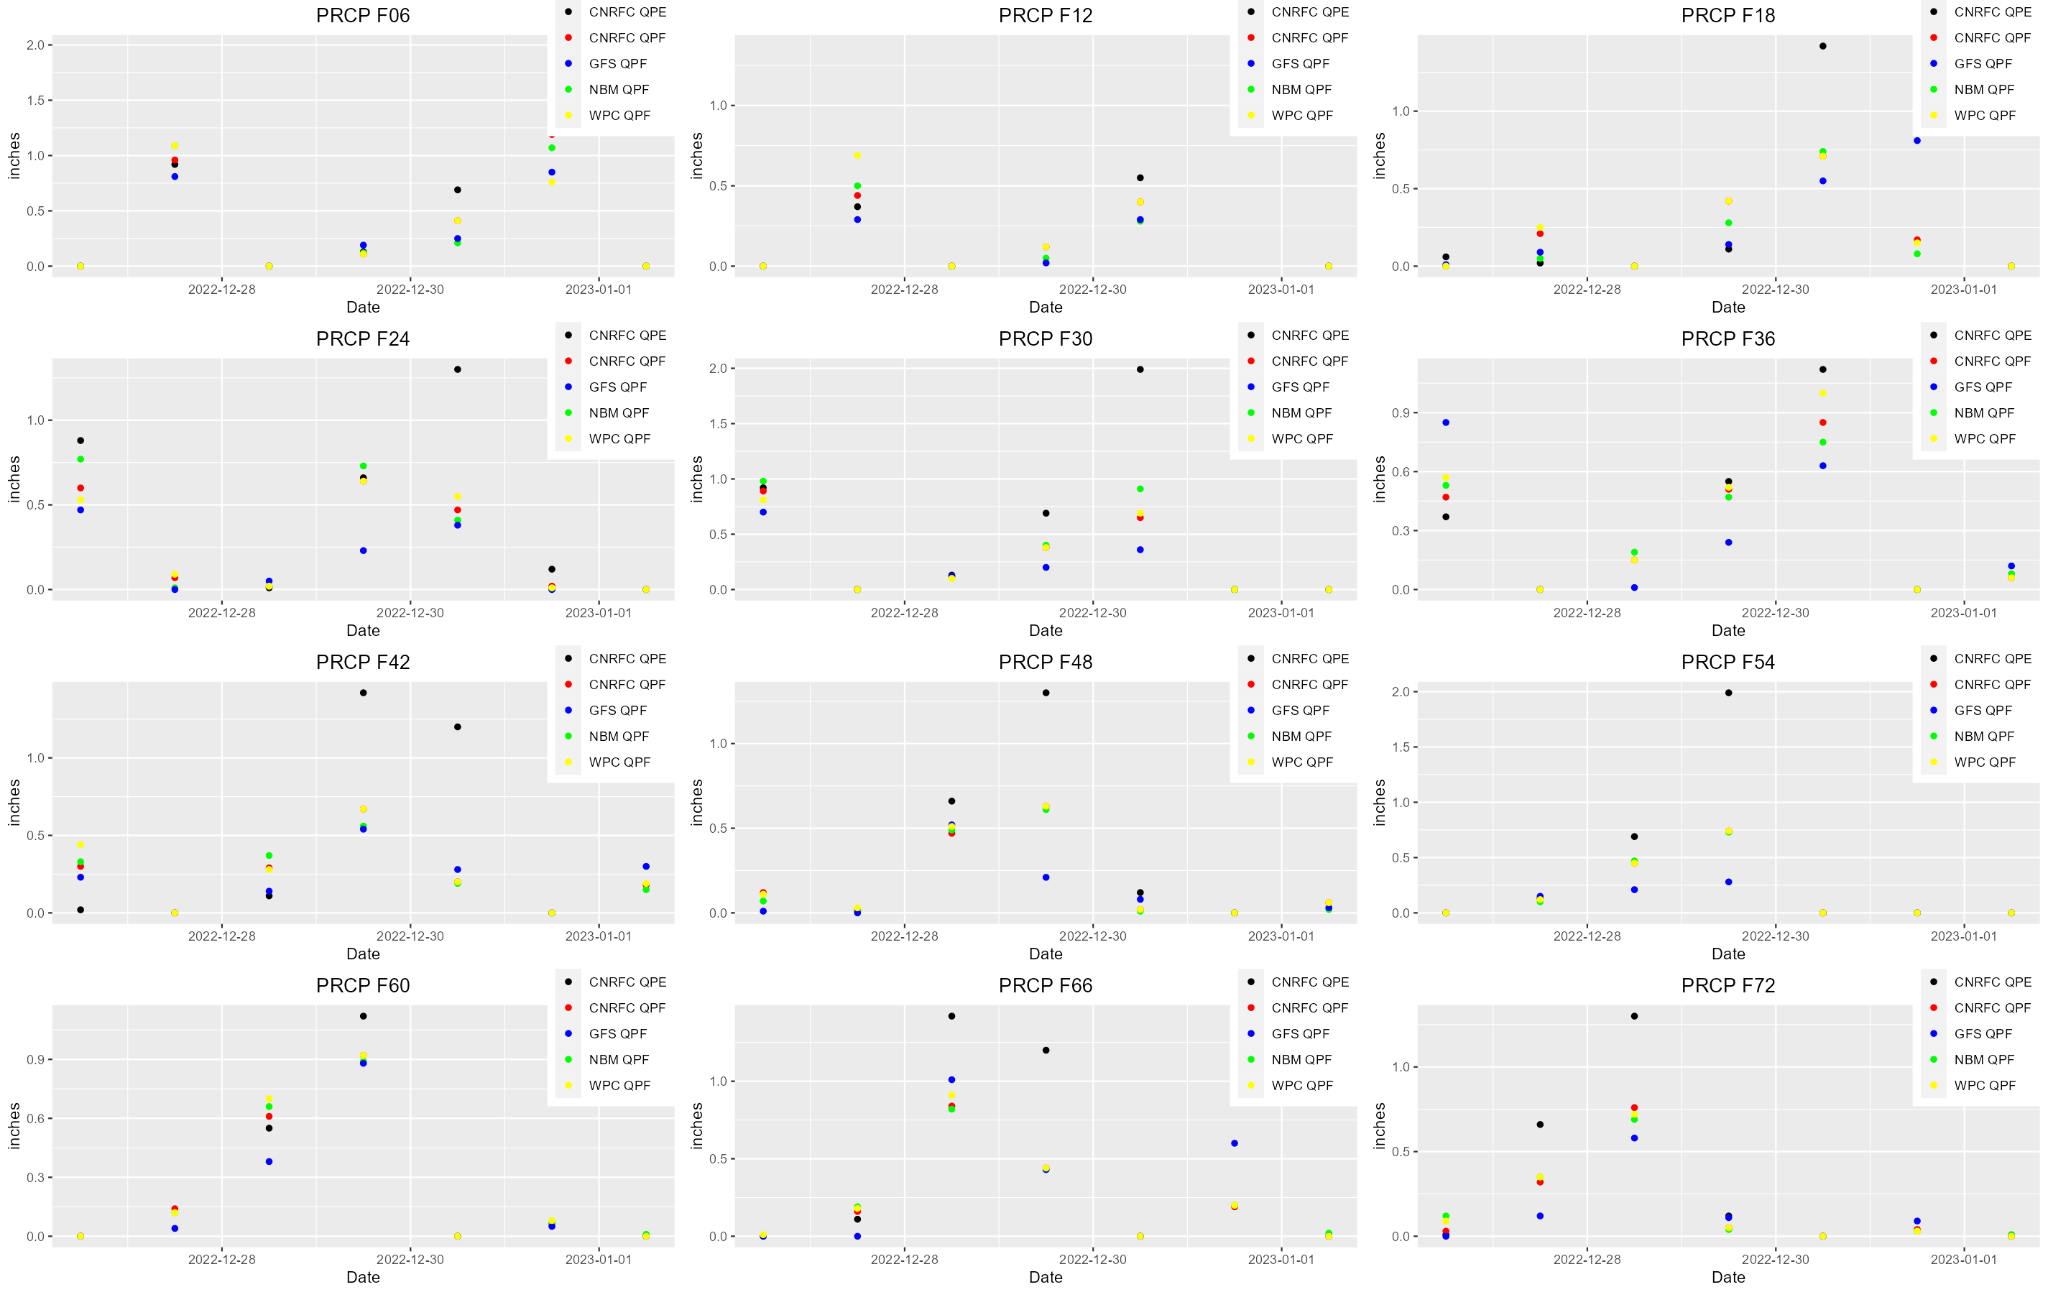 The image below displays the North San Joaquin forecast groups' Percent Bias (PBIAS) of QPF for four sources (12Z morning CNRFC, 12Z GFS, NBM, and WPC) versus the CNRFC QPE from December 1, 2022, through March 31, 2023. Click on the image below to enlarge and open in a new tab. 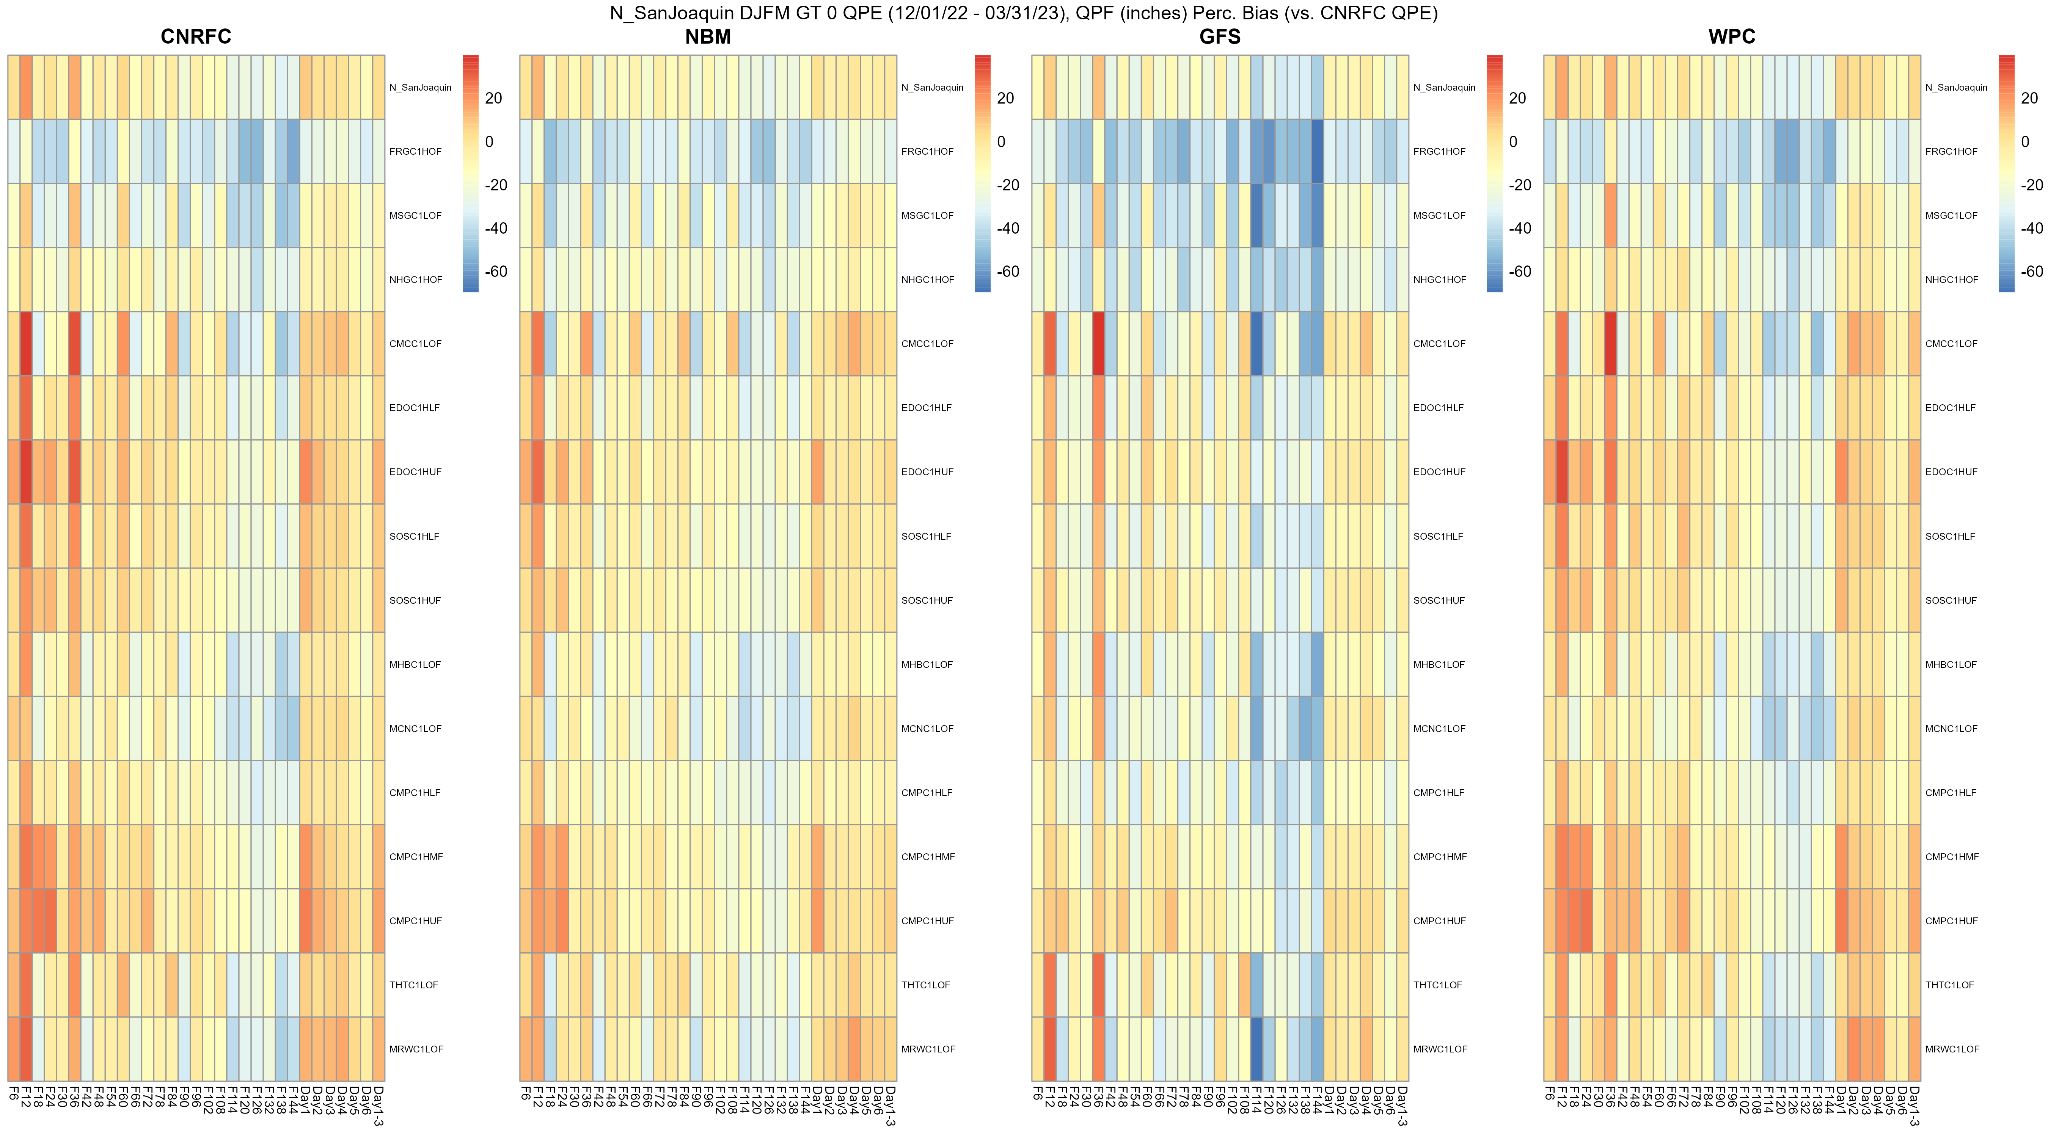 The image below displays the North San Joaquin forecast groups' Percent Bias (PBIAS) of QPF for four sources (12Z morning CNRFC, 12Z GFS, NBM, and WPC) versus the CNRFC QPE from December 26, 2022, through January 1, 2023. Click on the image below to enlarge and open in a new tab. 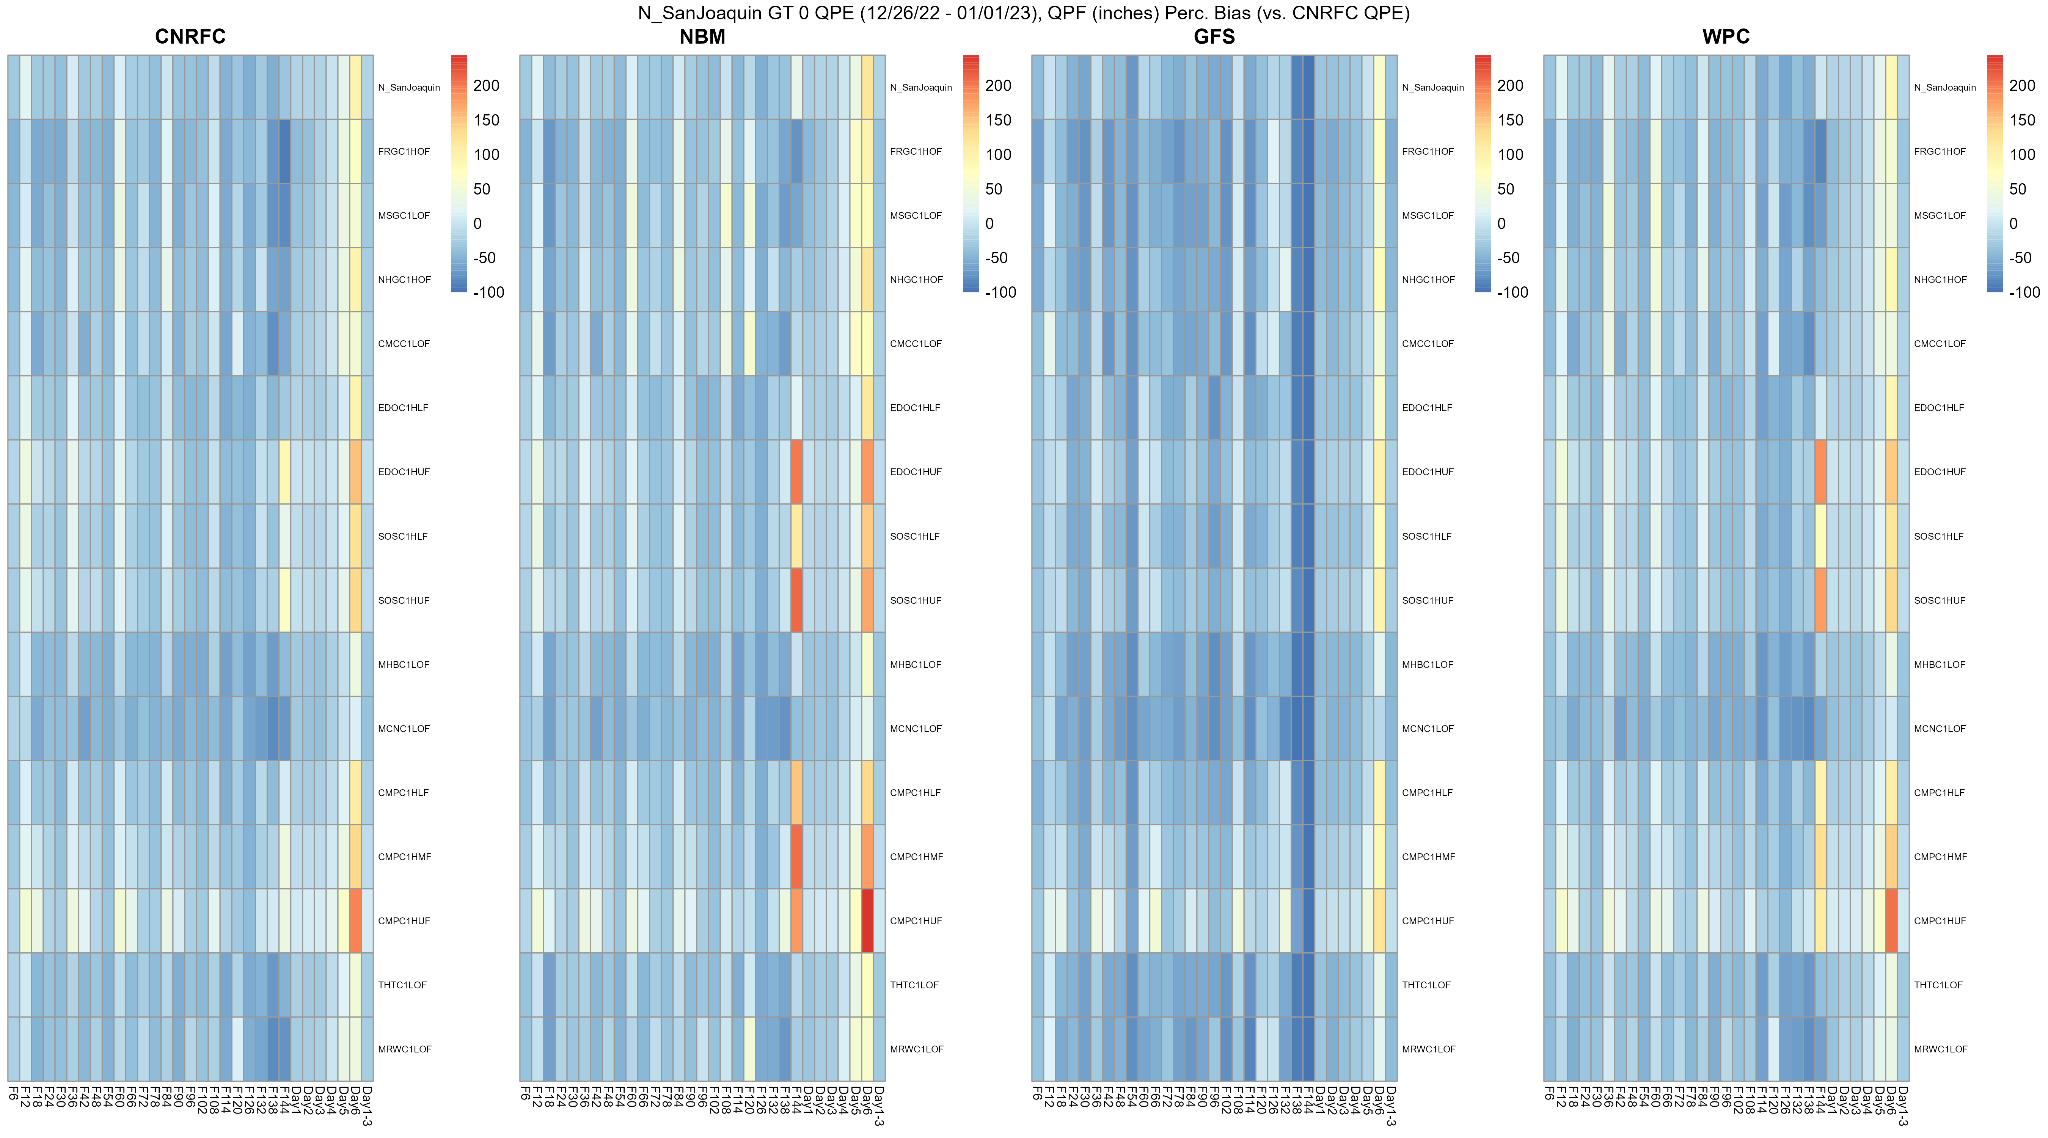 Taking a closer look at the Salinas/Pajaro forecast group in January, the Salinas River - Paso Robles (PRBC1) basin received historic precipitation from January 9-10. A precipitation gauge at San Luis Obispo recorded 6", which broke its all-time daily record. The QPF was underforecast by the CNRFC, WPC, NBM, and GFS out to 36 hours. For PRBC1, all the models underestimated the precipitation, with the CNRFC and WPC slightly less than the NBM, and even less than the GFS. QPF was underestimated for the Salinas/Pajaro forecast group from January 4, 2023, thorugh January 17, 2023, but for the period of December 1, 2022 through March 31, 2023, the CNRFC and WPC showed little bias, with NBM and GFS underestimating (GFS the most). The image below displays 6-hour QPF amounts for the CNRFC, GFS, NBM, and WPC, along with 6-hour QPE amounts out to 72 hours (3 days) for the Salinas River - Paso Robles (PRBC1) basin from December 1, 2022, though March 31, 2023. Click on the image below to enlarge and open in a new tab. 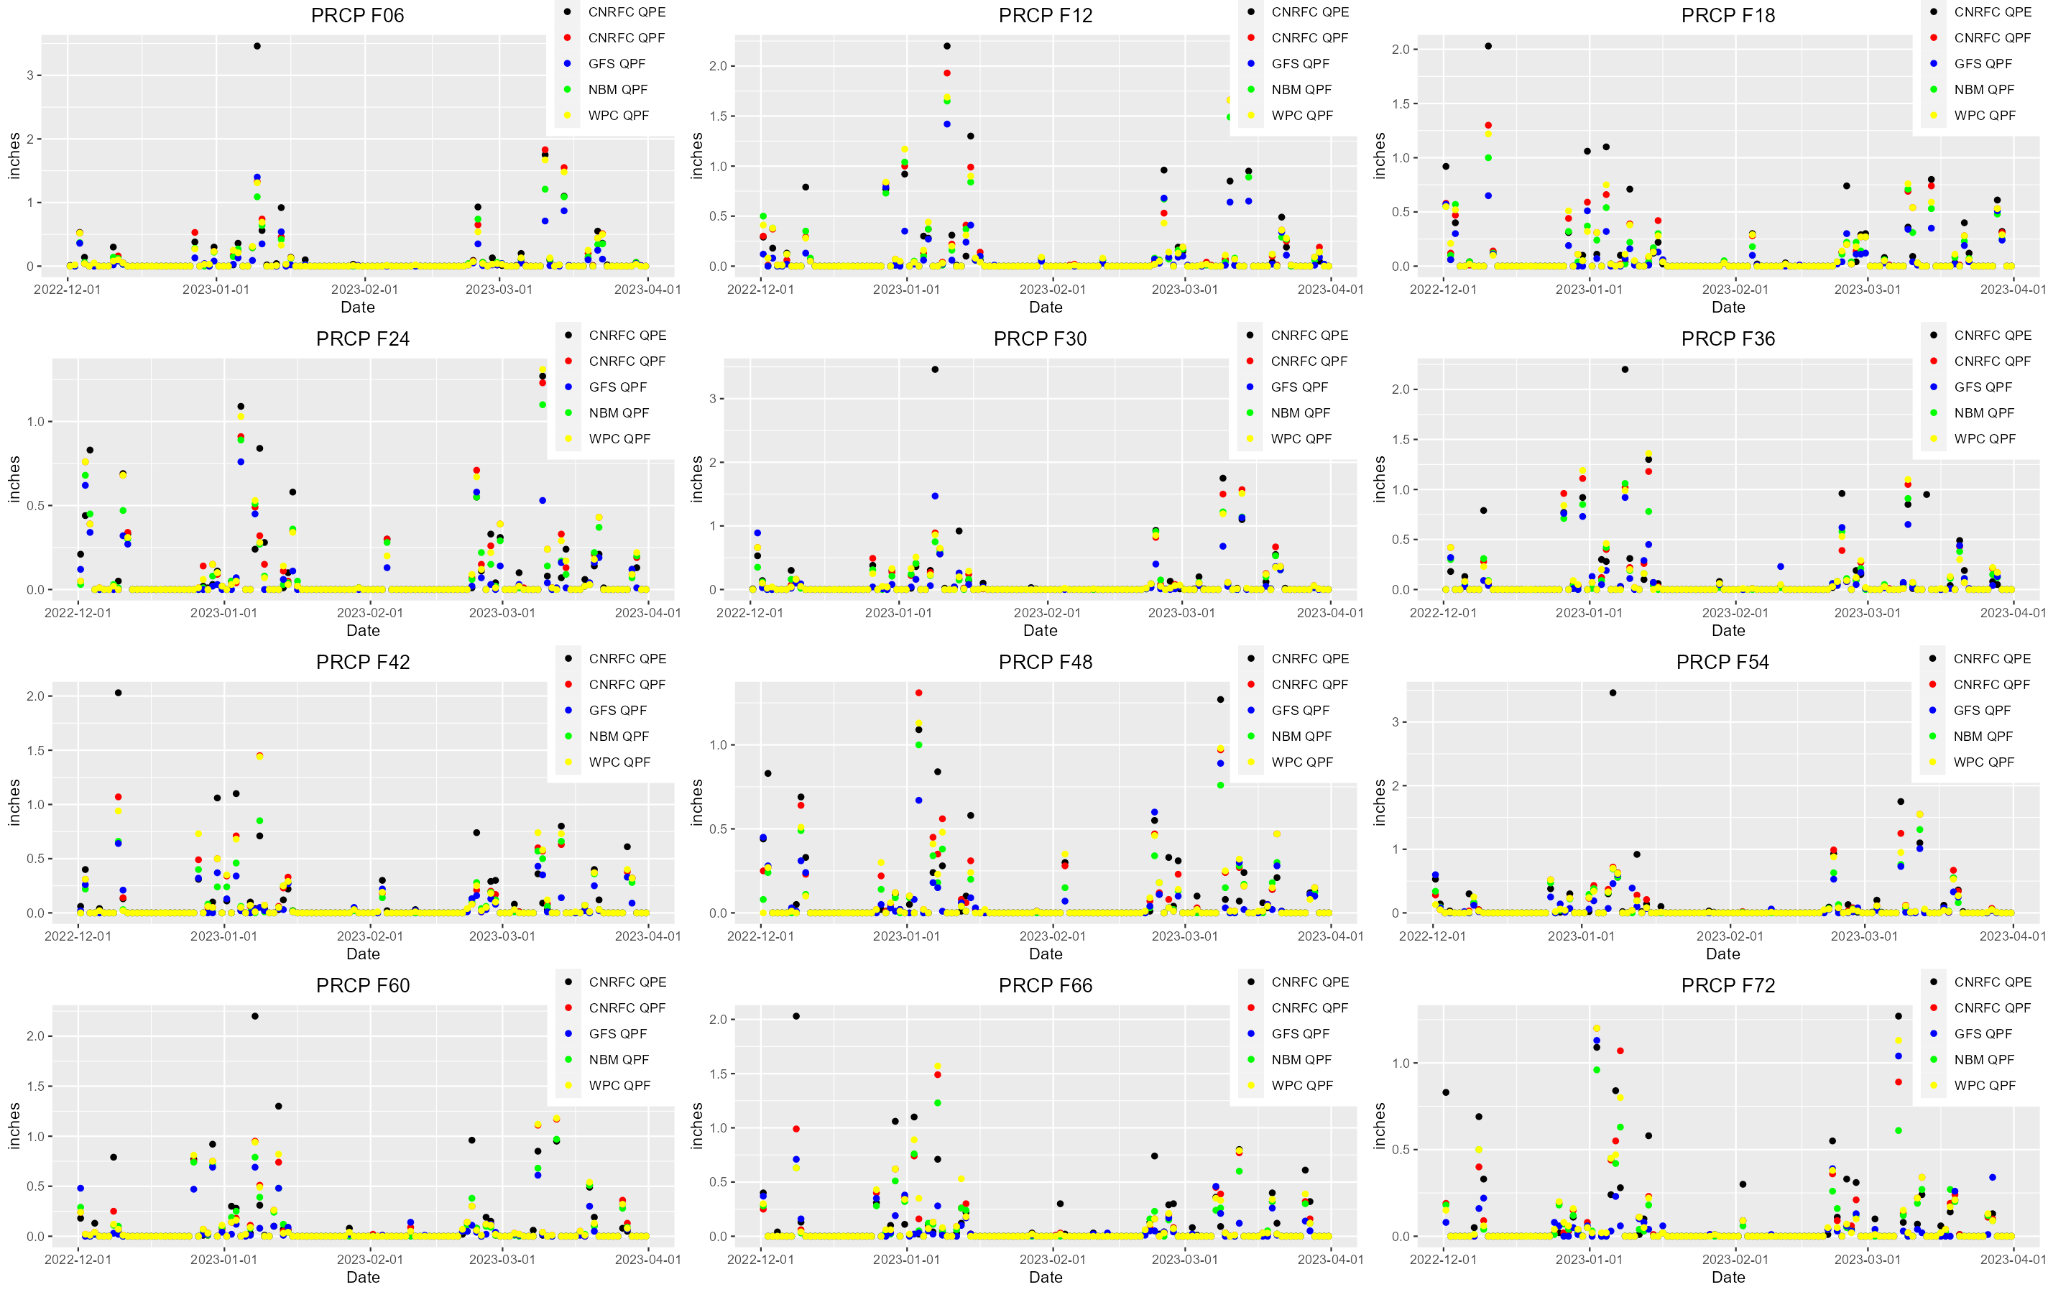 The image below displays 6-hour QPF amounts for the CNRFC, GFS, NBM, and WPC, along with 6-hour QPE amounts out to 72 hours (3 days) for the Salinas River - Paso Robles (PRBC1) basin from January 4, 2023, though January 17, 2023. Click on the image below to enlarge and open in a new tab. 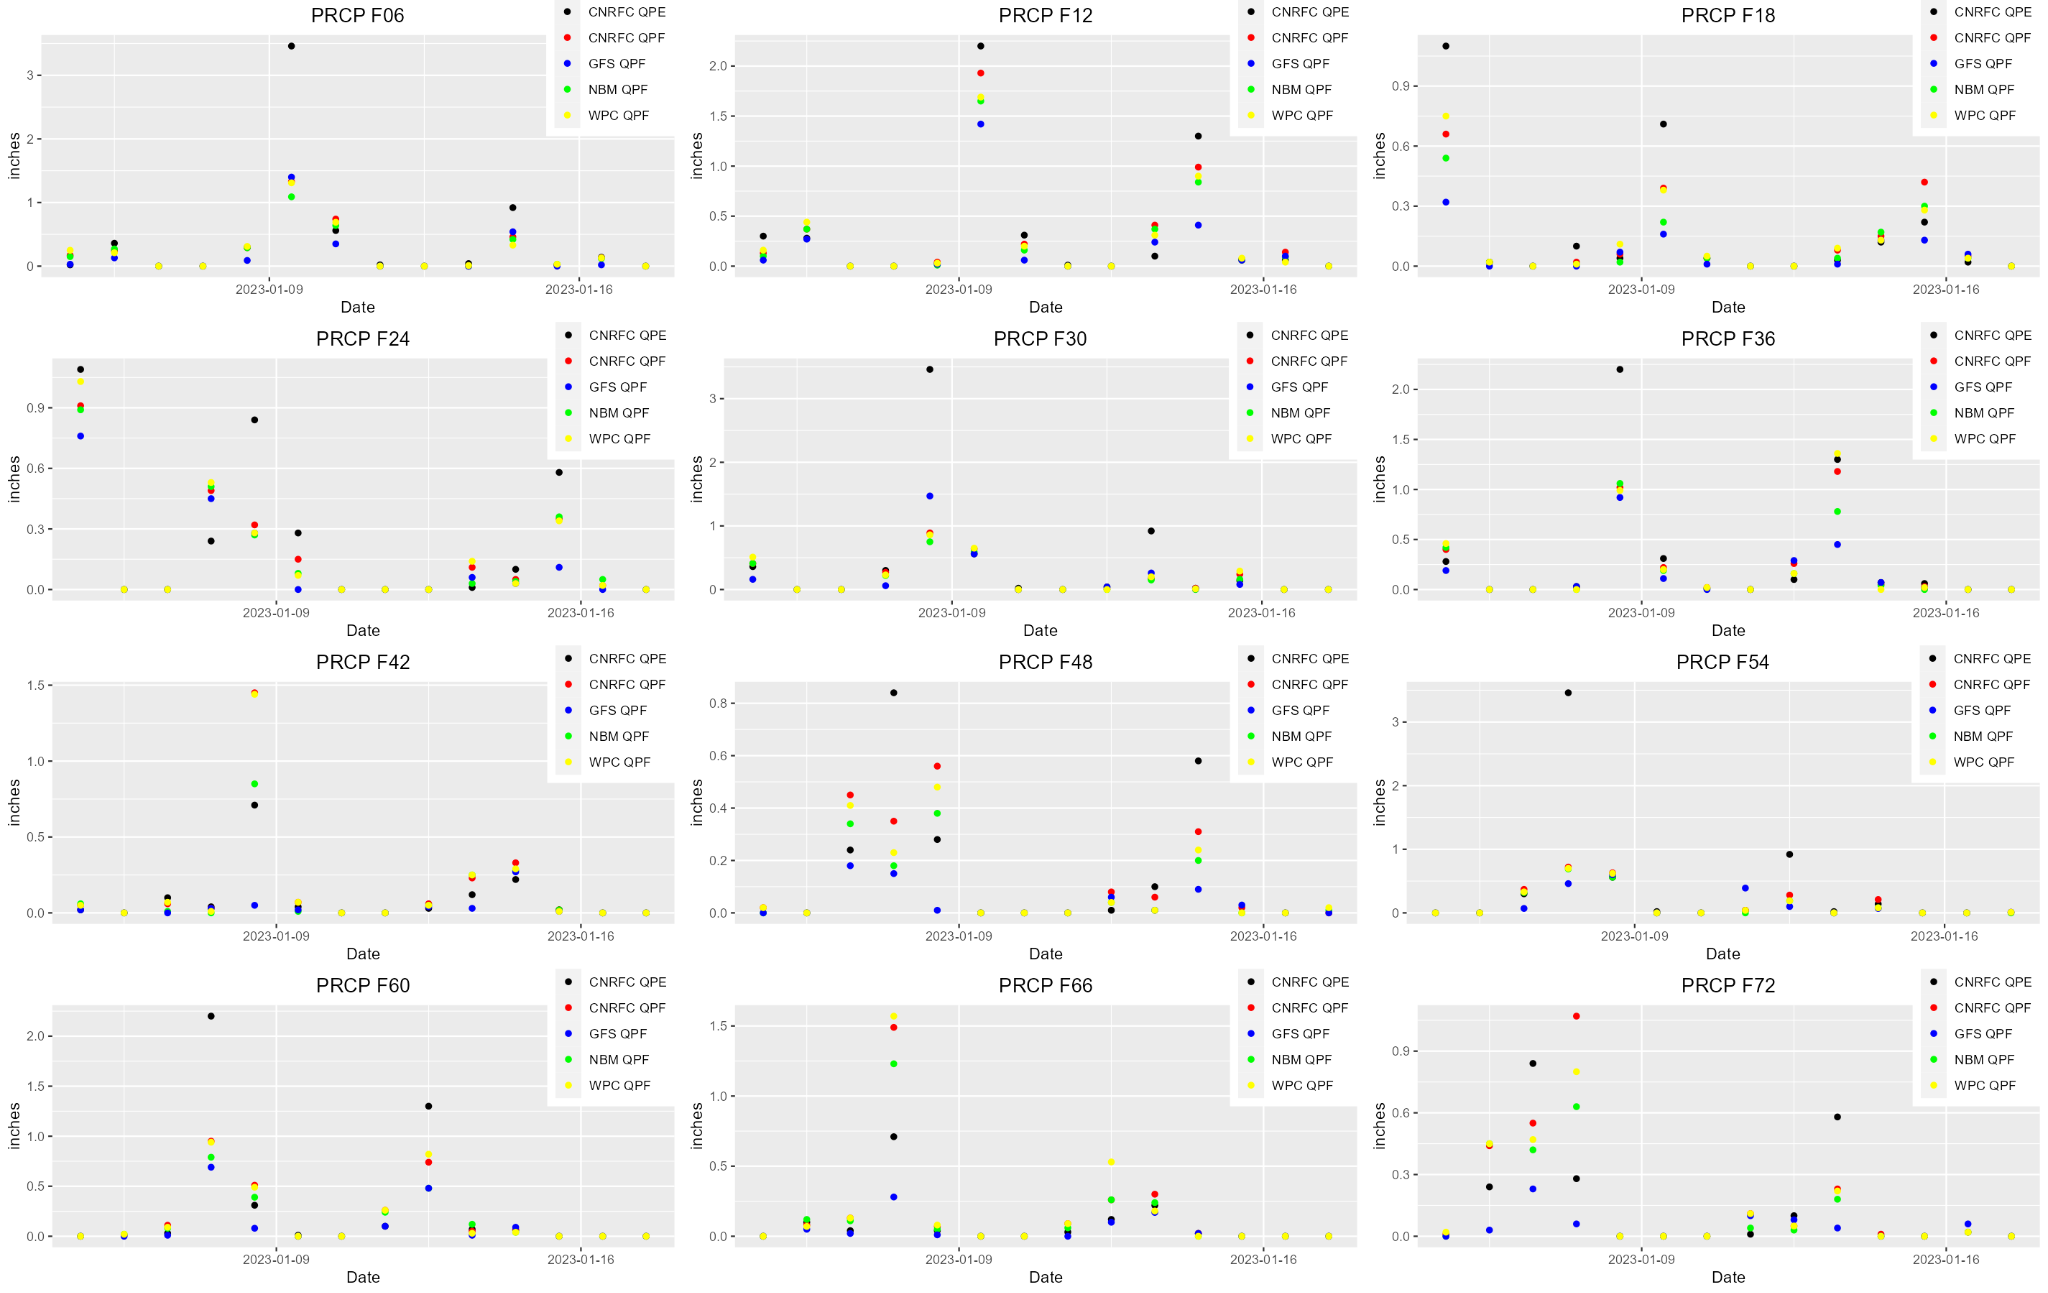 The image below displays the Salinas Pajaro forecast groups' Percent Bias (PBIAS) of QPF for four sources (12Z morning CNRFC, 12Z GFS, NBM, and WPC) versus the CNRFC QPE from December 1, 2022, through March 31, 2023. Click on the image below to enlarge and open in a new tab. 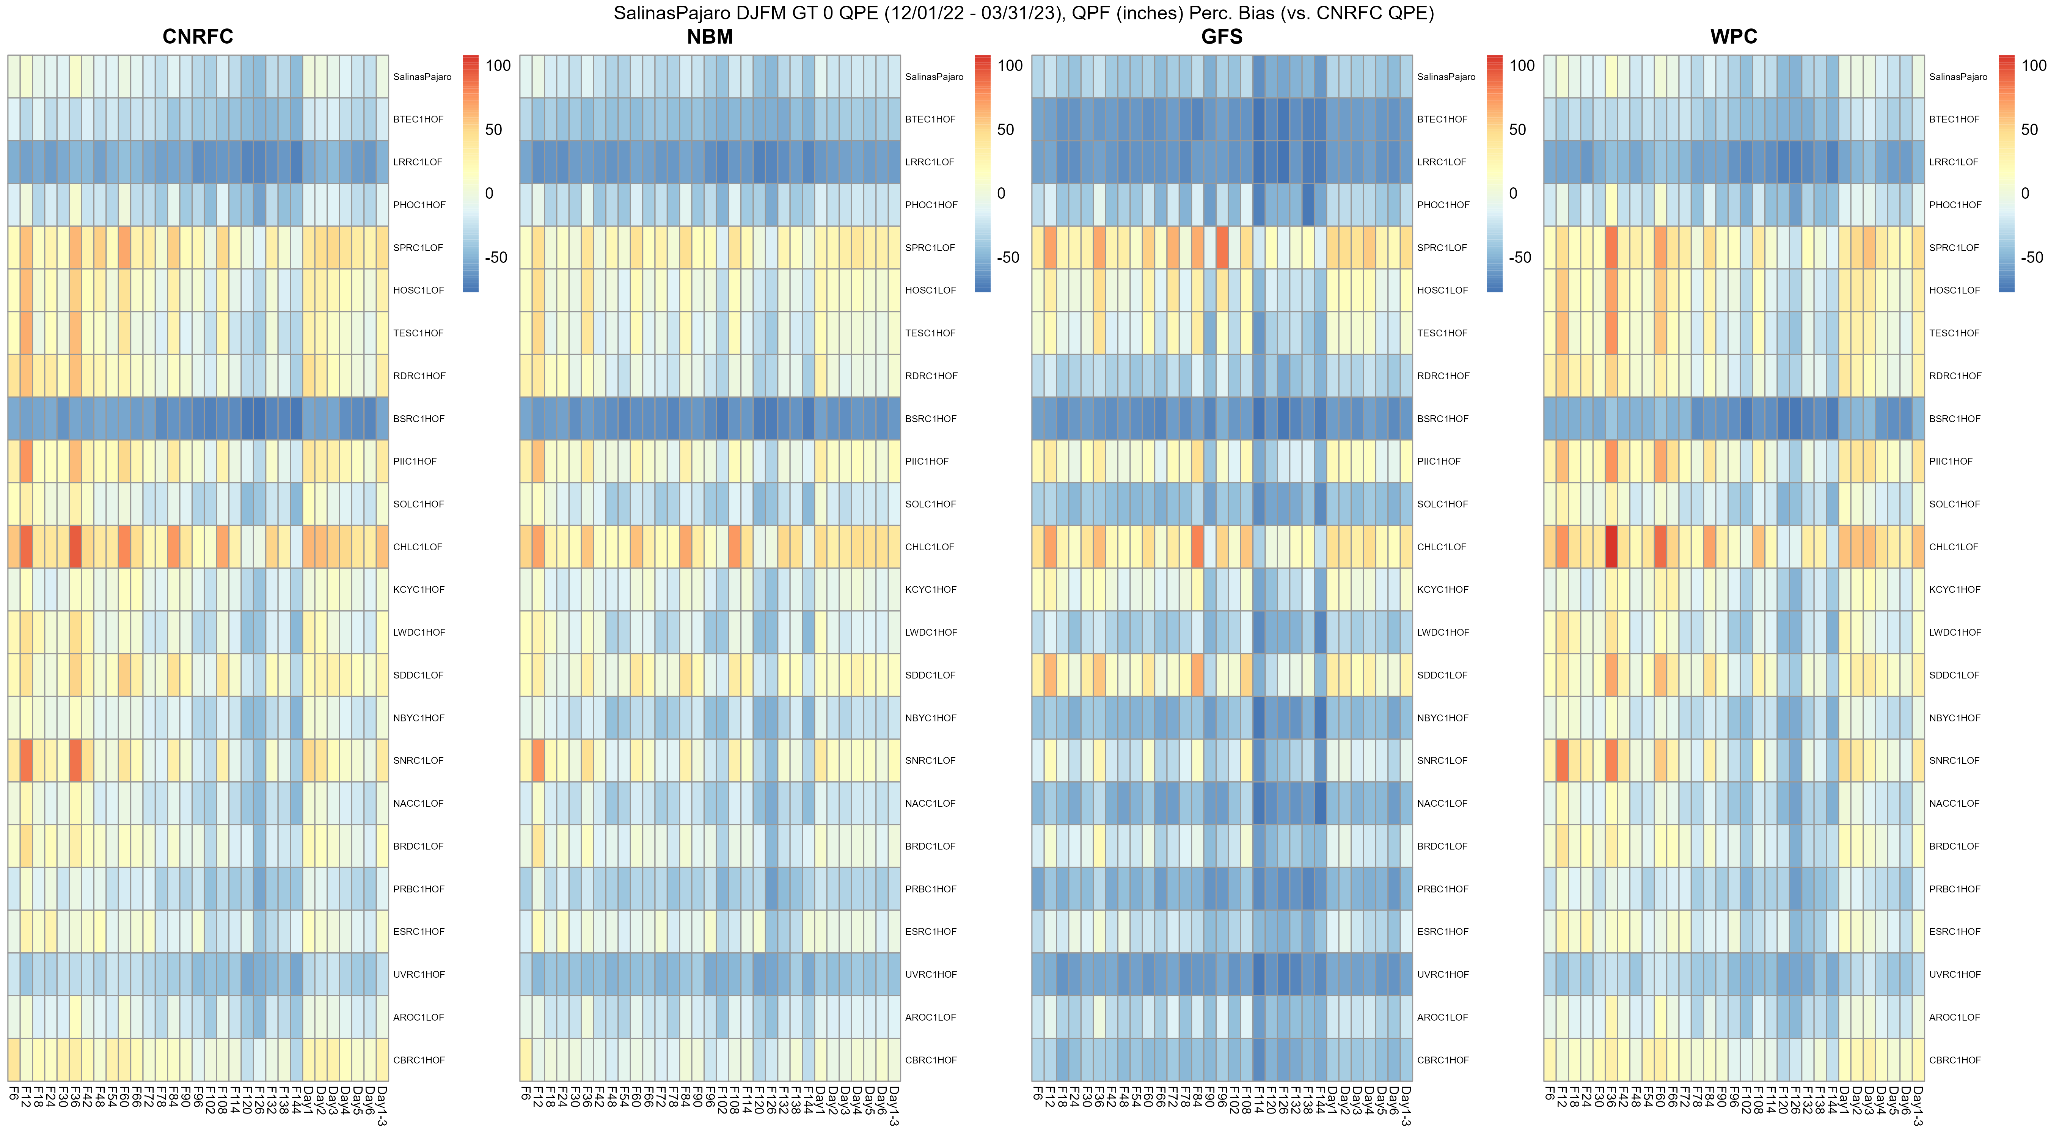 The image below displays the Salinas Pajaro forecast groups' Percent Bias (PBIAS) of QPF for four sources (12Z morning CNRFC, 12Z GFS, NBM, and WPC) versus the CNRFC QPE from January 4, 2023, through January 17, 2023. Click on the image below to enlarge and open in a new tab. 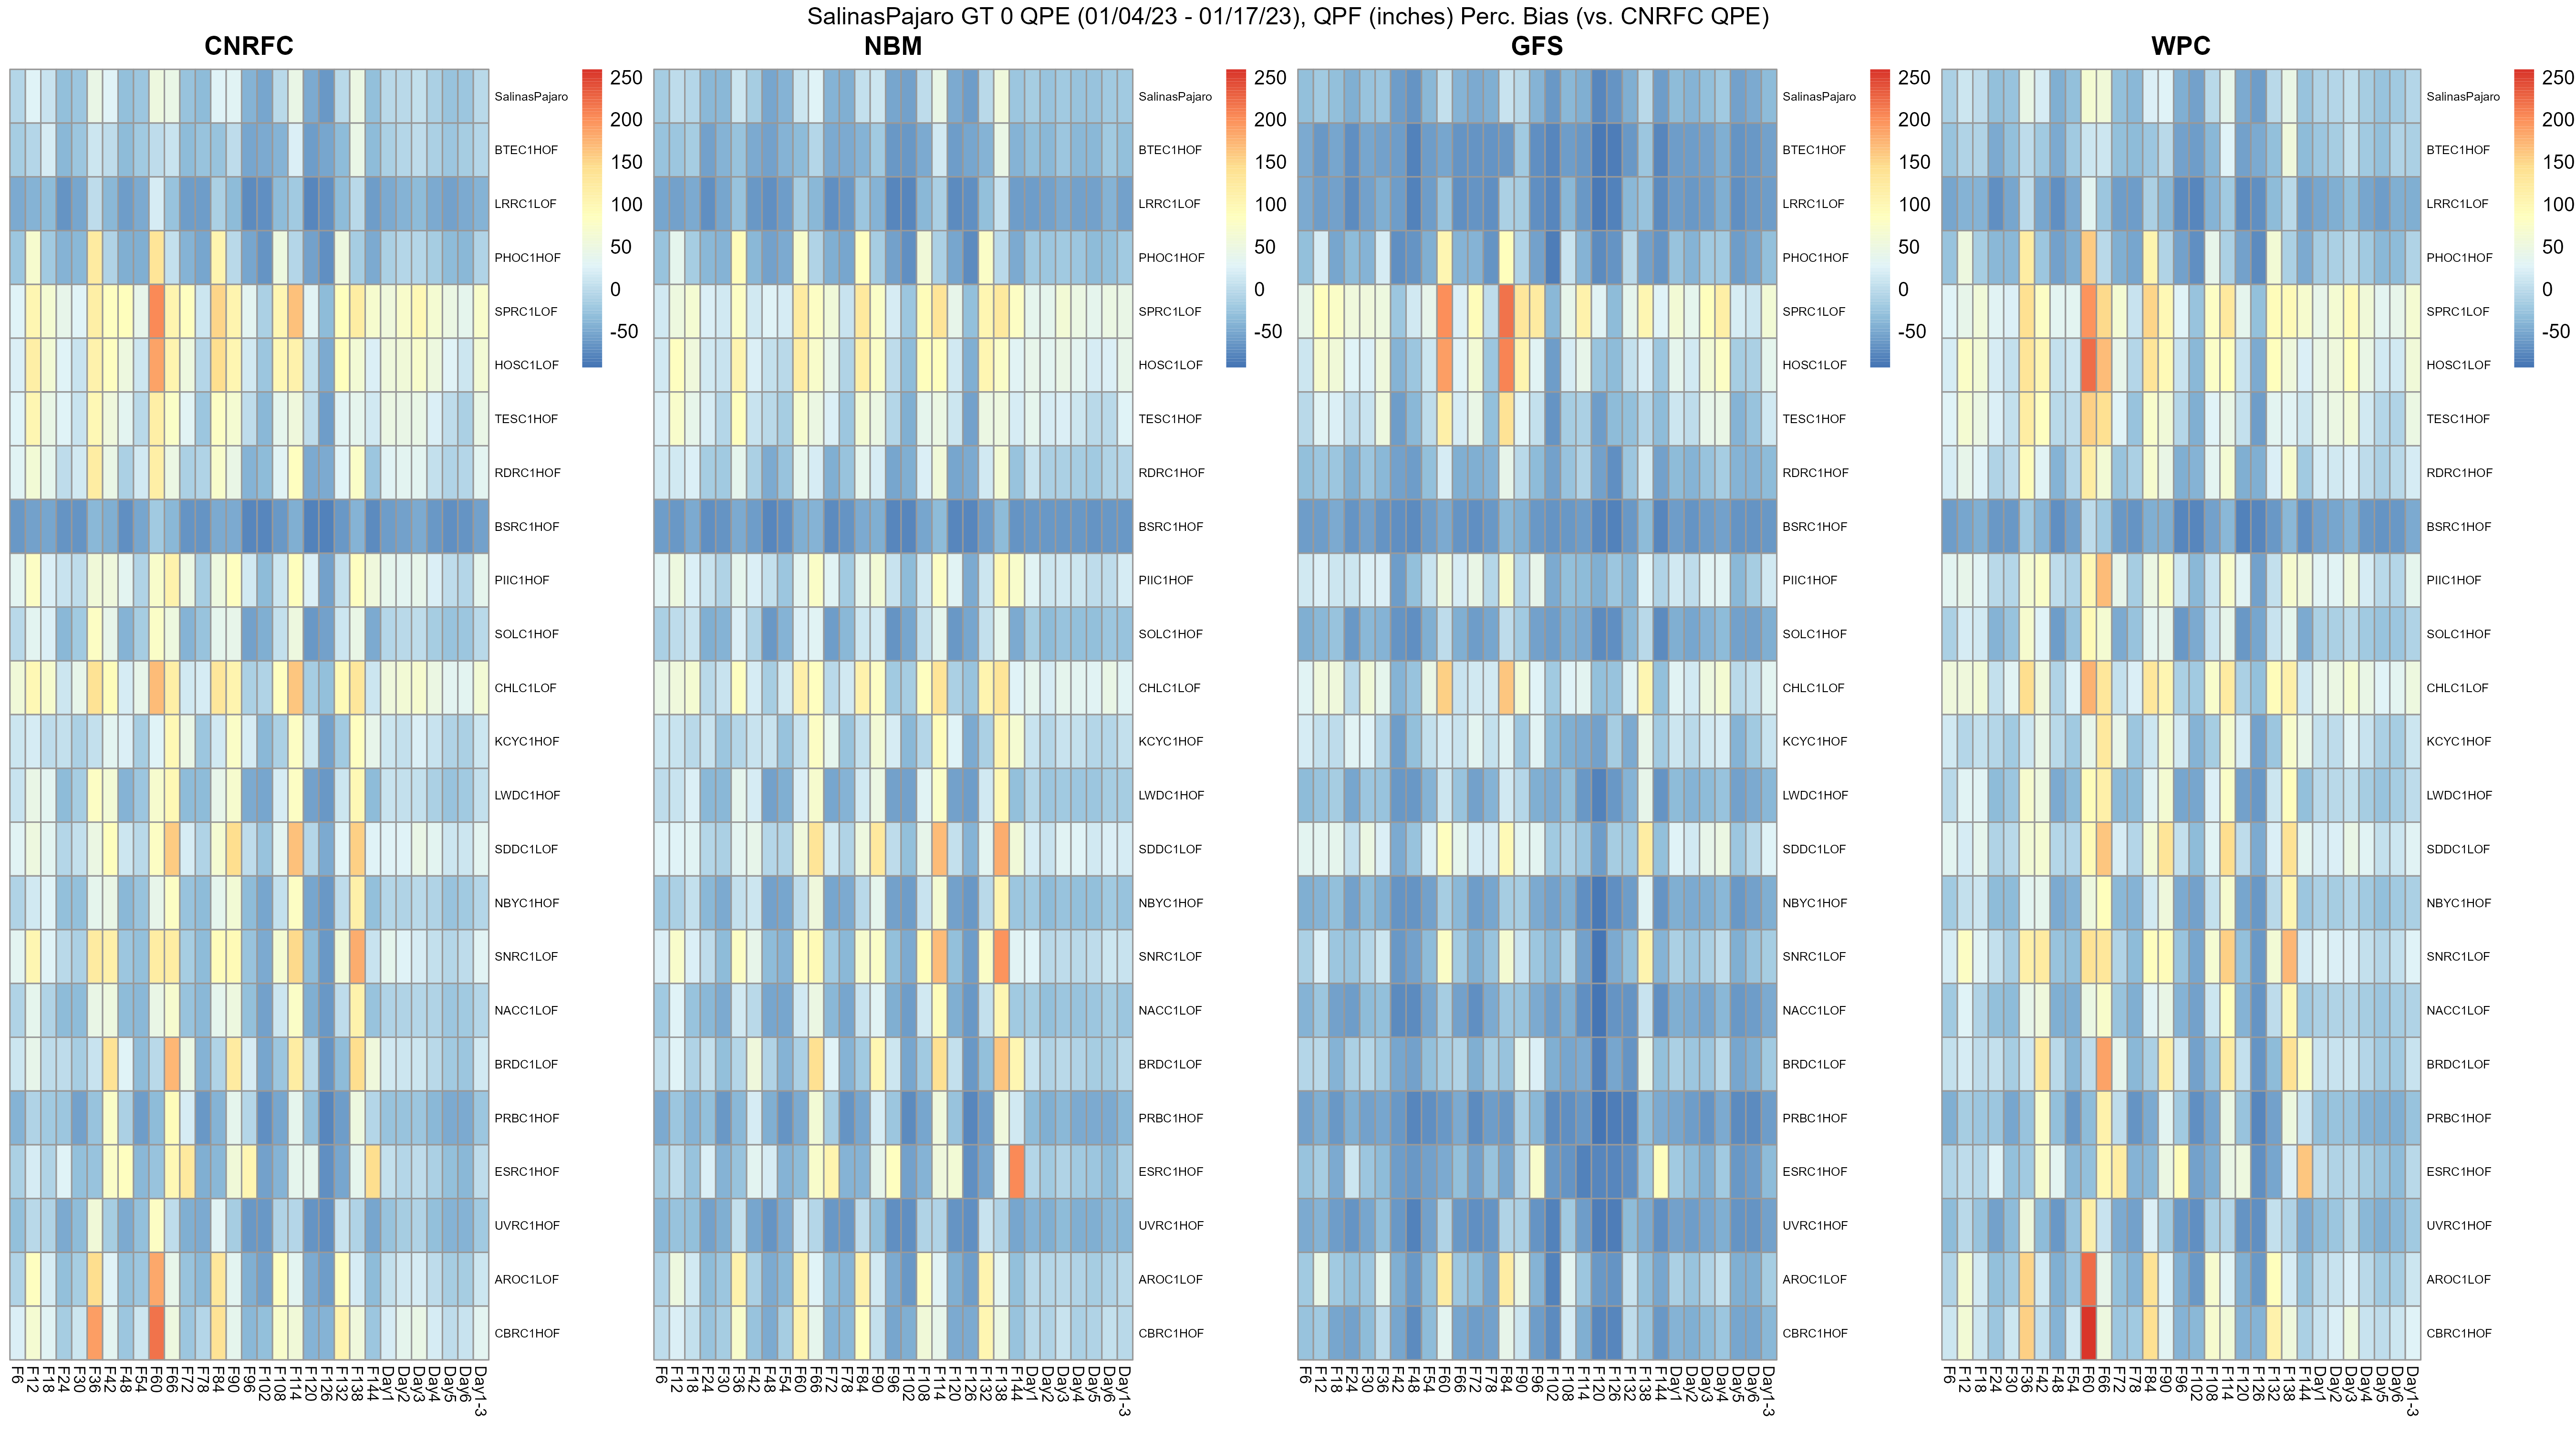 The following takes a closer look at the Tulare forecast group for March 9-16, 2023, when heavy precipitation and flood impacts were observed. Overall, the Tulare forecast group for December 2022 through March 2023 showed little bias for the CNRFC morning QPF forecast, 12Z NBM, WPC, and GFS QPF compared to the CNRFC QPE. Looking closer at individual forecast basins within the Tulare forecast group, there is little bias at many of the points, but others see an overestimate or an underestimate for Days 1-3 total Percent Bias of QPF for the period of December 1, 2022, through March 31, 2023. The biggest overestimate bias for the Kern River at Fairview Dam (KKVC1) basin with an overestimate bias at all elevations in the basin (KKVC1HLF - lower, KKVC1HMF - middle, and KKVC1HUF - upper zones), but with the largest bias at the lowest elevations of the basin (KKVC1HLF, less than 5000 ft) in the CNRFC QPF (33.2%), NBM (18.2%), and WPC (33.1%) QPF. For the GFS, the biggest overestimate (24.3%) was on the South Fork of the Kern River near Onyx (SKRC1) over the upper portion of the basin (SKRC1HUF). The largest underestimates for CNRFC (-40.8%), NBM (-51.2%), WPC (-37.9%) were on the Kern River at Lake Isabella (ISAC1) over the upper portion of the basin (ISAC1LUF). However, there was an underestimate at all elevations. The CNRFC, WPC, NBM, and GFS all underestimated the QPF at Isabella. For the GFS, the biggest underestimate (-38.9%) was on the South Fork Tule River near the Reservation Boundary (TVRC1) at the upper elevations of the basin (TVRC1HUF). There was an underestimate at all elevations for this basin as well. For March 9-16, 2023, bias at all points in the Tulare Basin ranged from near zero to underforecast QPF. Similar to the December through March period, Lake Isabella in the upper portion of the basin (ISAC1LUF) also had the largest bias for the March 9-16, 2023, period: CNRFC QPF (-51.7%), NBM (-60.5%), and WPC (-48.8%). The GFS also had the largest underestimate (-50.8%) at South Fork Tule River near the Reservation Boundary at the upper elevations (TVRC1HUF) for March 9-16, 2023, and for the winter. For the winter at Lake Isabella upper elevations (ISAC1LUF), most of the time periods (forecast hours 6-72 hours) and most of the days, the QPE is quite a bit higher than the model QPF, showing the low QPF forecast by the CNRFC, WPC, NBM, and GFS. For March 9-16, the underestimate of QPF at Lake Isabella was also seen, except at 42 hours (March 9 and 13) and 66 hours (March 12). Overall for the winter, the QPE was sometimes higher and sometimes lower than the CNRFC, NBM, WPC, and GFS for different days and times. For March 9-16, at the Kern River at Fairview Dam lower elevations (KKVC1HLF), the QPE is less than the CNRFC, NBM, and WPC QPF for 6-, 12-, and 18-hr forecasts, but the GFS QPF varies between higher and lower than QPE. The image below displays the Tulare forecast groups' Percent Bias (PBIAS) of QPF for four sources (12Z morning CNRFC, 12Z GFS, NBM, and WPC) versus the CNRFC QPE from December 1, 2022, through March 31, 2023. Click on the image below to enlarge and open in a new tab. 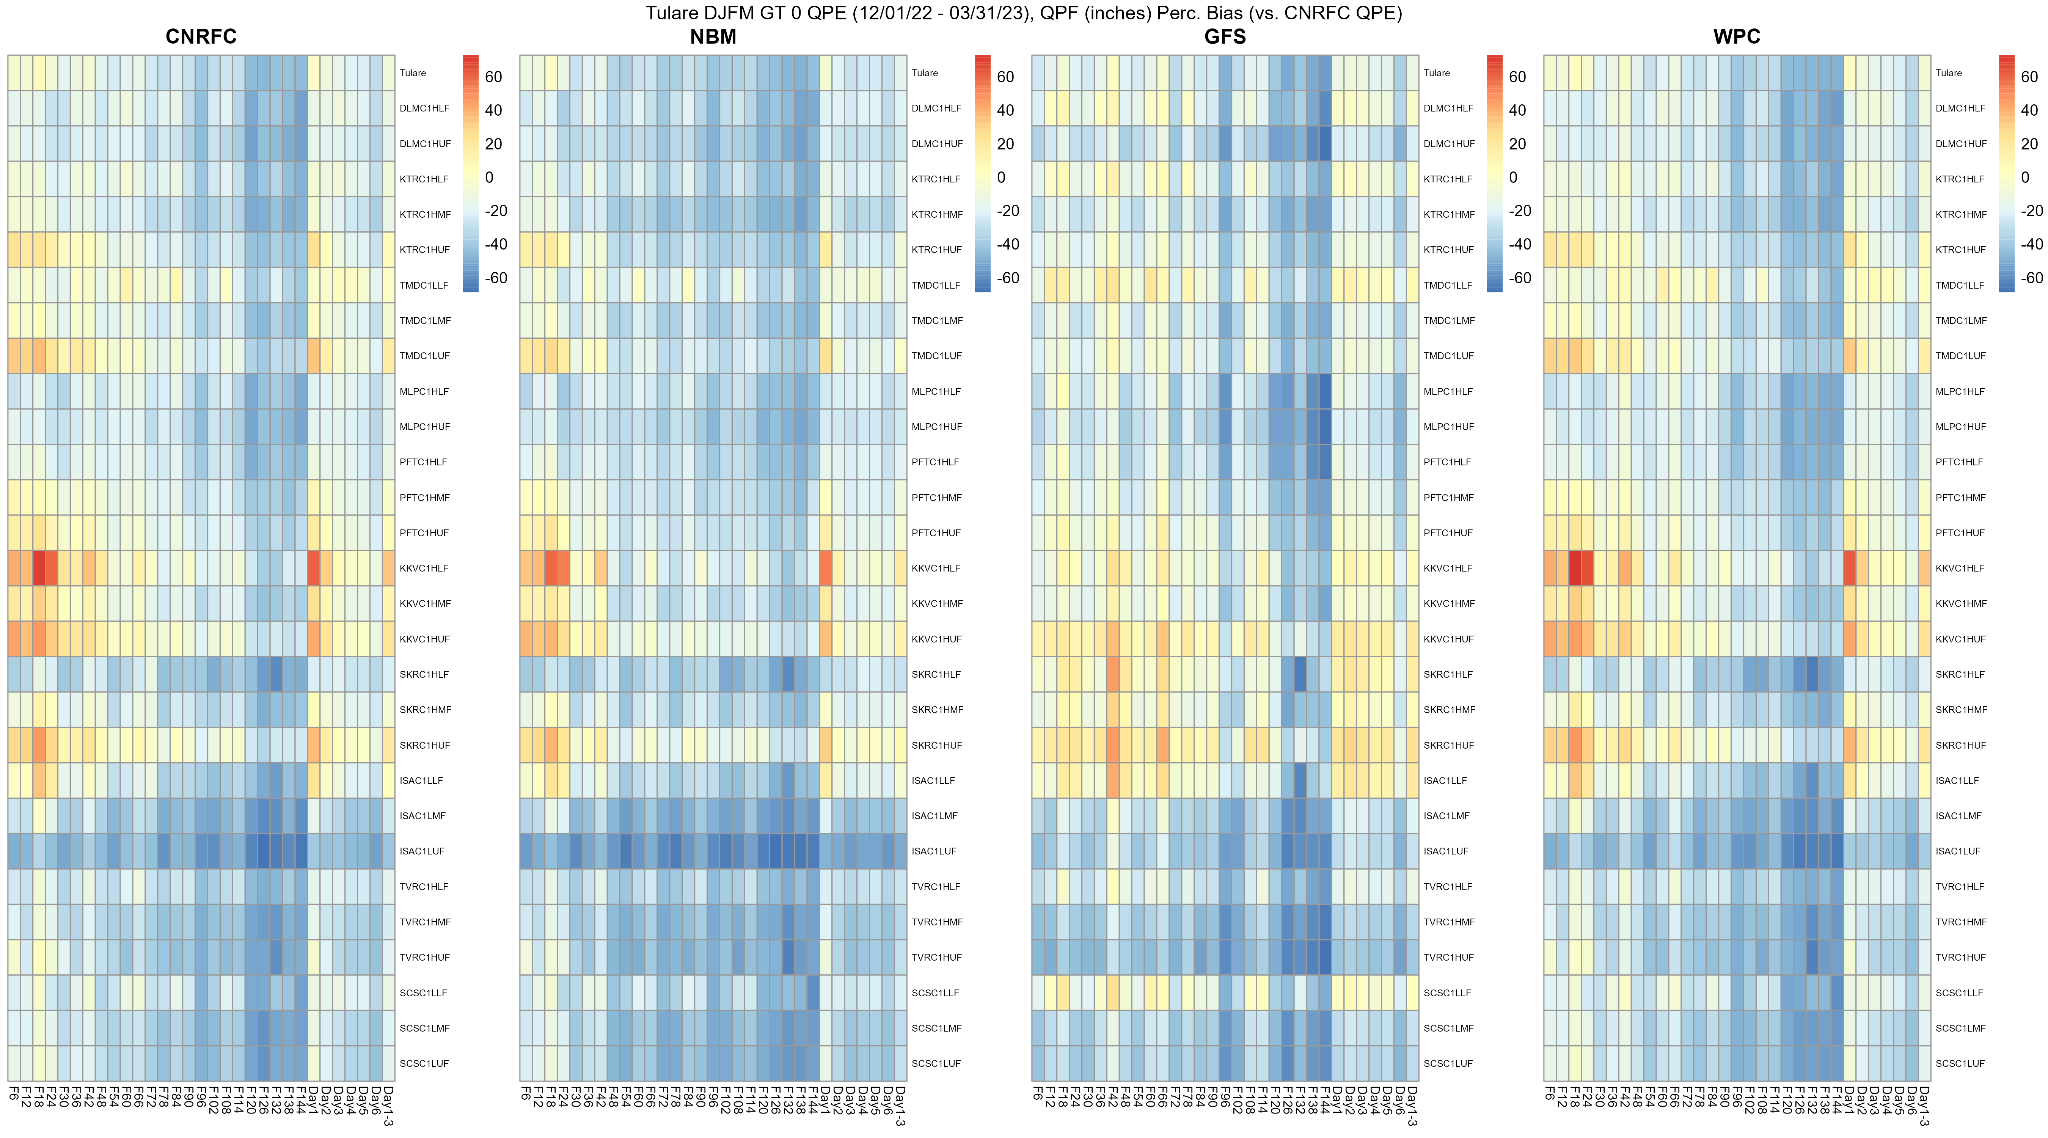 The image below displays the Tulare forecast groups' Percent Bias (PBIAS) of QPF for four sources (12Z morning CNRFC, 12Z GFS, NBM, and WPC) versus the CNRFC QPE from March 9, 2023, through March 16, 2023. Click on the image below to enlarge and open in a new tab.  The image below displays 6-hour QPF amounts for the CNRFC, GFS, NBM, and WPC, along with 6-hour QPE amounts out to 72 hours (3 days) for the Kern River - Lake Isabella (ISAC1) basin (upper elevations of the basin) from December 1, 2022, though March 31, 2023. Click on the image below to enlarge and open in a new tab. 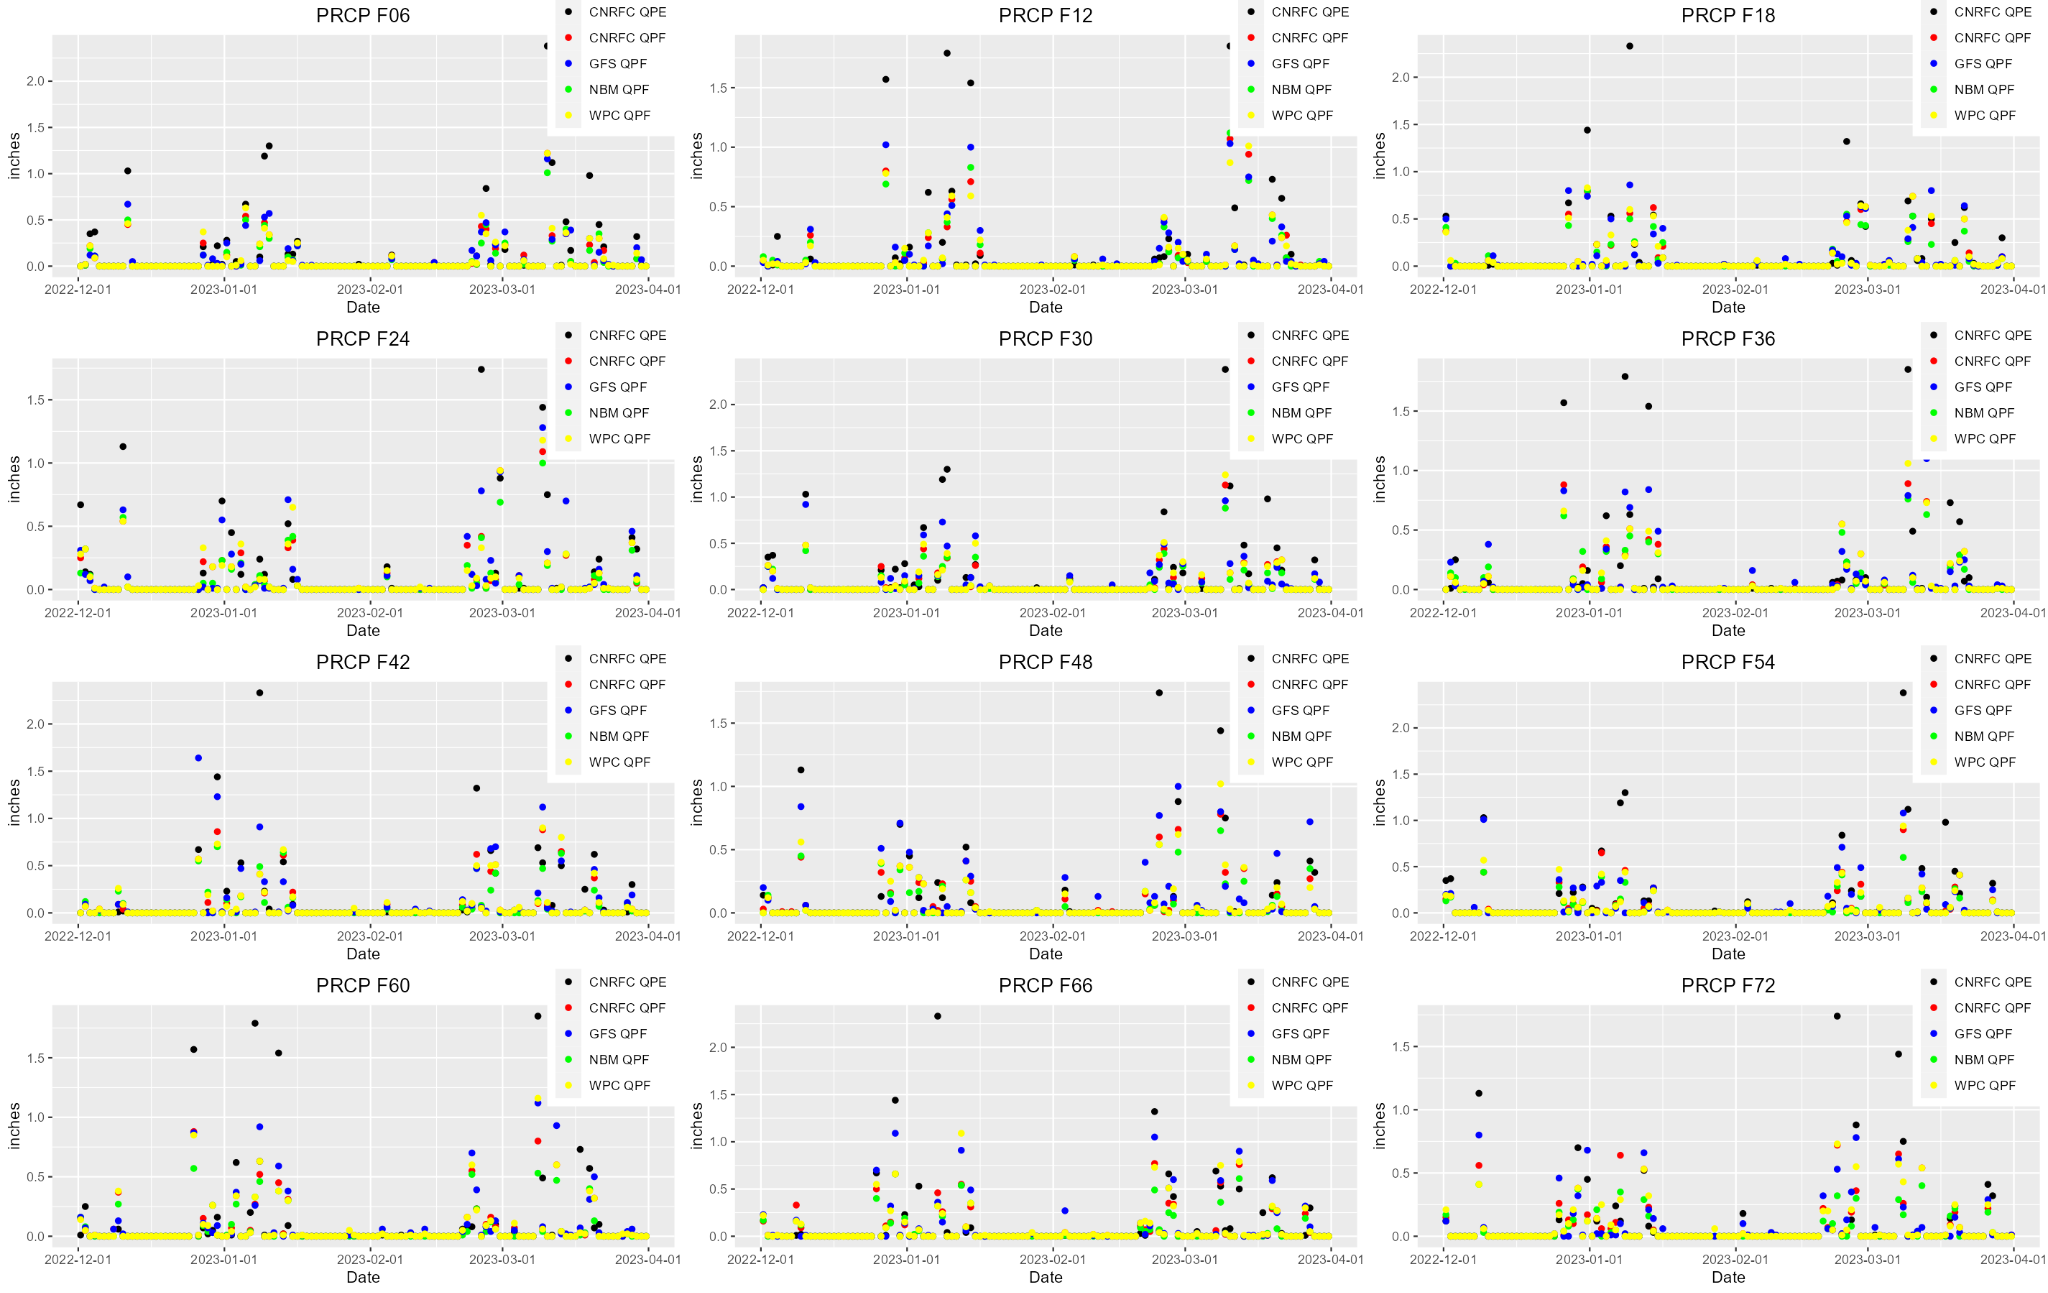 The image below displays 6-hour QPF amounts for the CNRFC, GFS, NBM, and WPC, along with 6-hour QPE amounts out to 72 hours (3 days) for the Kern River - Lake Isabella (ISAC1) basin (upper elevations of the basin) from March 9, 2023, though March 16, 2023. Click on the image below to enlarge and open in a new tab. 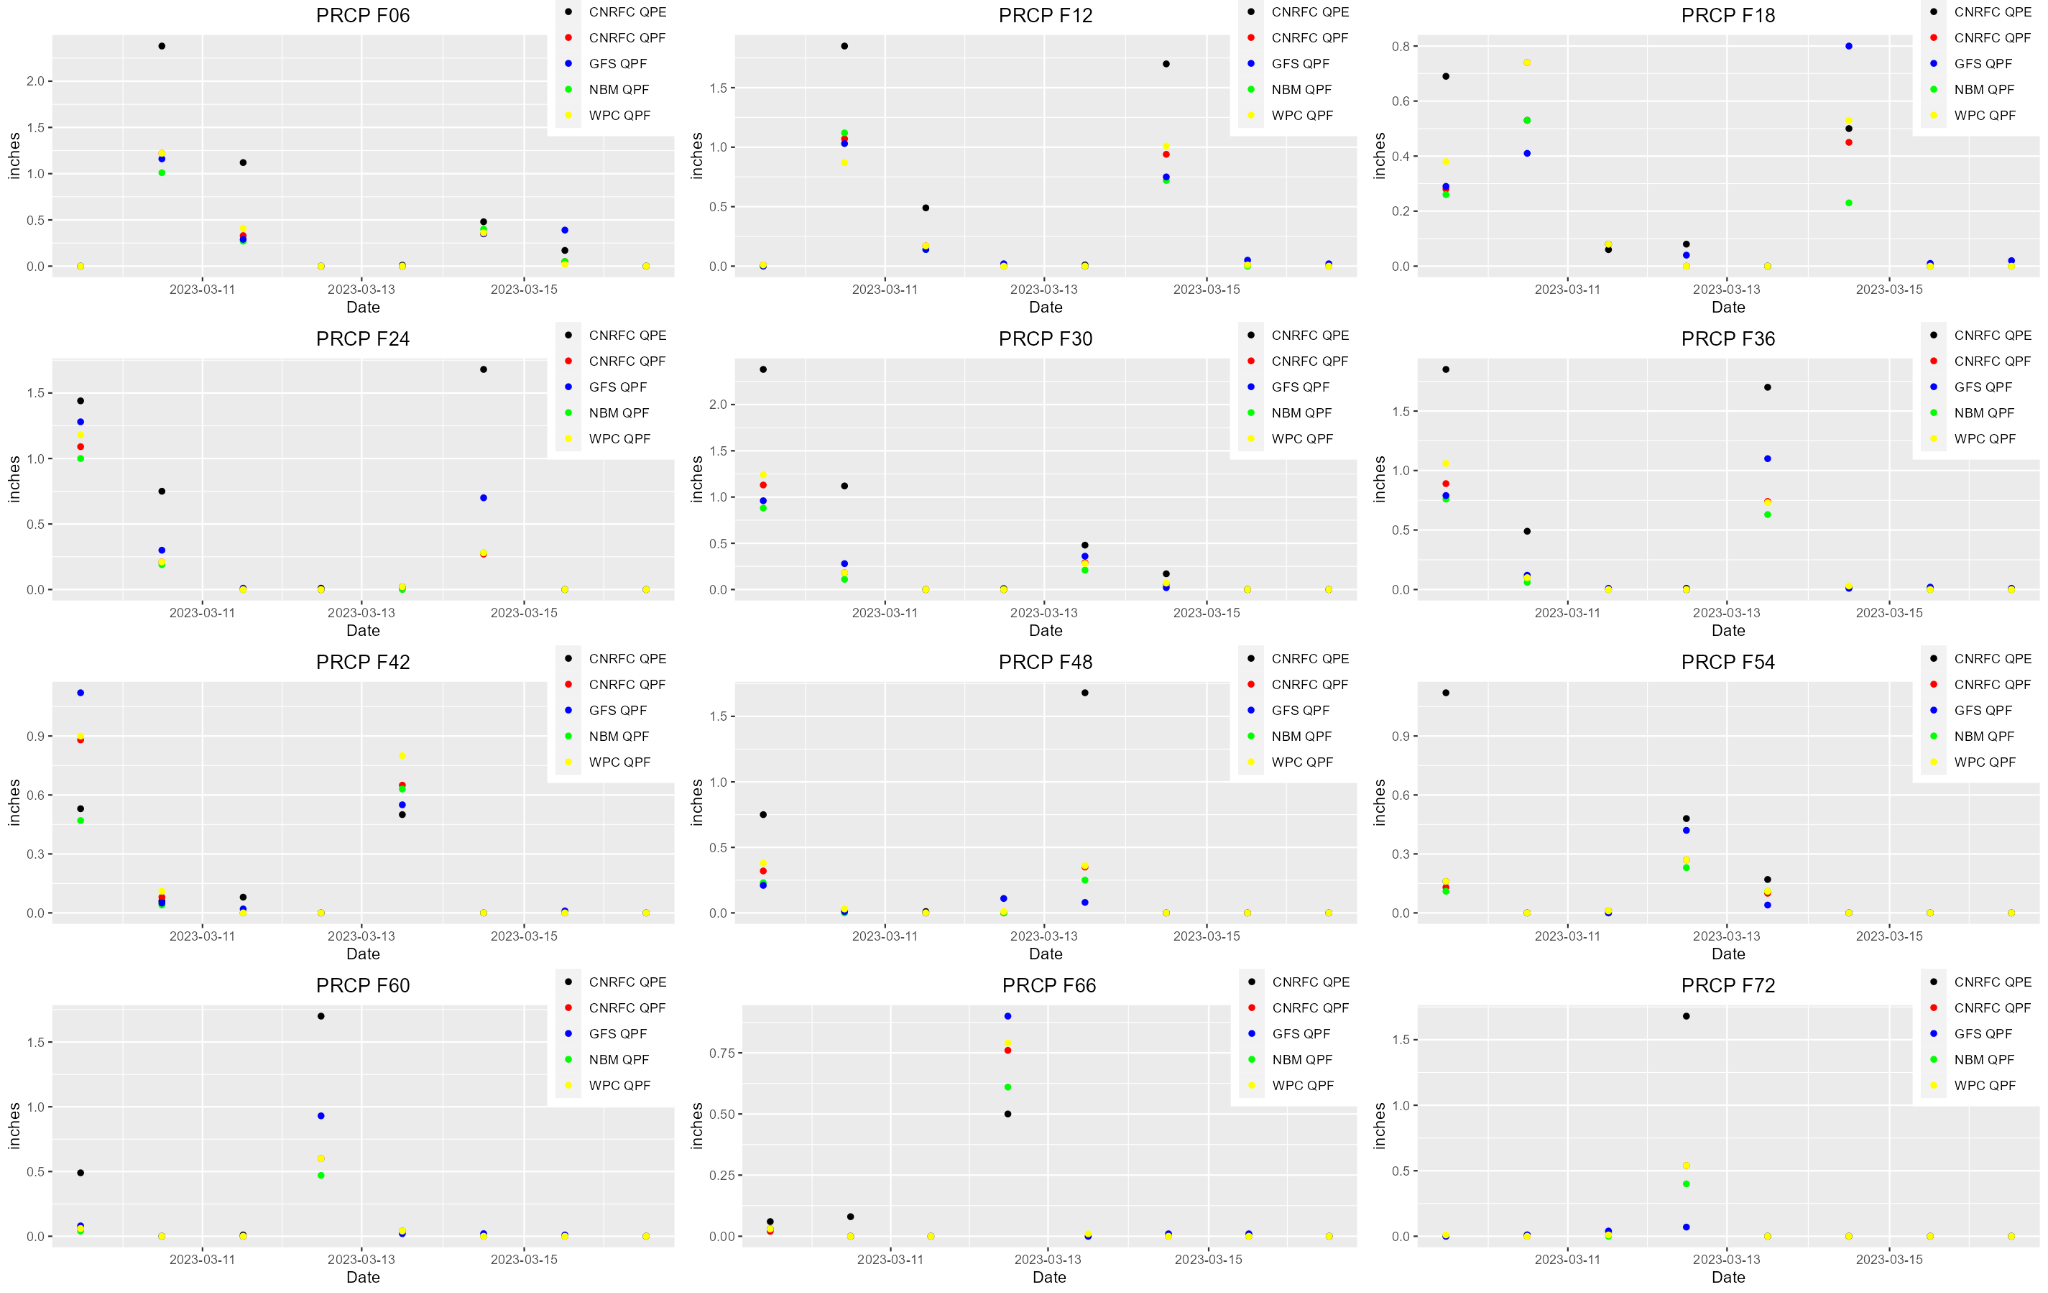 The image below displays 6-hour QPF amounts for the CNRFC, GFS, NBM, and WPC, along with 6-hour QPE amounts out to 72 hours (3 days) for the Kern River - Fairview Dam (KKVC1) basin (lower elevations of the basin) from December 1, 2022, though March 31, 2023. Click on the image below to enlarge and open in a new tab. 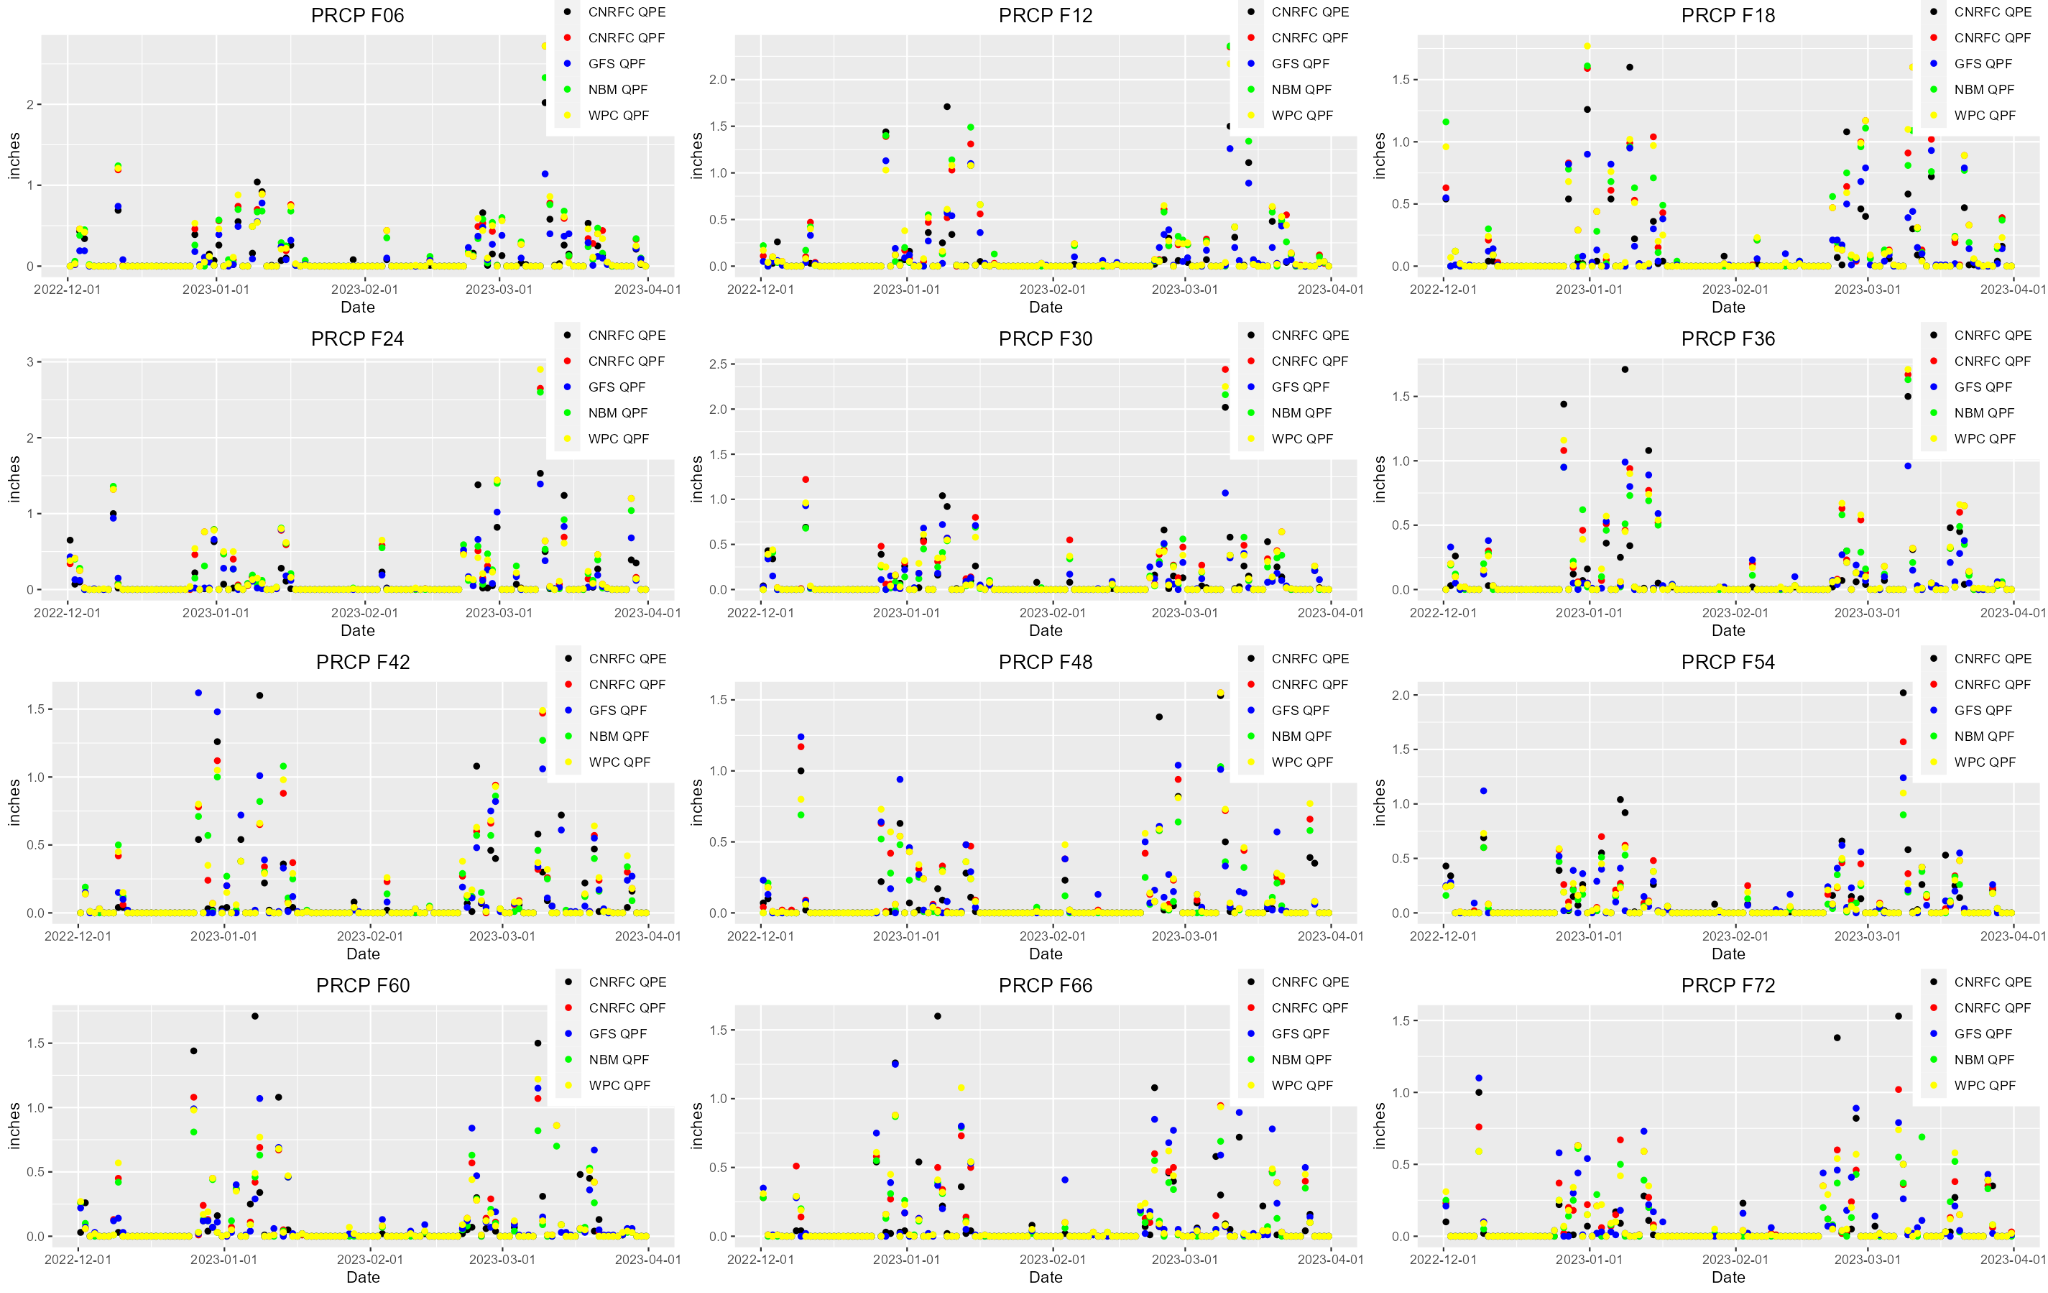 The image below displays 6-hour QPF amounts for the CNRFC, GFS, NBM, and WPC, along with 6-hour QPE amounts out to 72 hours (3 days) for the Kern River - Fairview Dam (KKVC1) basin (lower elevations of the basin) from March 9, 2023, though March 16, 2023. Click on the image below to enlarge and open in a new tab. 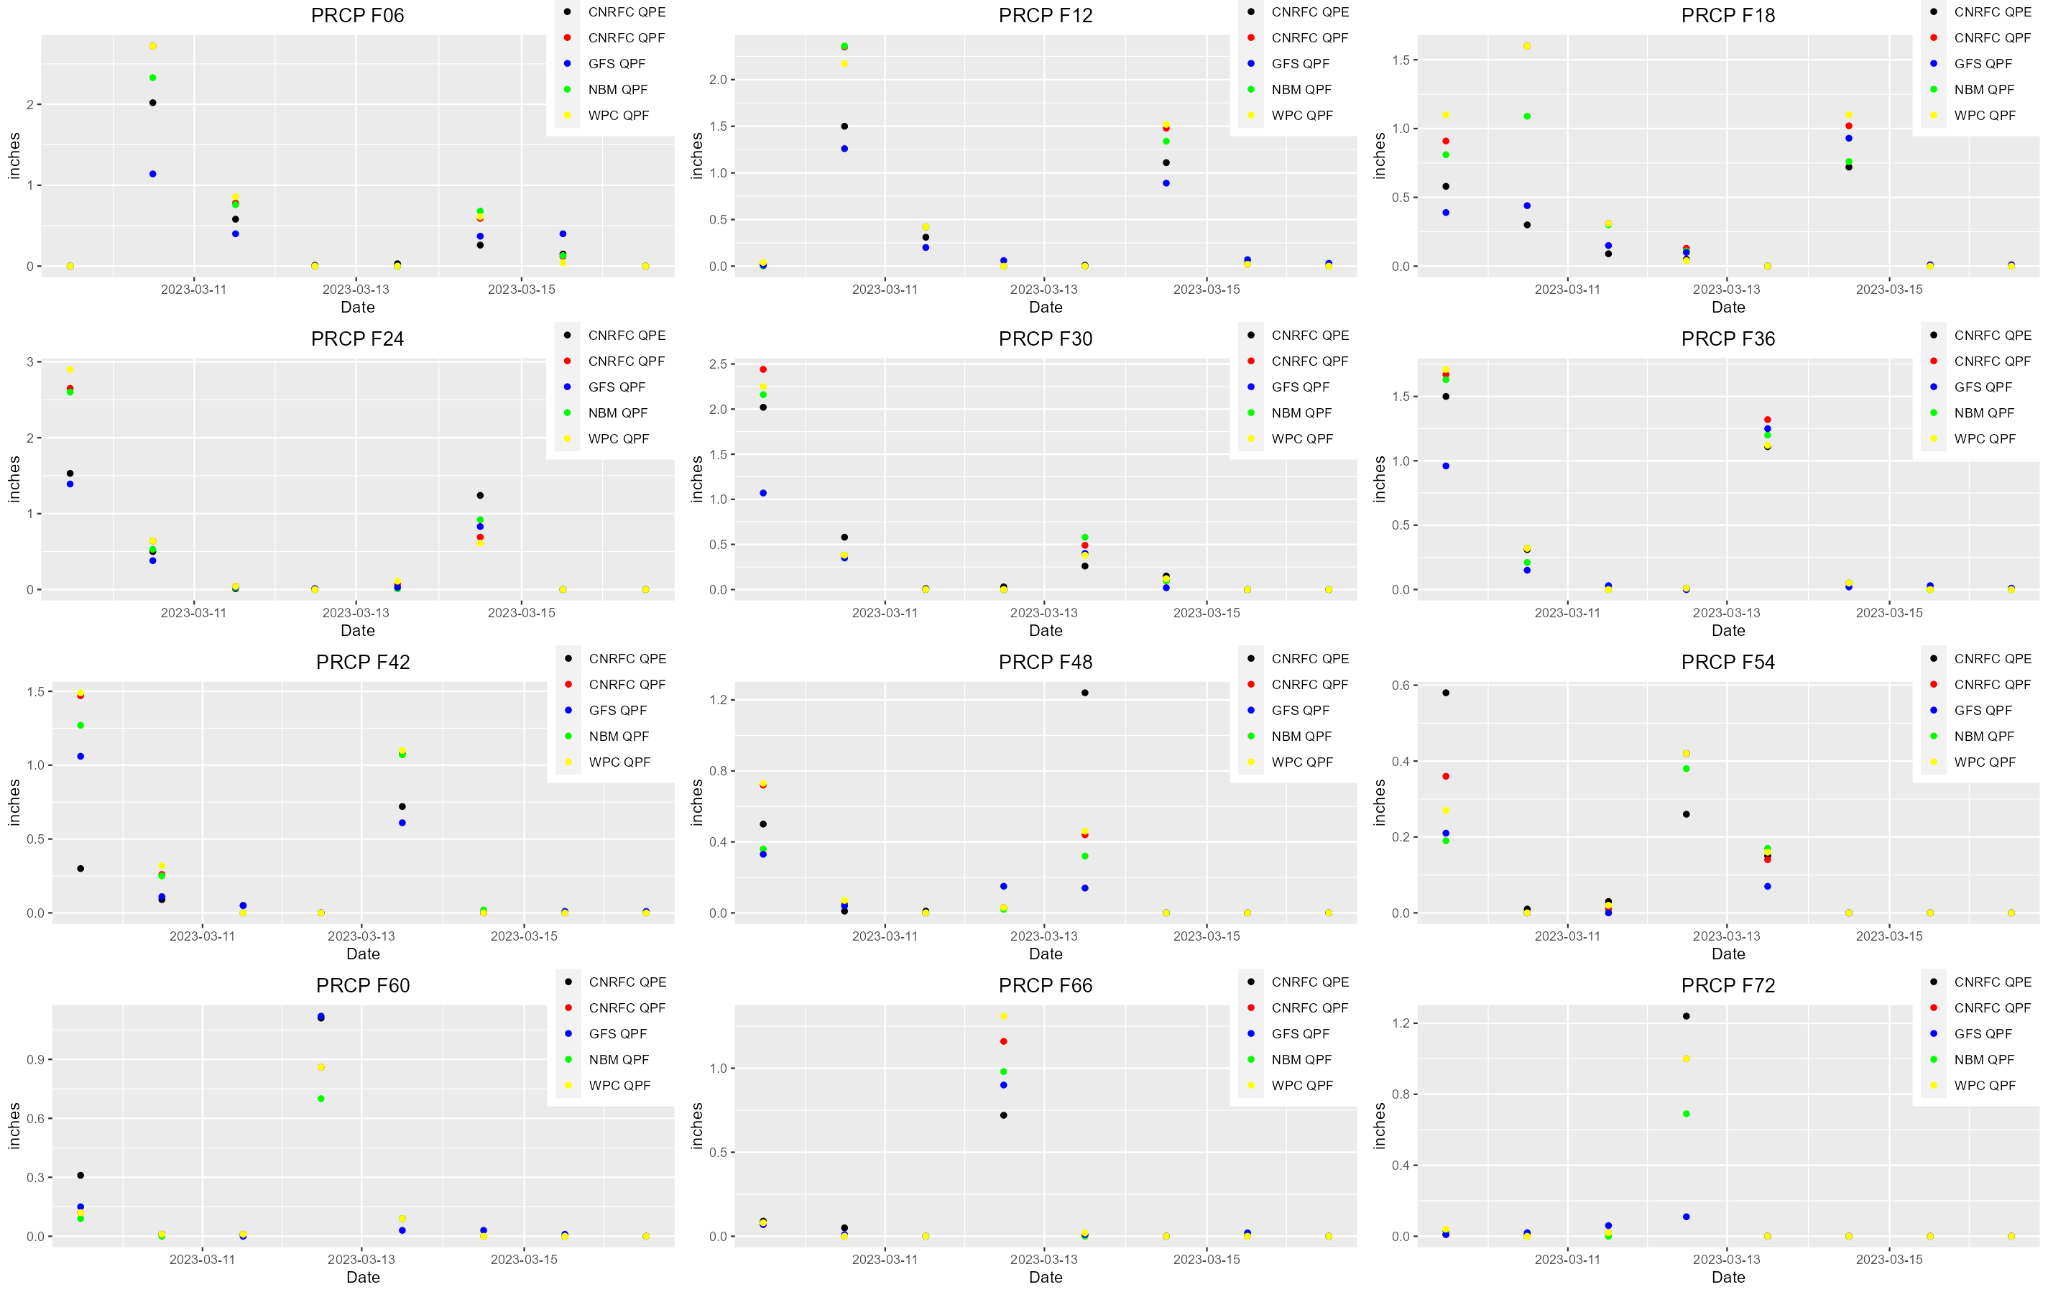 CNRFC River Forecast Groups: Days 4-6 Totals Overall, the CNRFC QPF for the 17 river forecast groups verified the best for days 4-6 when looking at MAE, RMSE, and HSS when compared to the WPC, NBM, and GFS QPF. Looking at the PBIAS, overall the CNRFC has the least bias for Day 4 compared to the WPC, GFS, and NBM QPF. For Day 5, the GFS had the least bias for slightly more forecast groups than the CNRFC. Finally, on Day 6, the NBM had the least bias for more of the forecast groups compared to the CNRFC, GFS, and WPC QPF. CNRFC QPF generally does better for days 4-6, but tends to underestimate more on days 5 and 6, with the exception of an overestimate for the Klamath, East Sierra, Feather/Yuba, and Lower Sacramento forecast groups. Morning Versus Afternoon Forecasts During the winter operations season (November 1 through April 15) on weekdays, the CNRFC typically issues at least two forecasts per day, one in the morning and one in the afternoon. For verification purposes, only the CNRFC and GFS QPF were available for the afternoon forecast (18Z). Looking at most of the forecast groups, the afternoon forecasts had less bias (looking at the PBIAS) than the morning forecasts for Day 1. For Days 2 and 3, the least forecast bias was more equally divided between morning and afternoon forecasts (9 forecast groups for the 12Z issuance, and 8 forecast groups for the 18Z issuance). The morning forecasts generally have less bias than the afternoon forecasts for Days 4-6. The morning forecasts generally have a lower Mean Absolute Error (MAE), except on Day 4 where more forecast groups have lower MAE in the afternoon (9 forecast groups at 18Z issuance and 7 forecast groups at 12Z issuance). The morning forecasts generally had a lower Root Mean Squared Error (RMSE) than the afternoon forecasts, but was more equally divided on Day 4 (9 forecast groups for the 12Z issuance and 7 forecast groups for the 18Z issuance). Overall, the morning forecasts tend to verify better than the afternoon forecasts using the PBIAS, MAE, and RMSE. The images below display the individual river forecast group Mean Absolute Error (MAE) for Days 1-6 for CNRFC morning forecasts (12Z), 12Z GFS, NBM, WPC, CNRFC afternoon forecasts (18Z), and 18Z GFS. Click on the individual images below to enlarge and open in a new tab. 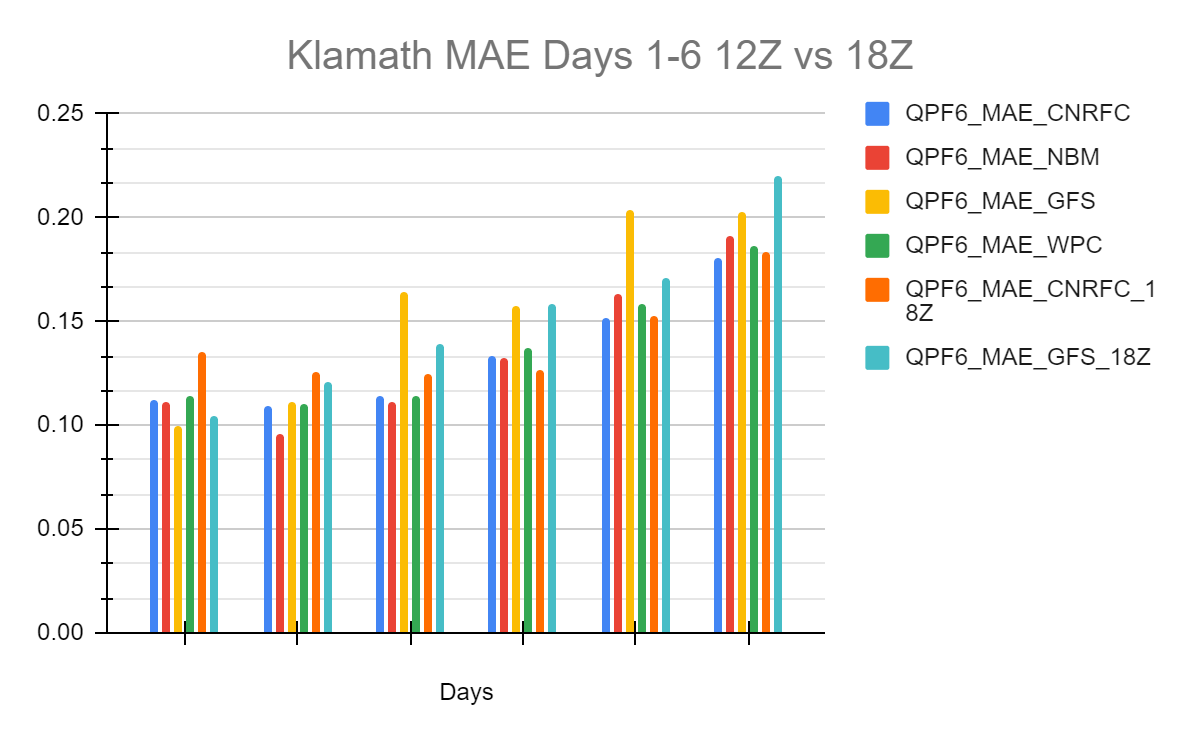 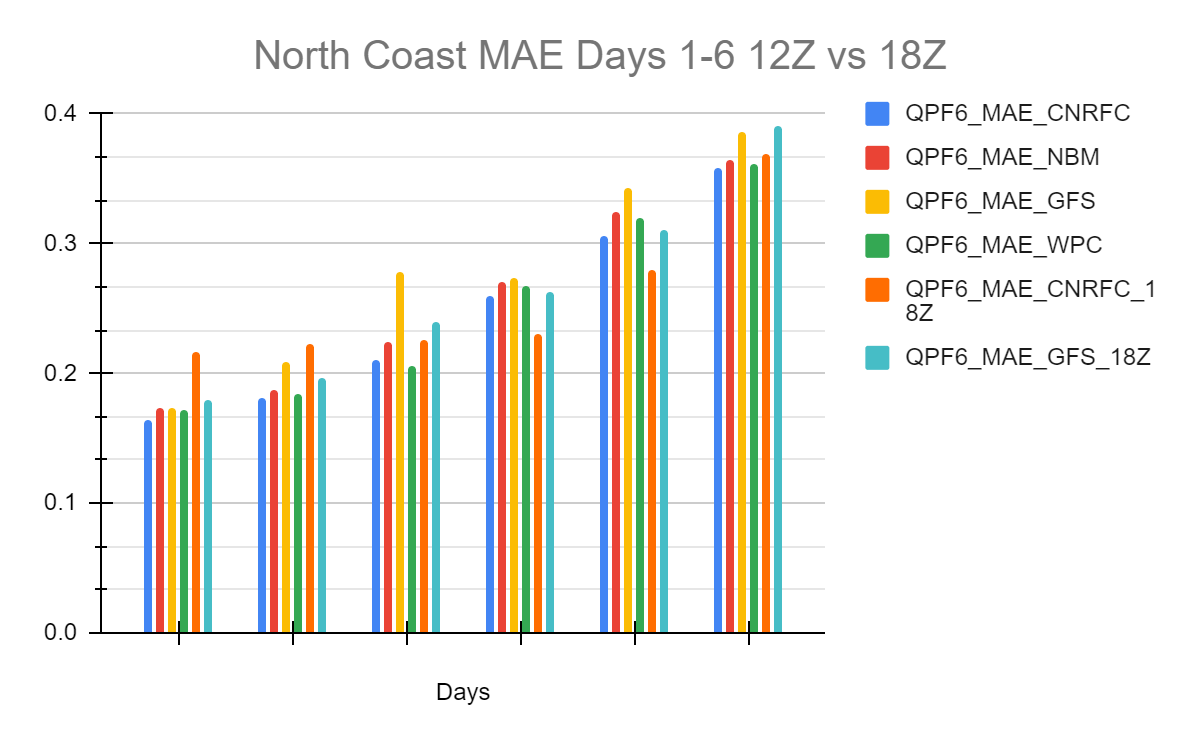 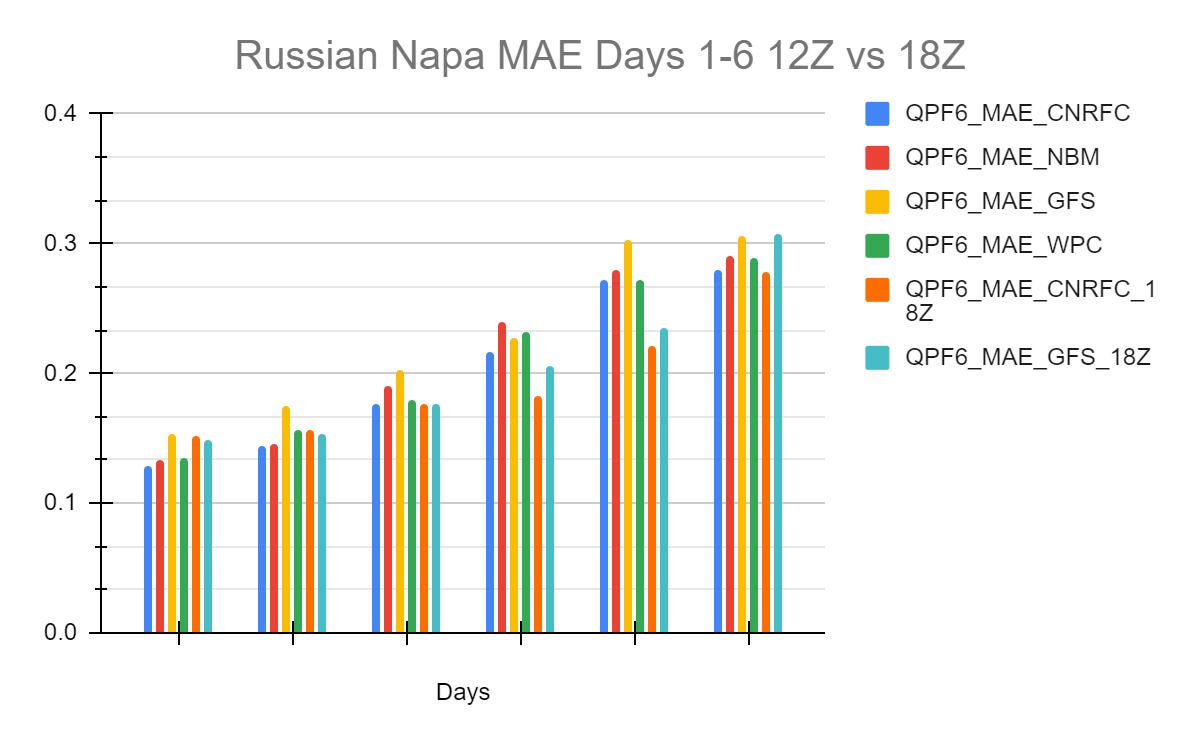 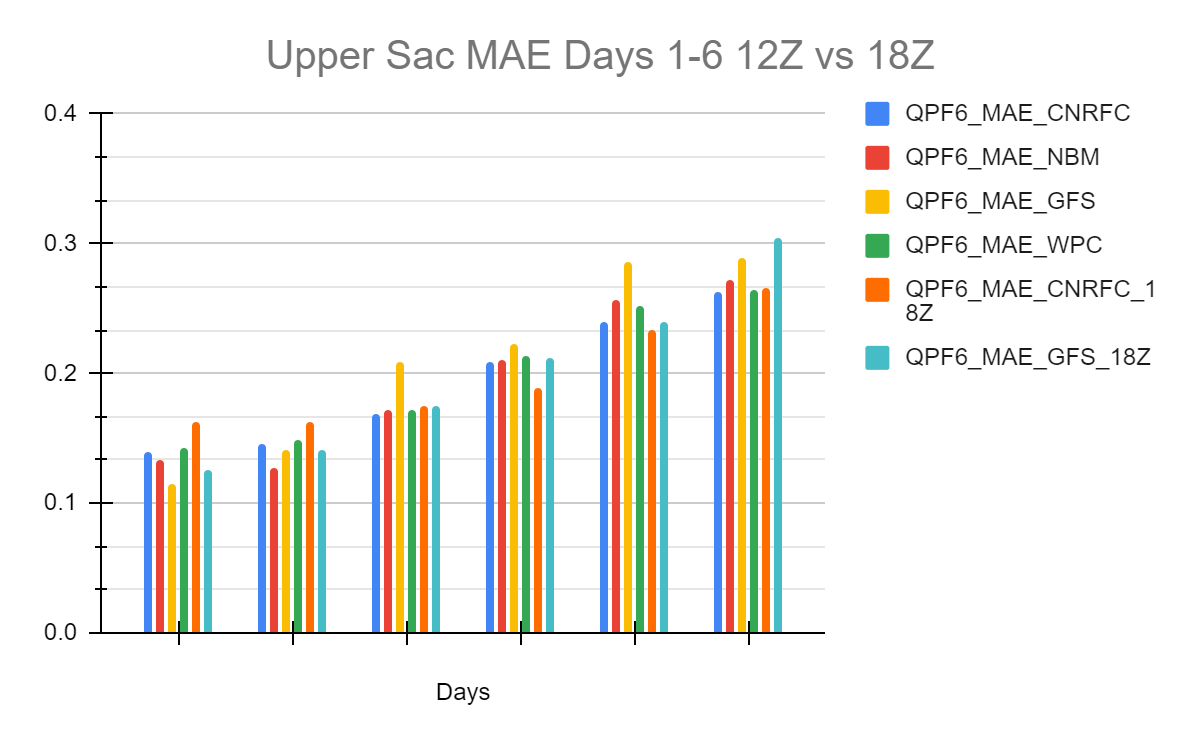 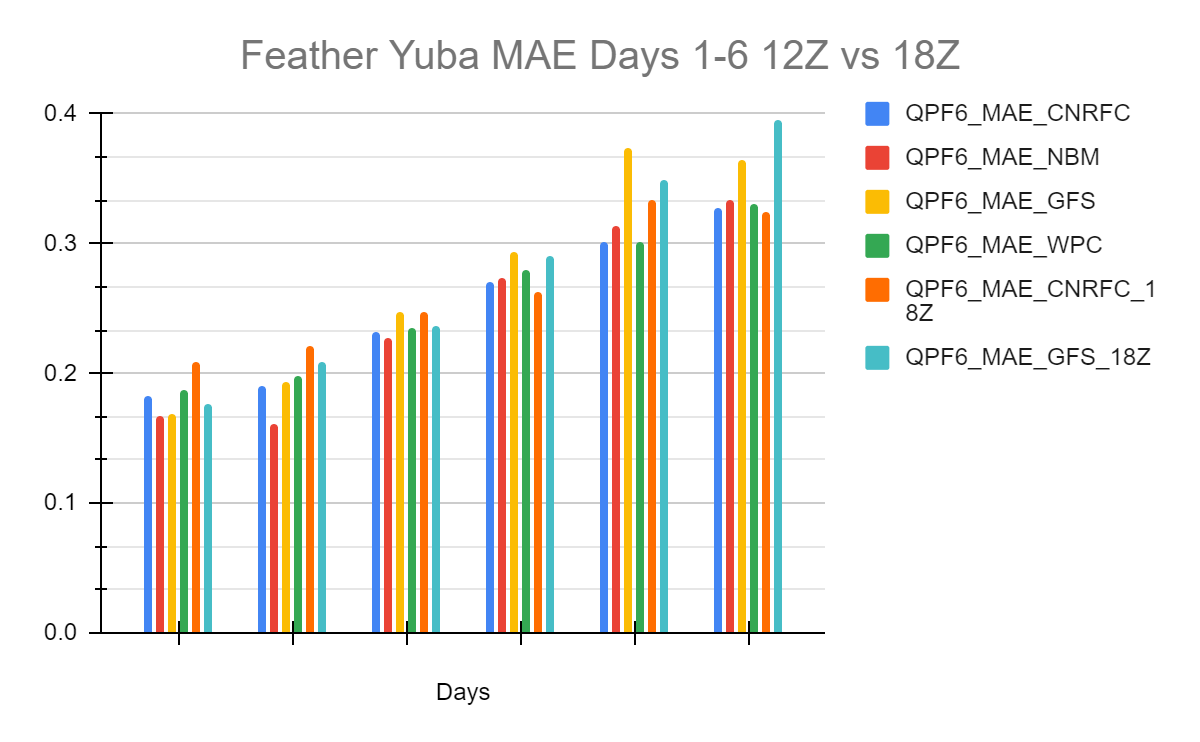 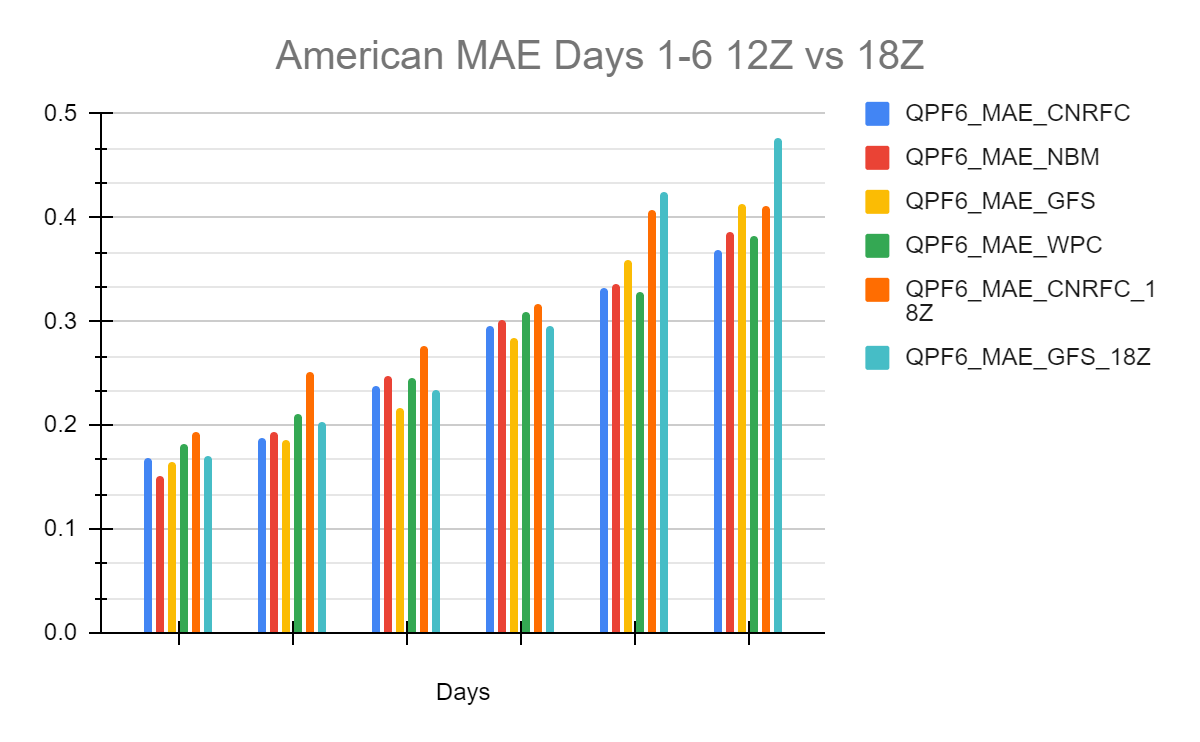 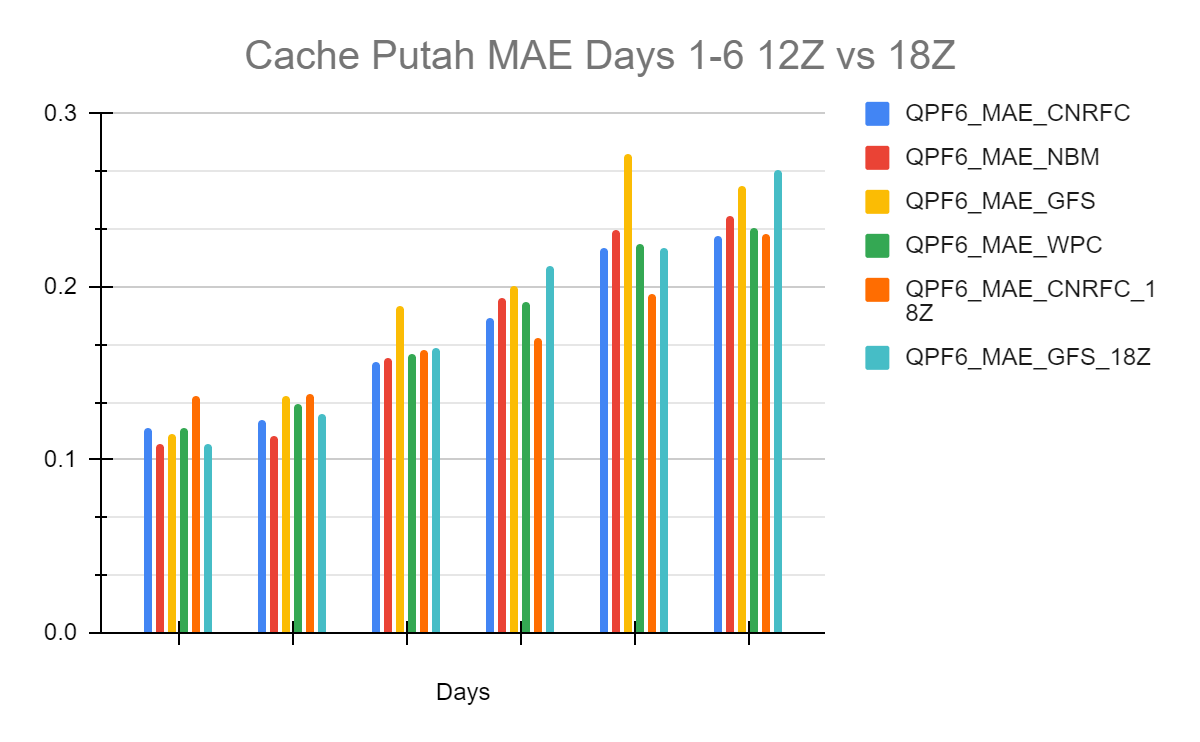 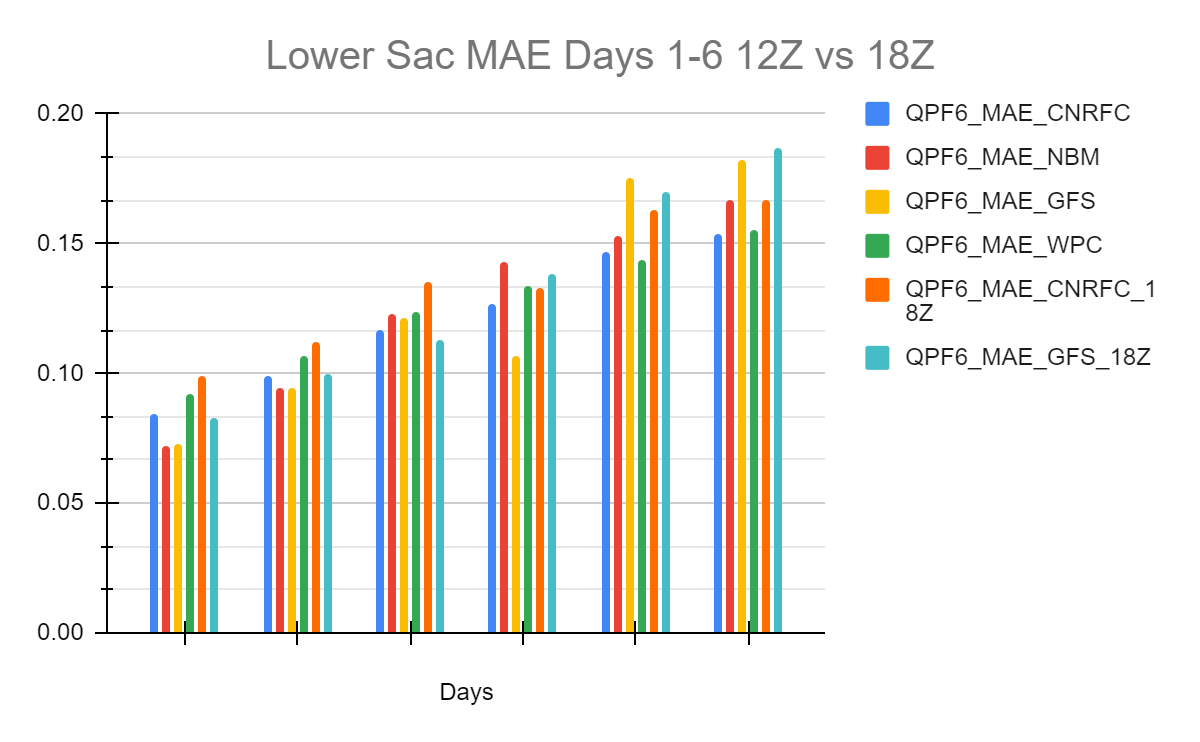  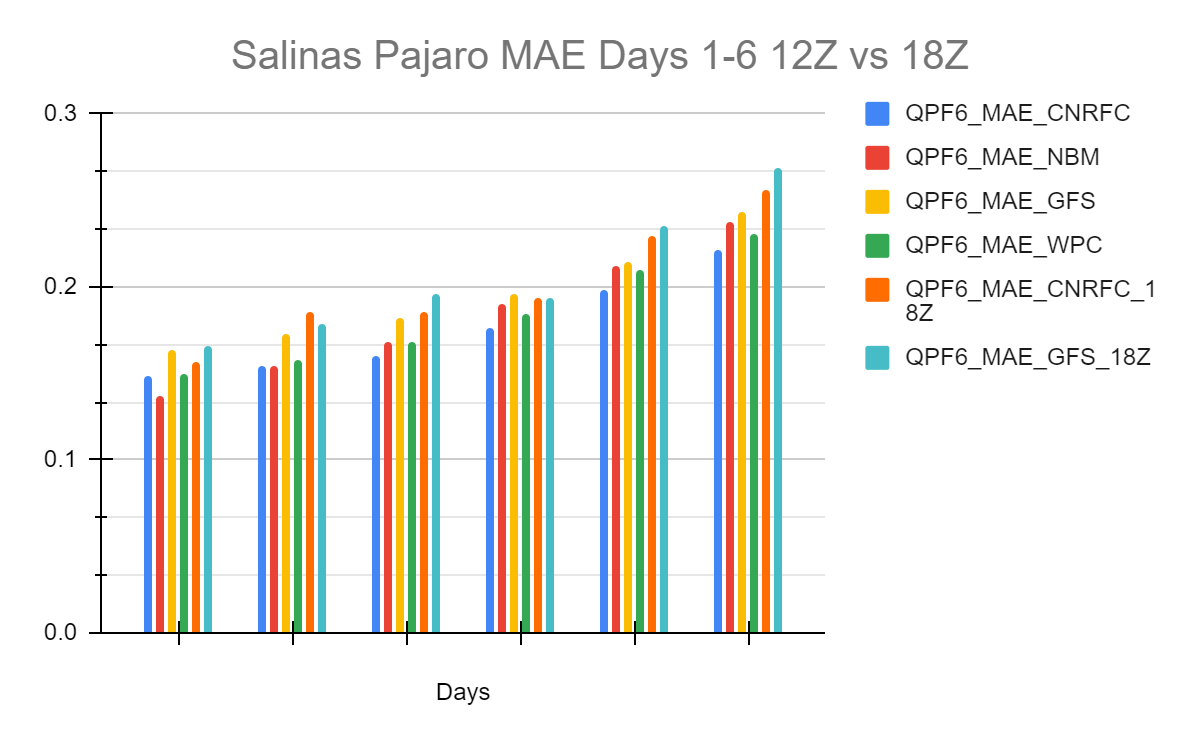 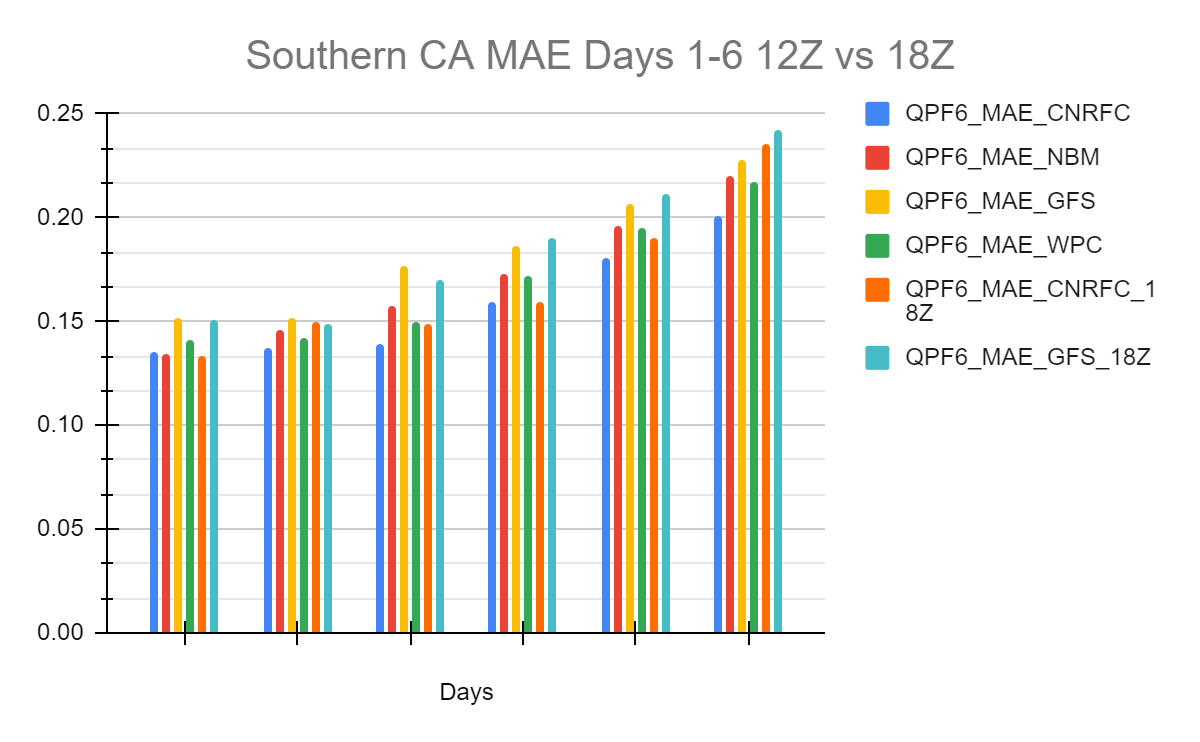 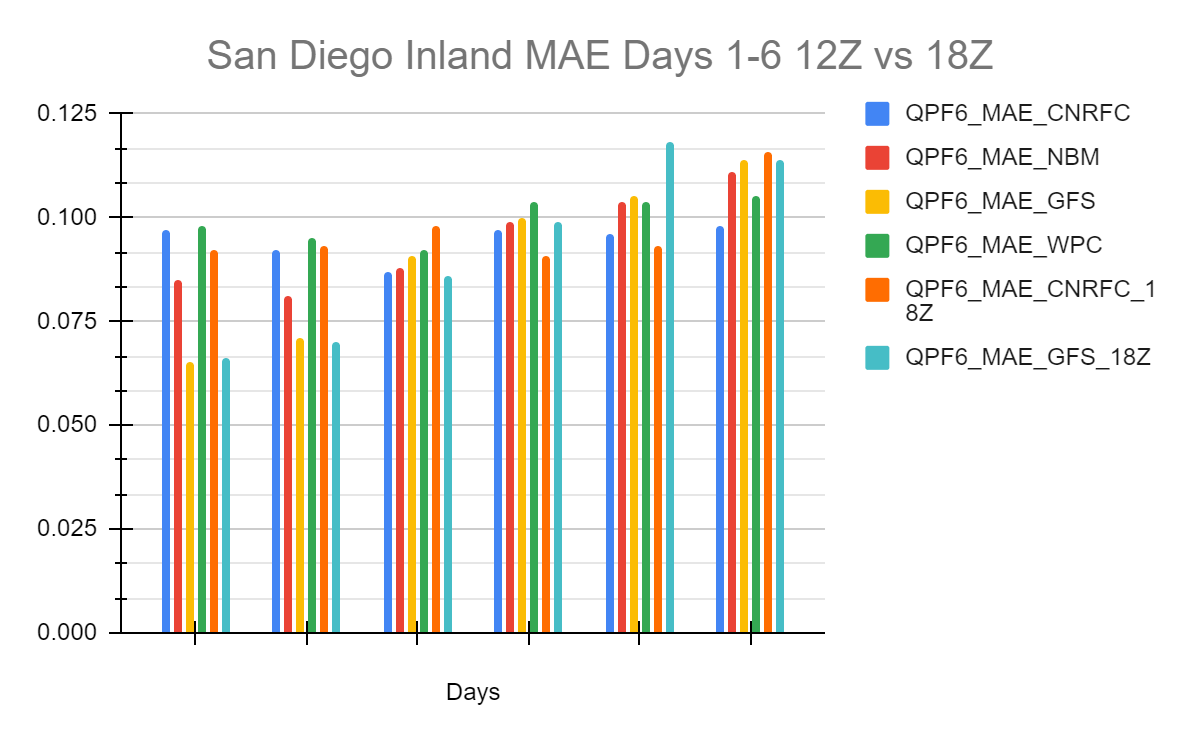 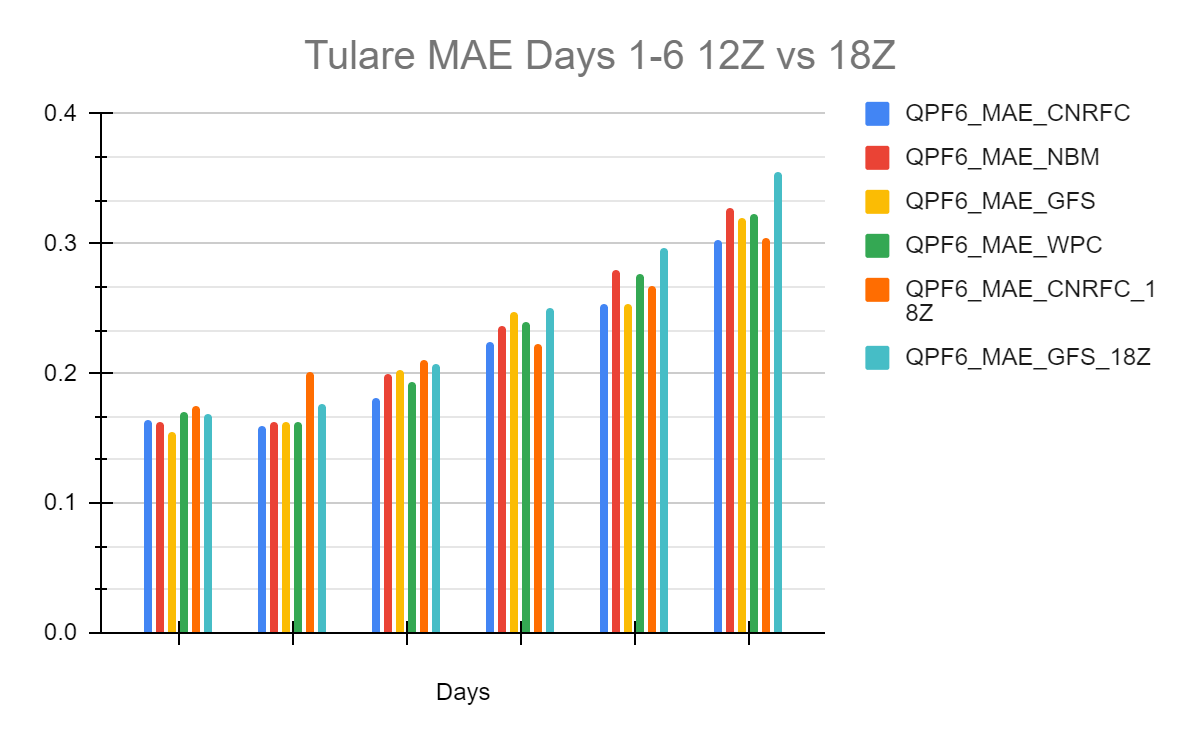 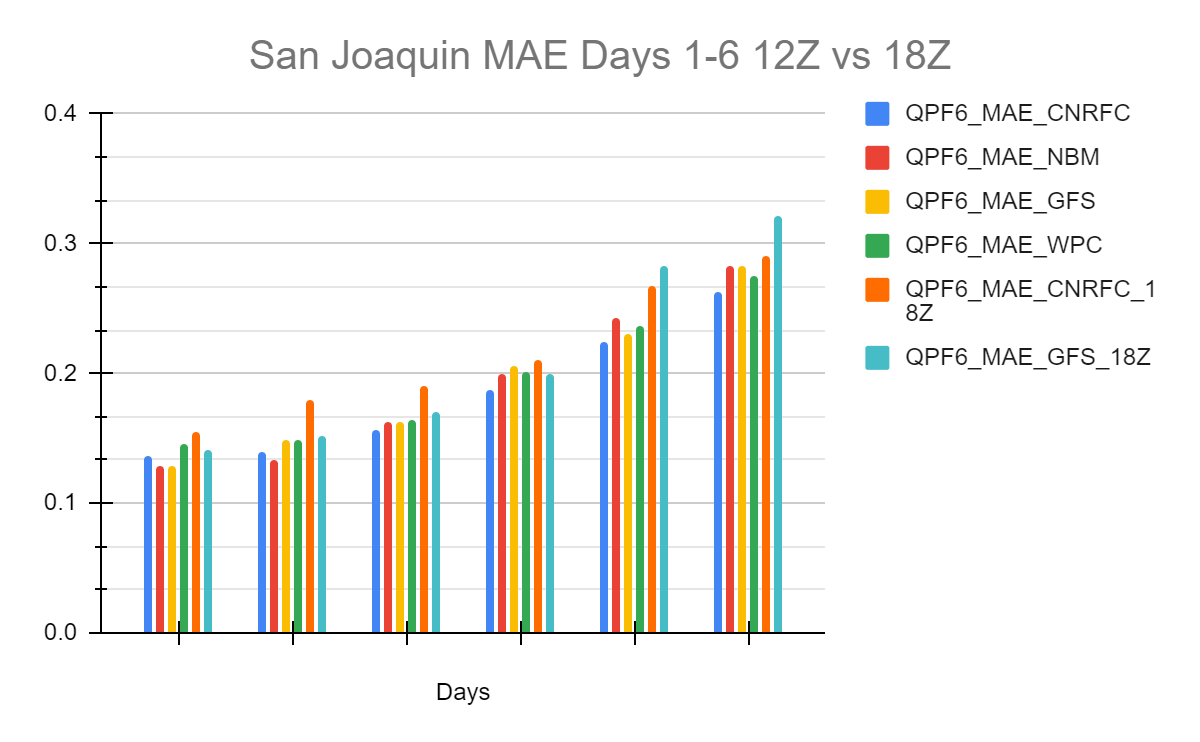 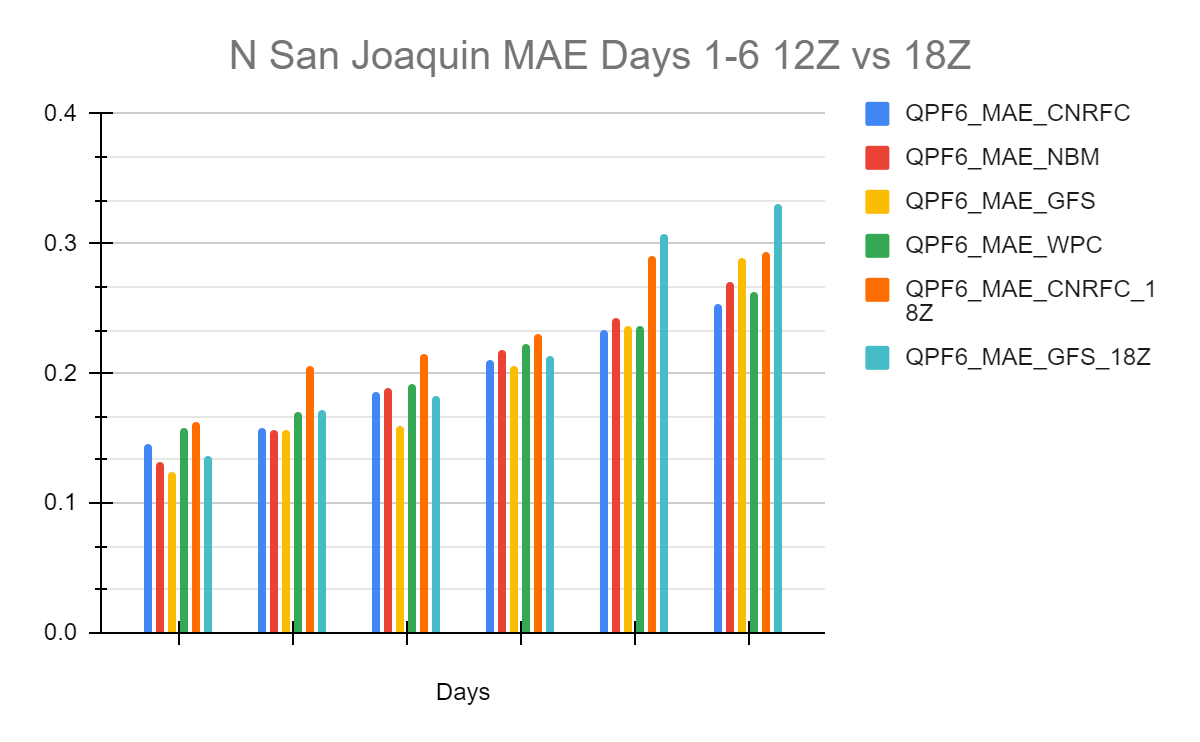 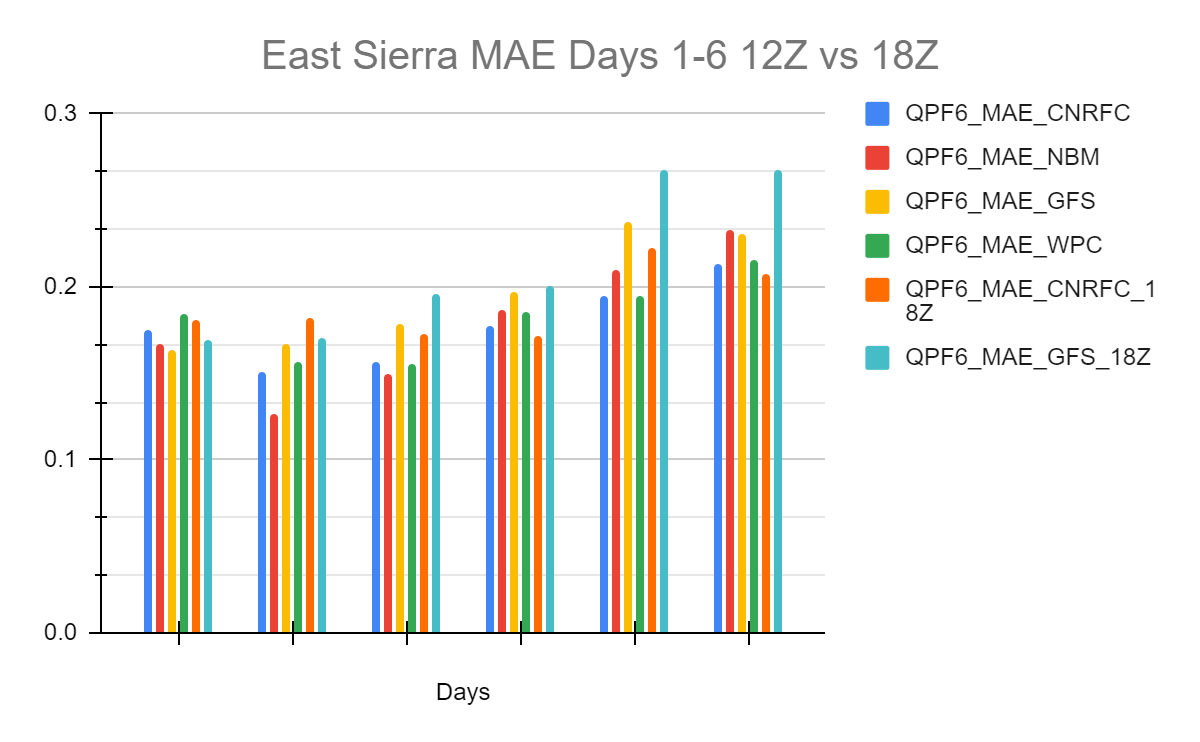 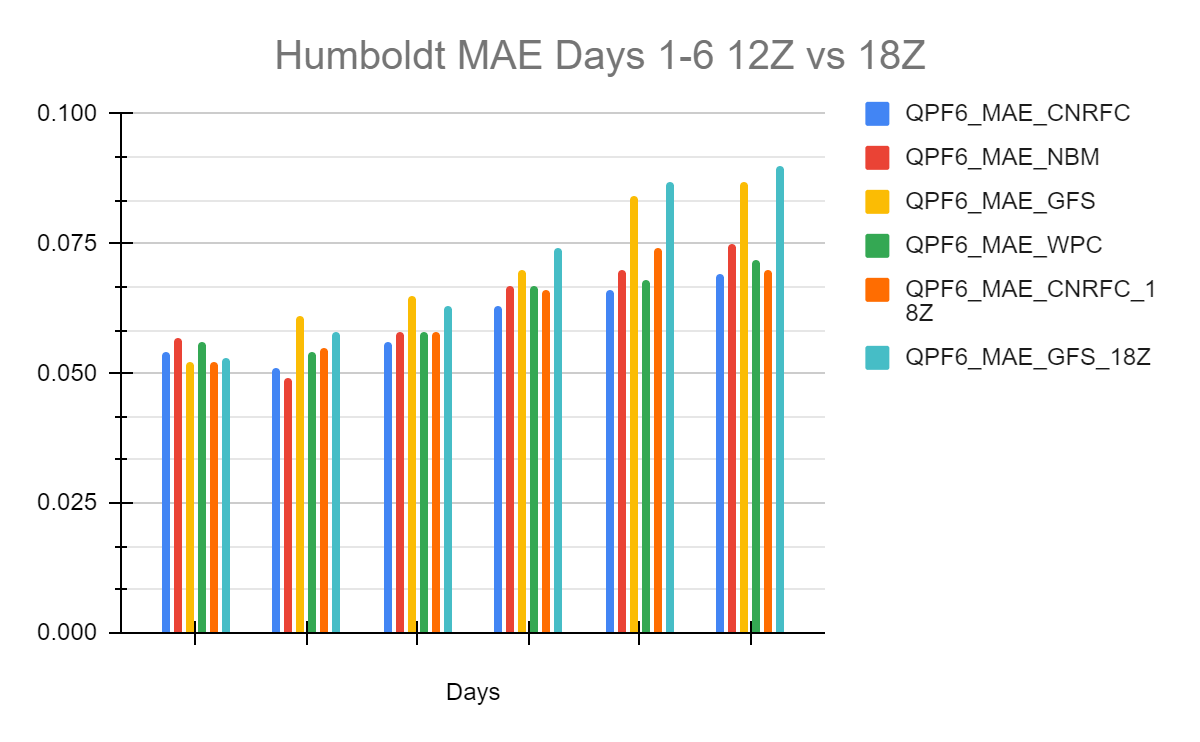 The images below display the individual river forecast group Root Mean Squared Error (RMSE) for Days 1-6 for CNRFC morning forecasts (12Z), 12Z GFS, NBM, WPC, CNRFC afternoon forecasts (18Z), and 18Z GFS. Click on the individual images below to enlarge and open in a new tab. 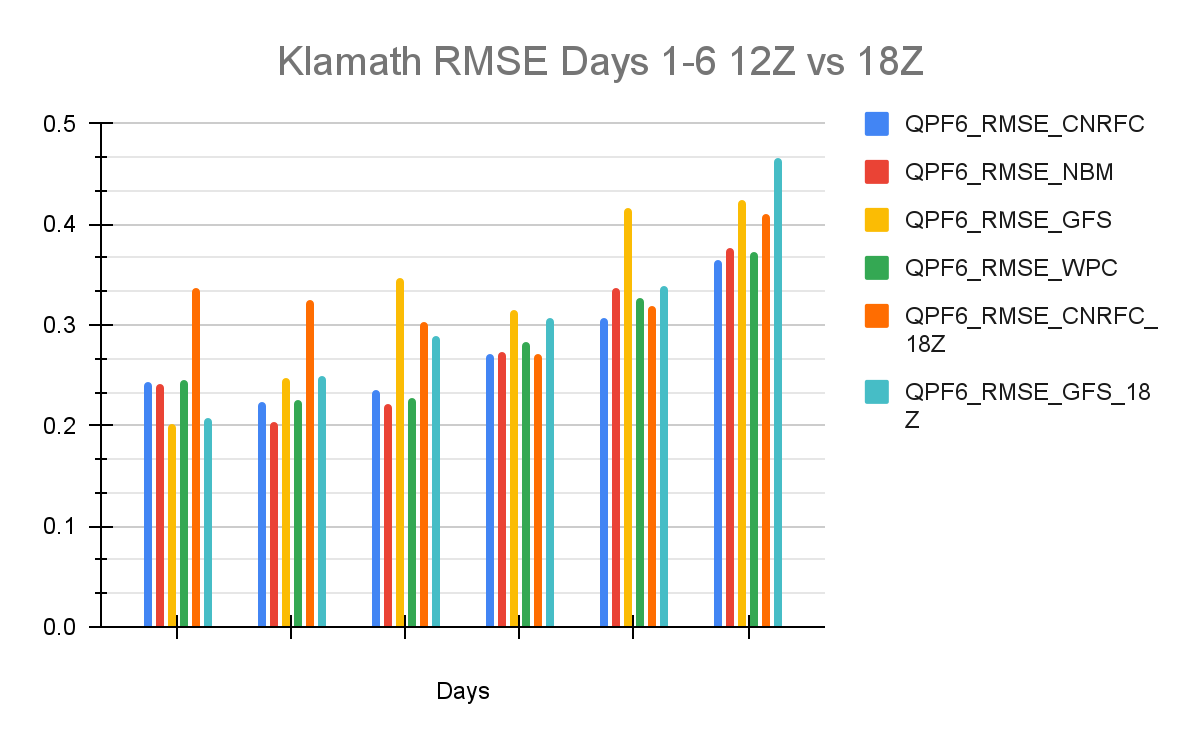  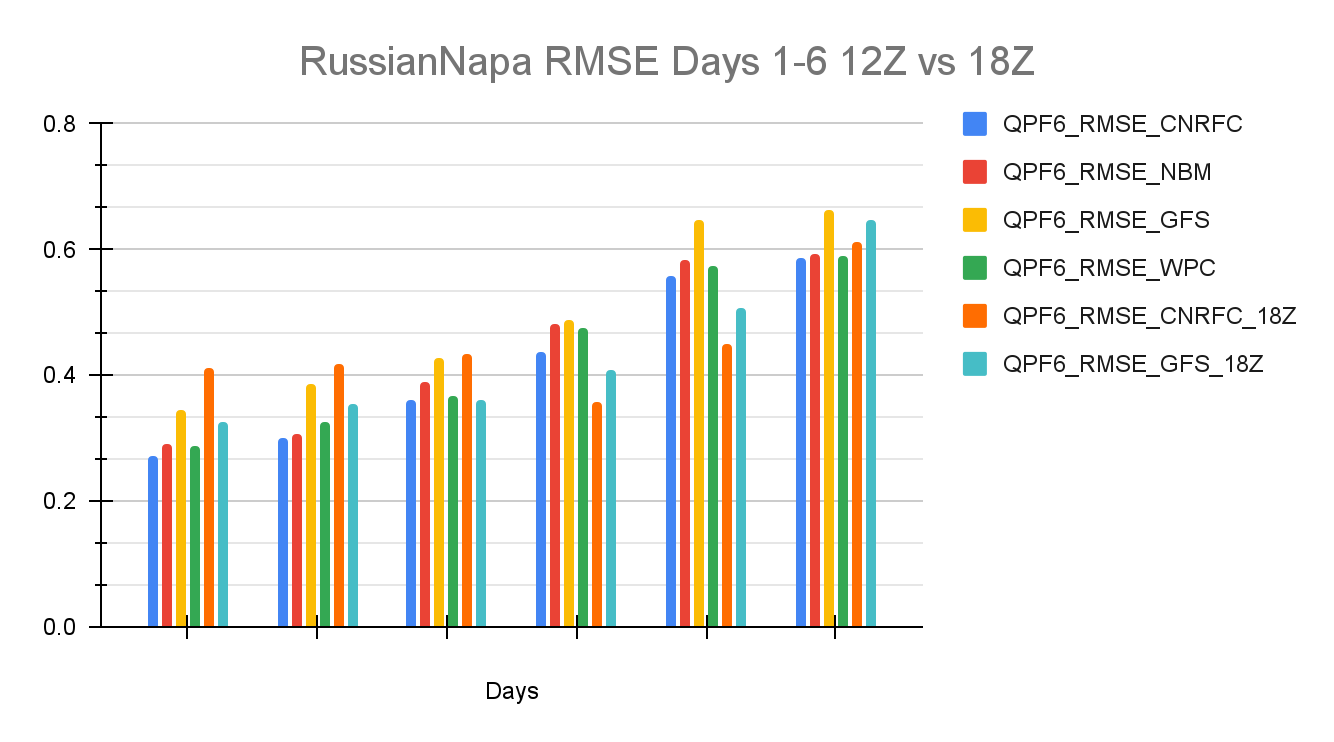 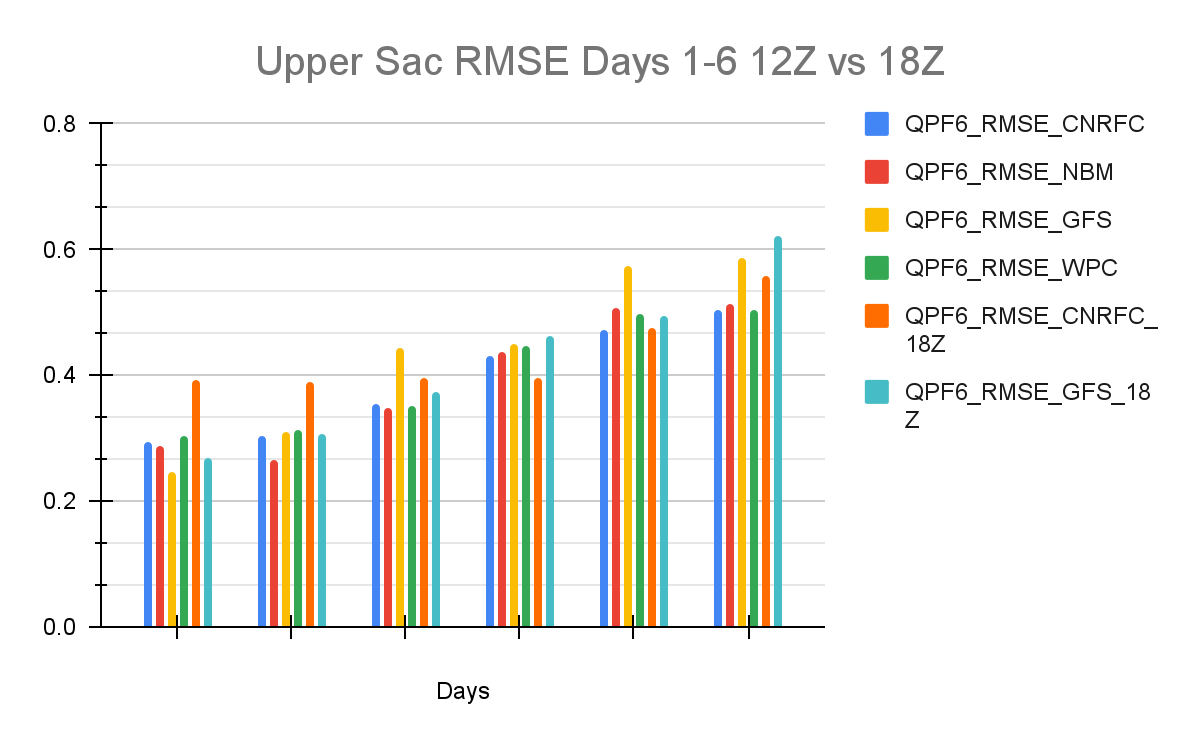 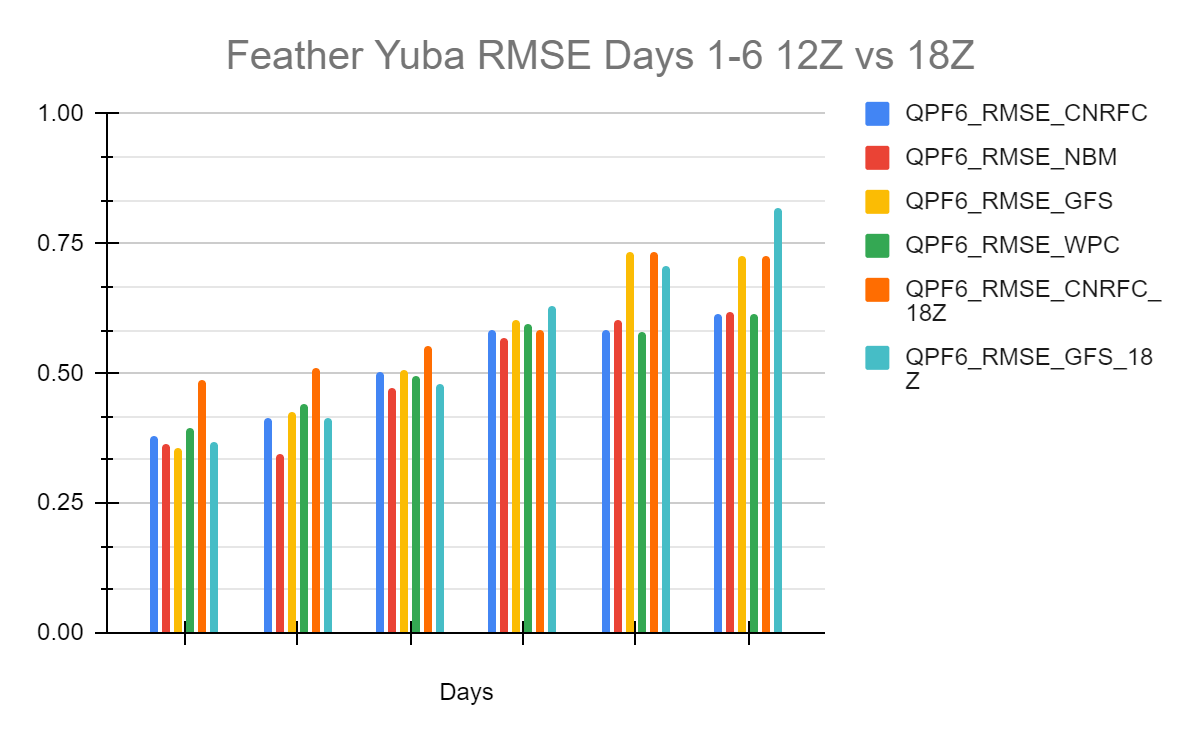 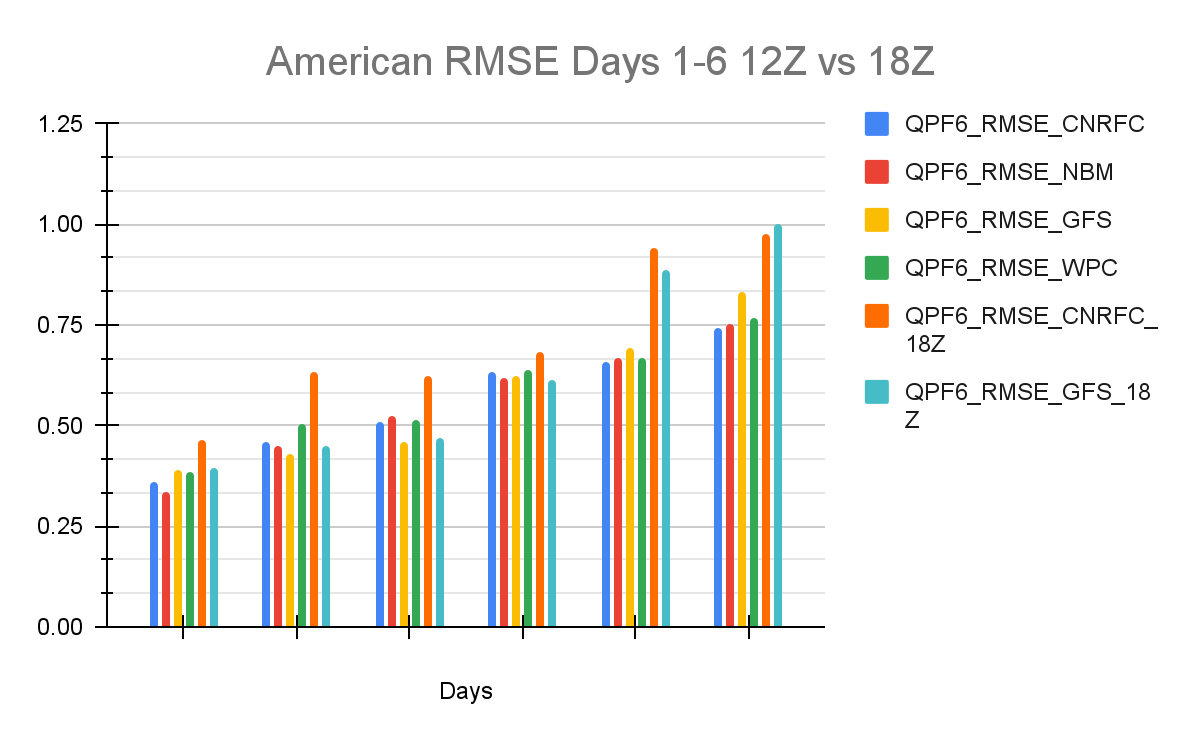 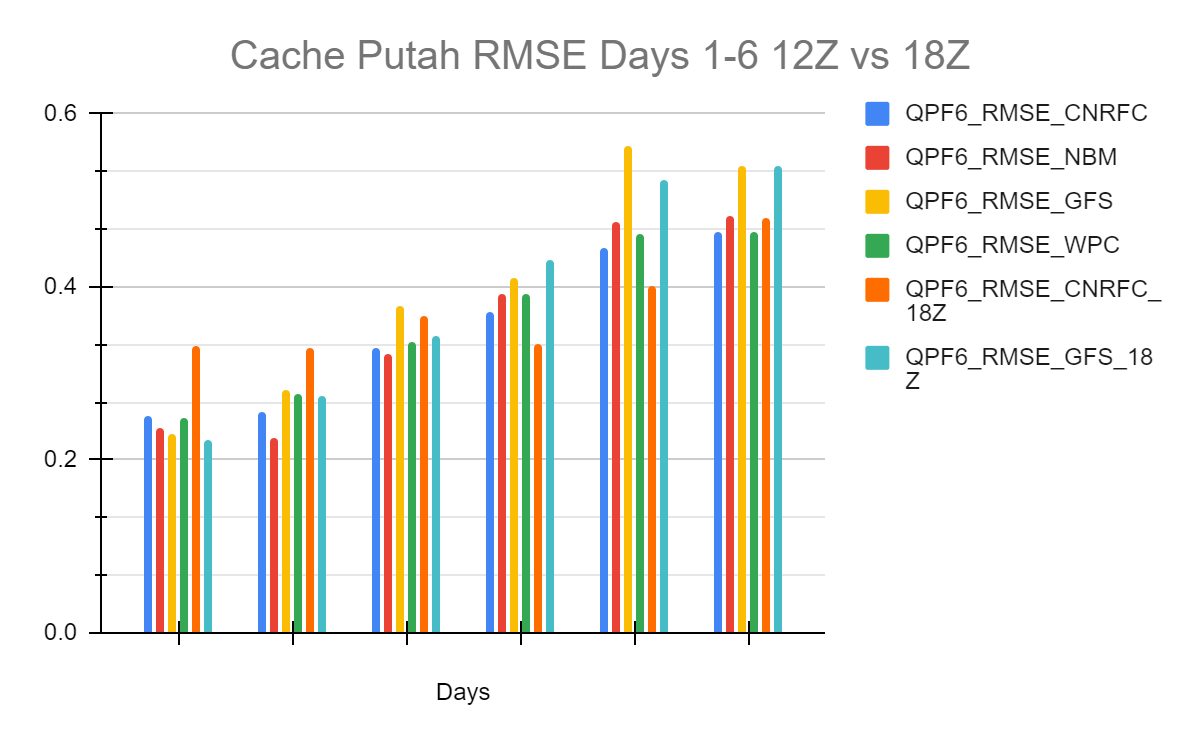 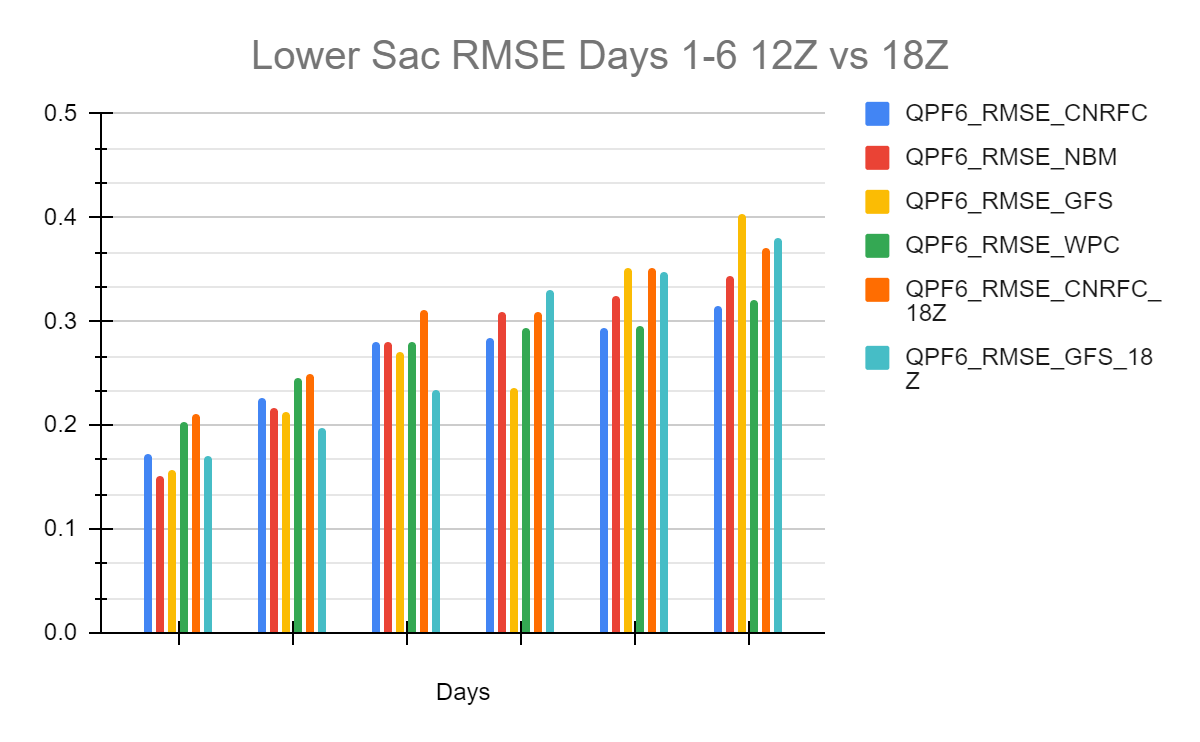 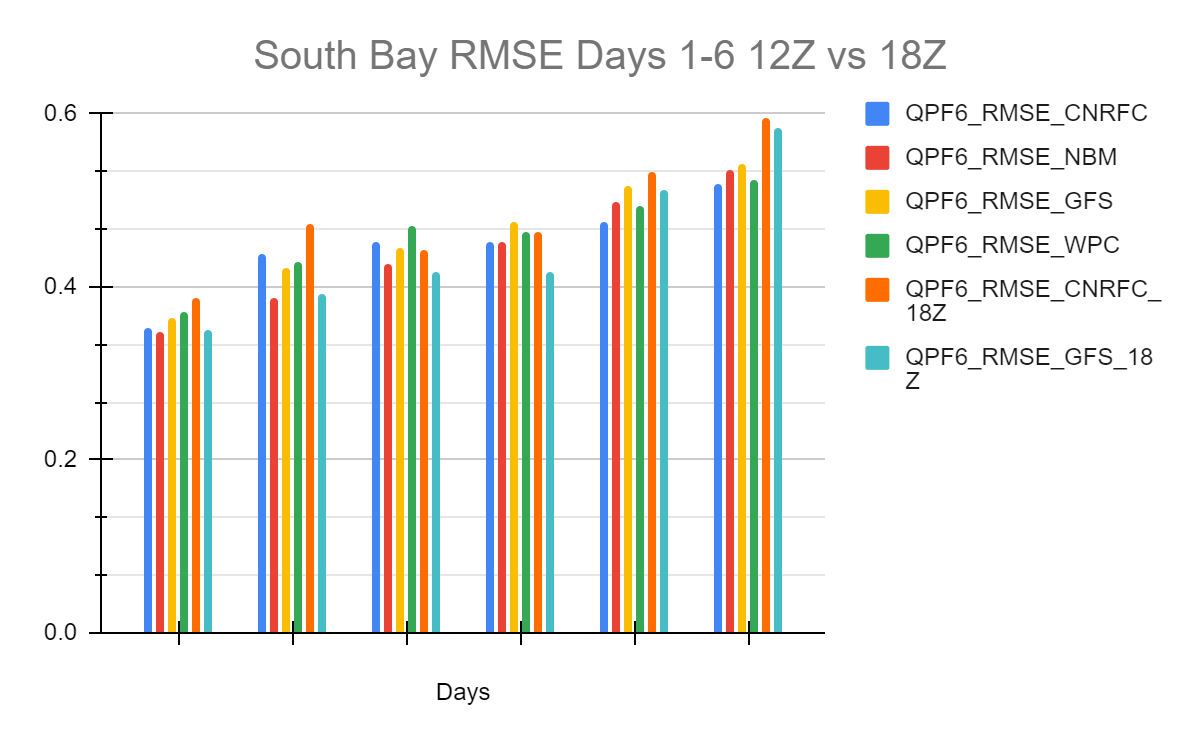  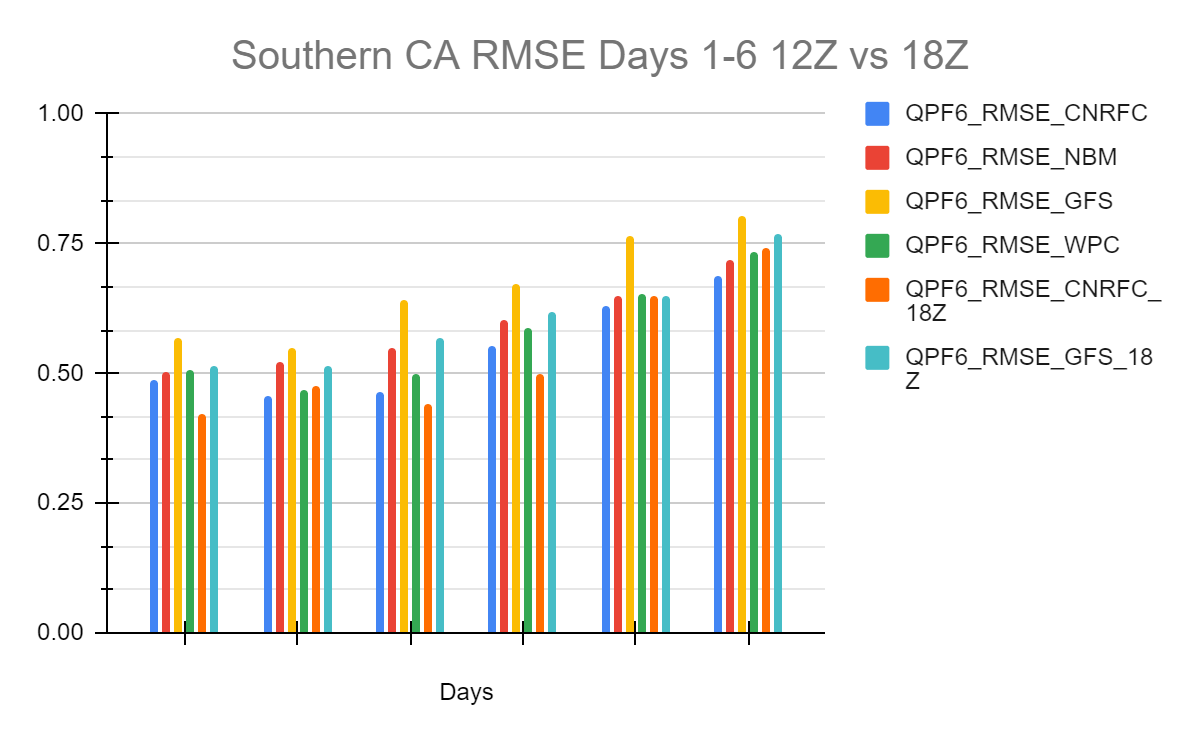 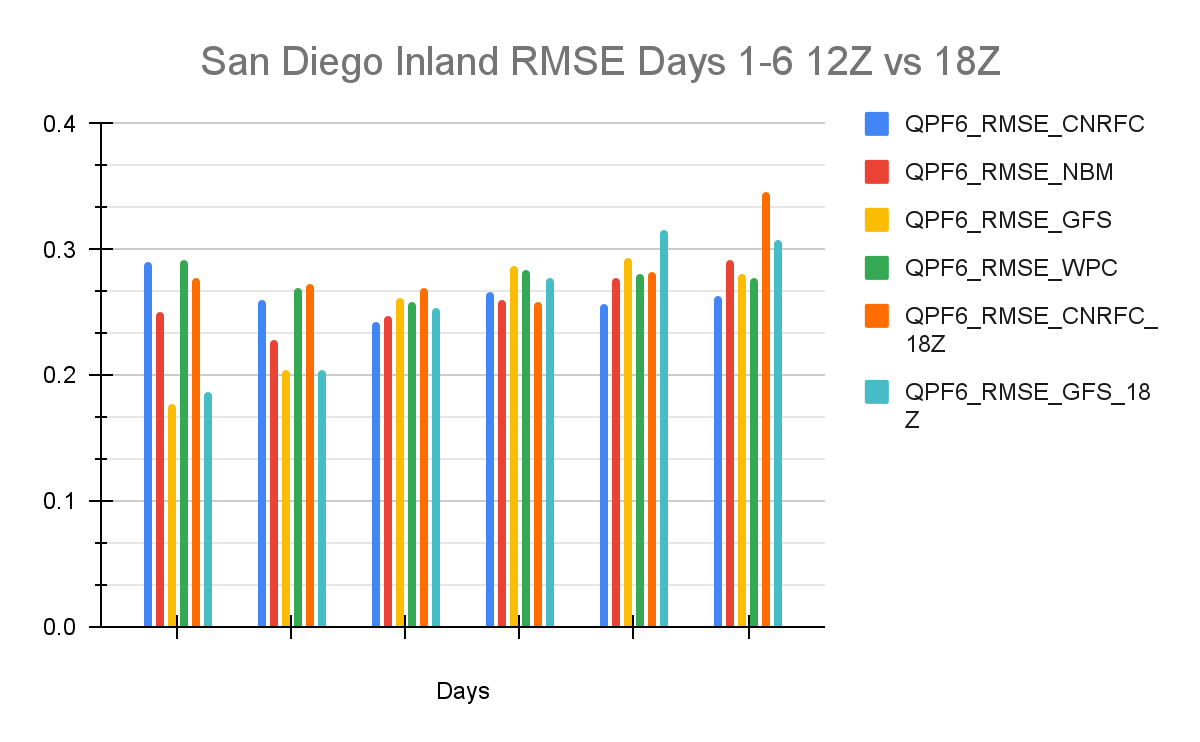 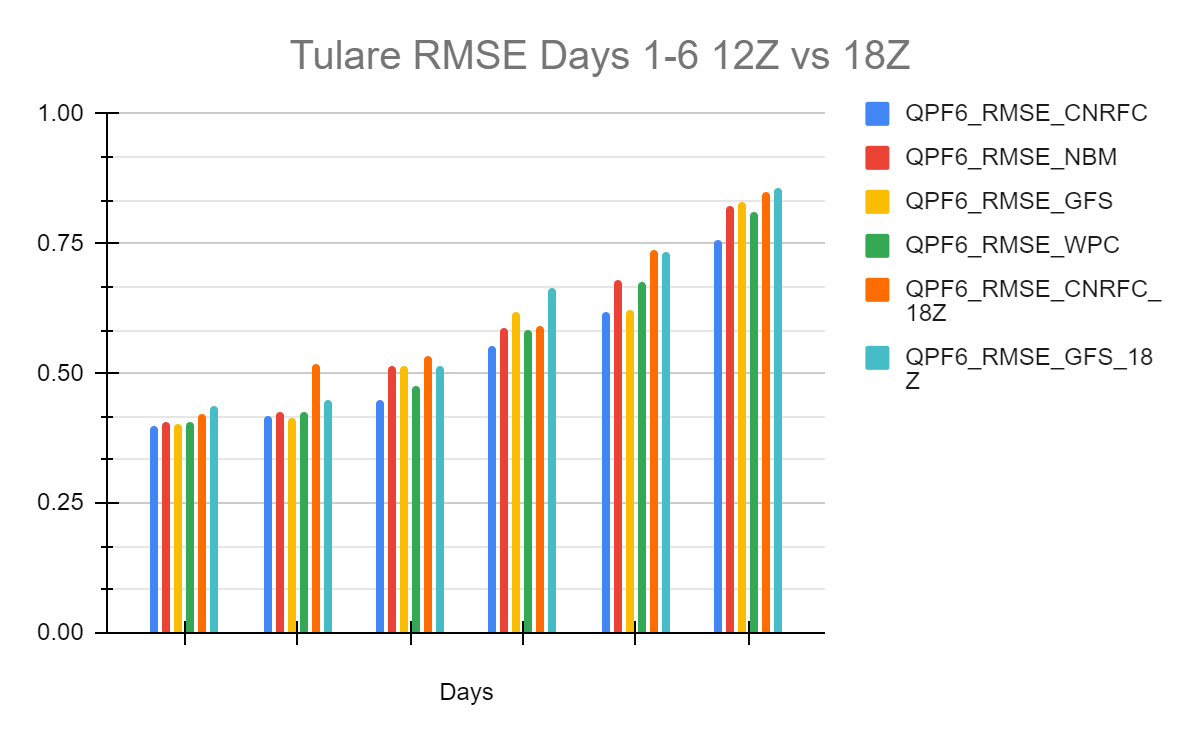 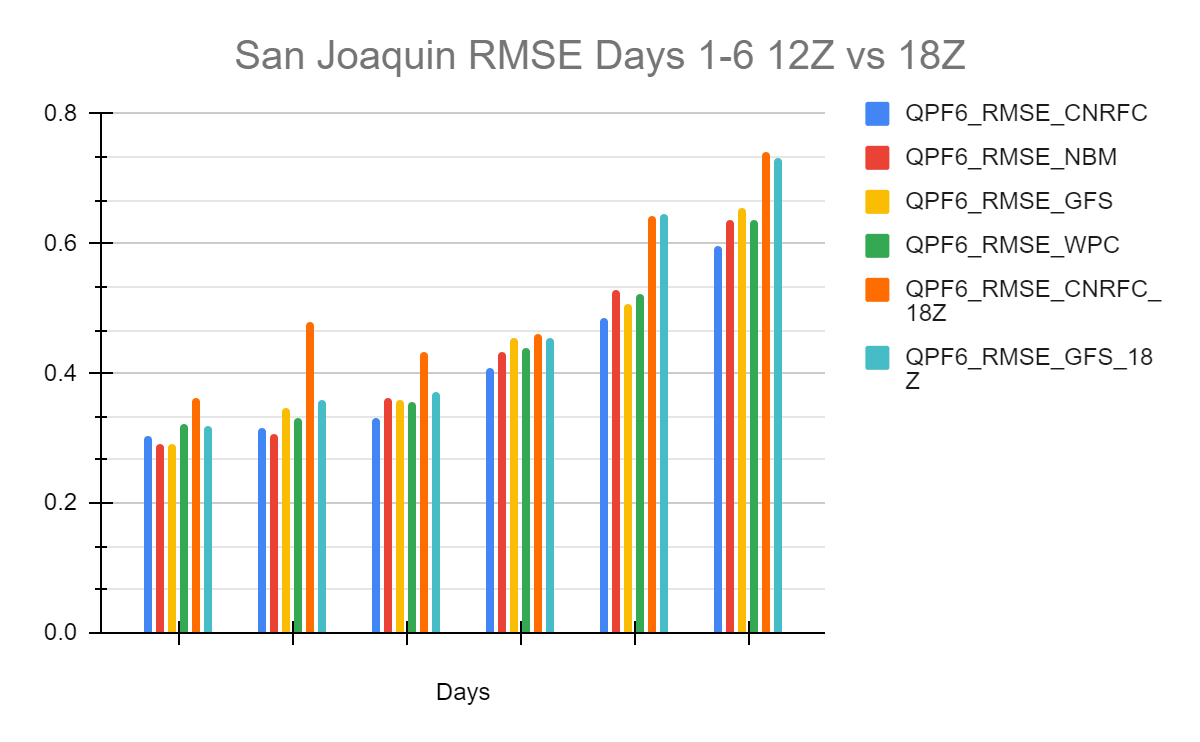 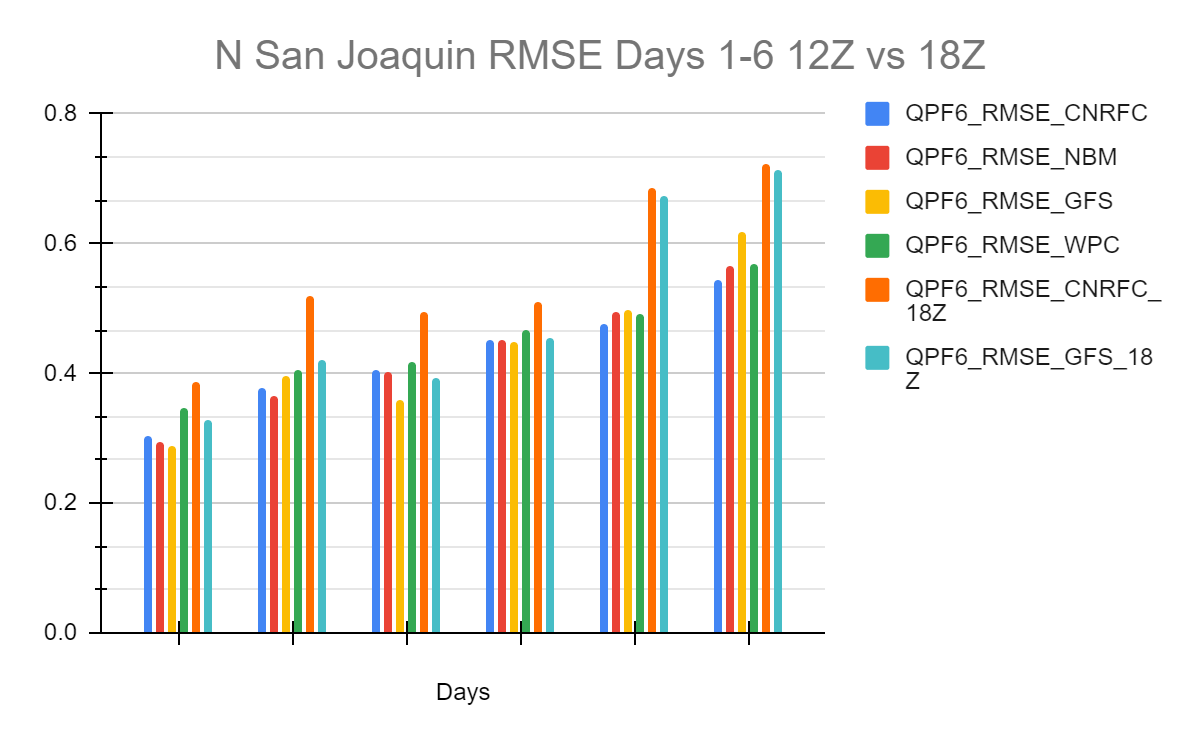 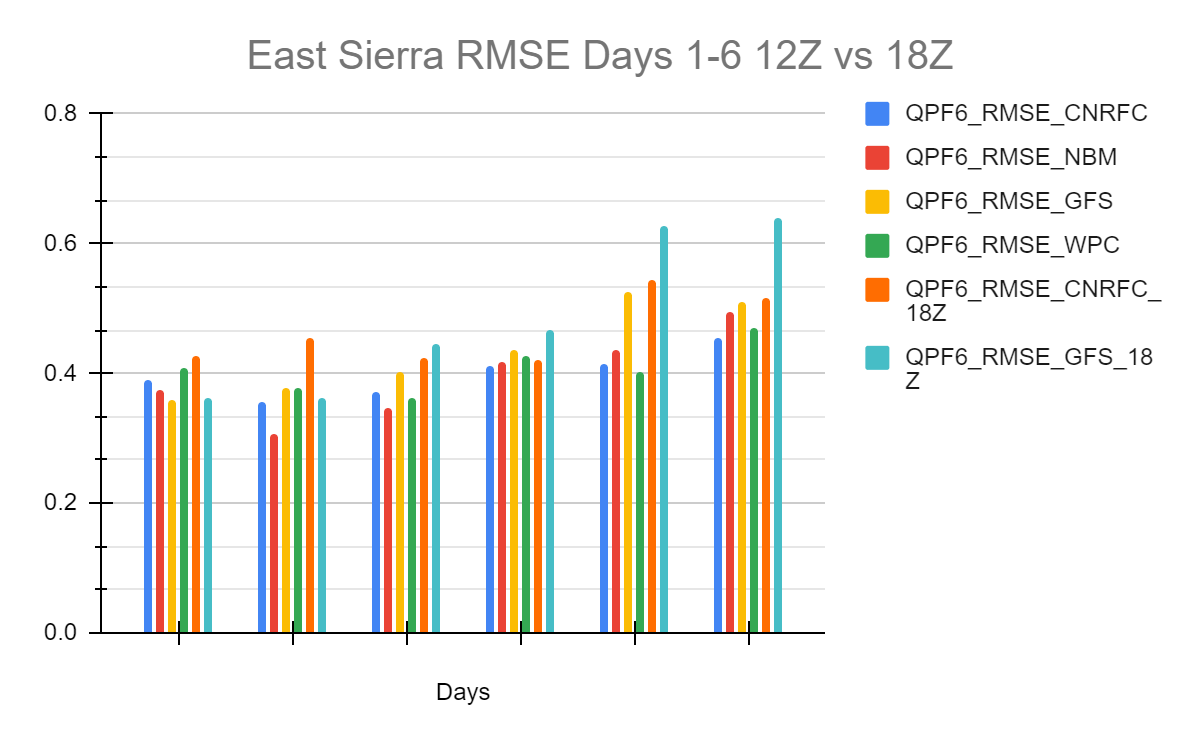 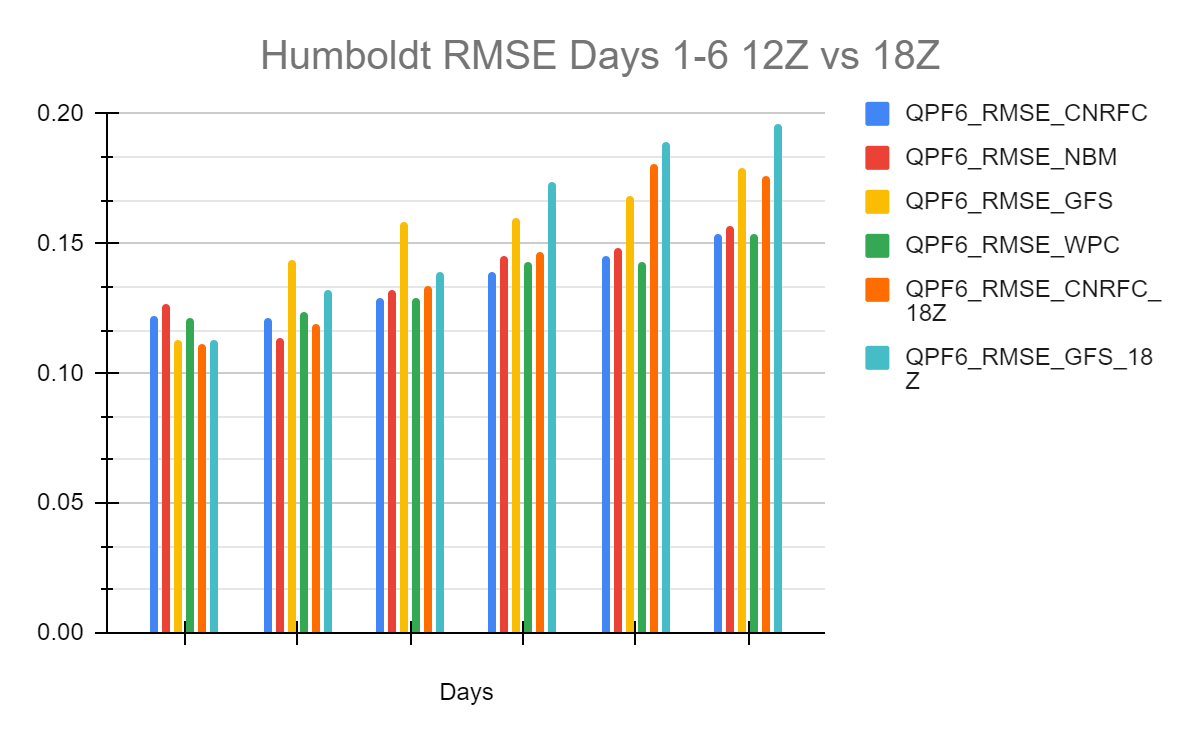 The images below display the individual river forecast group Percent Bias (PBIAS) for Days 1-6 for CNRFC morning forecasts (12Z), 12Z GFS, NBM, WPC, CNRFC afternoon forecasts (18Z), and 18Z GFS. Click on the individual images below to enlarge and open in a new tab. 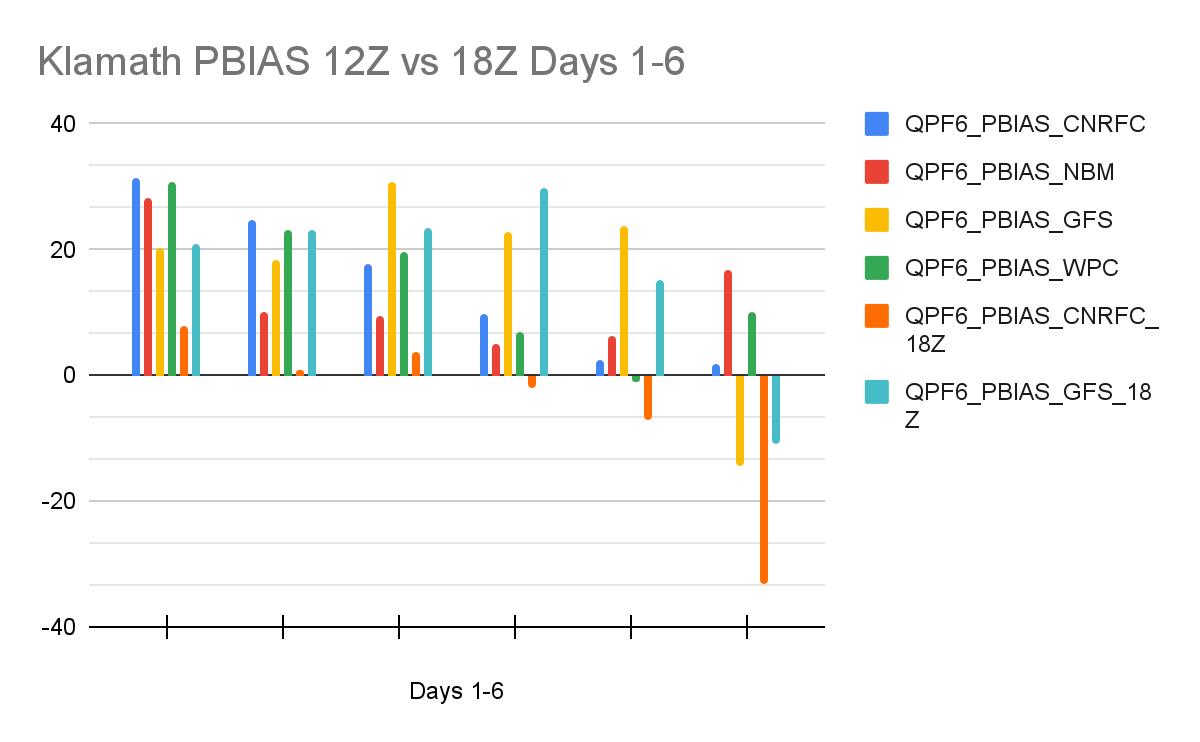 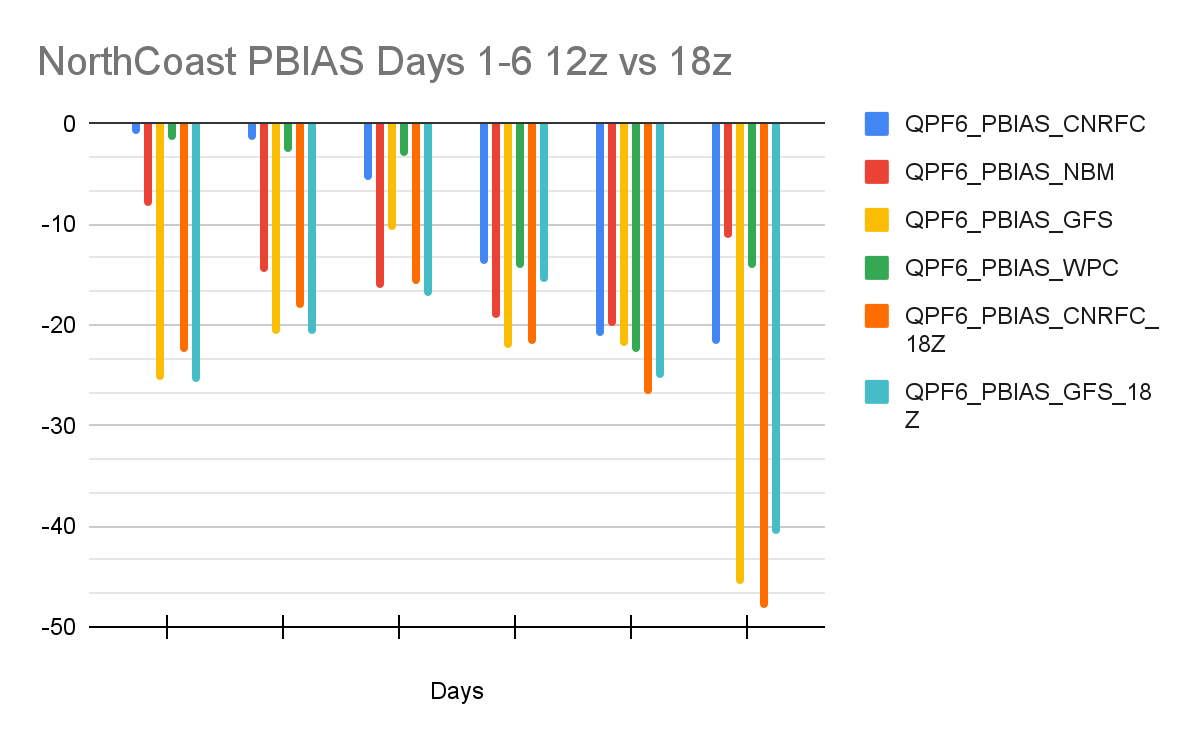 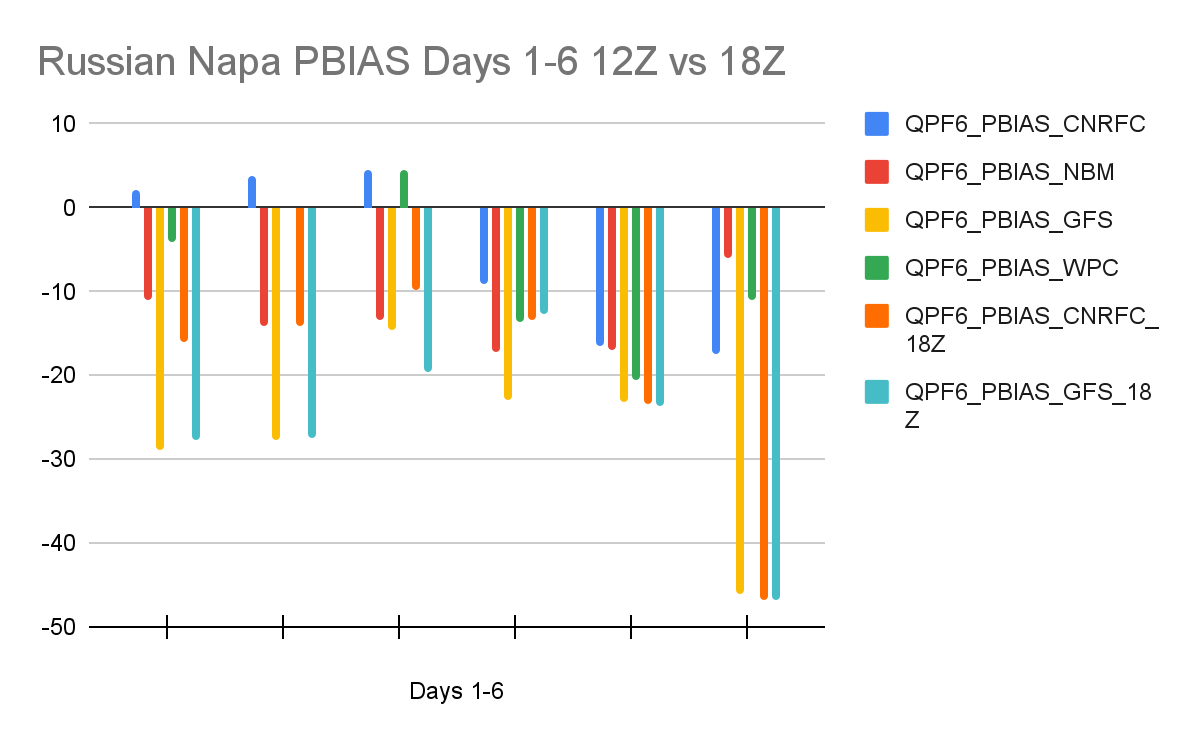 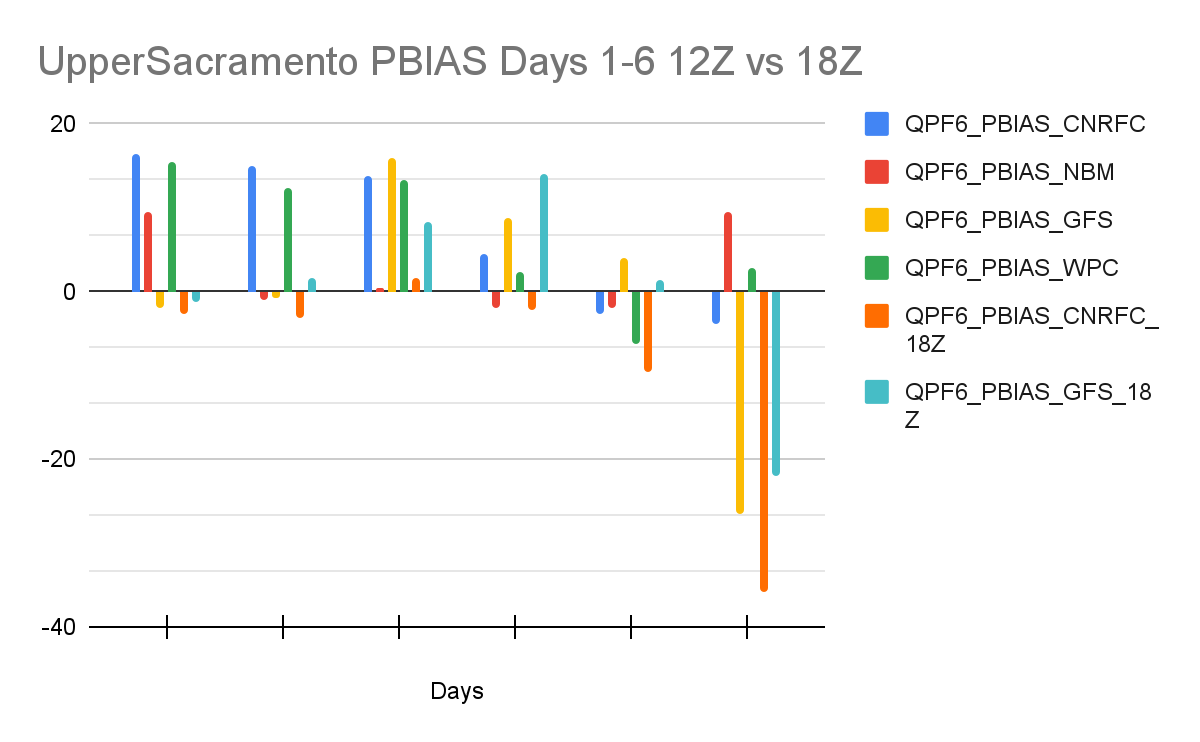 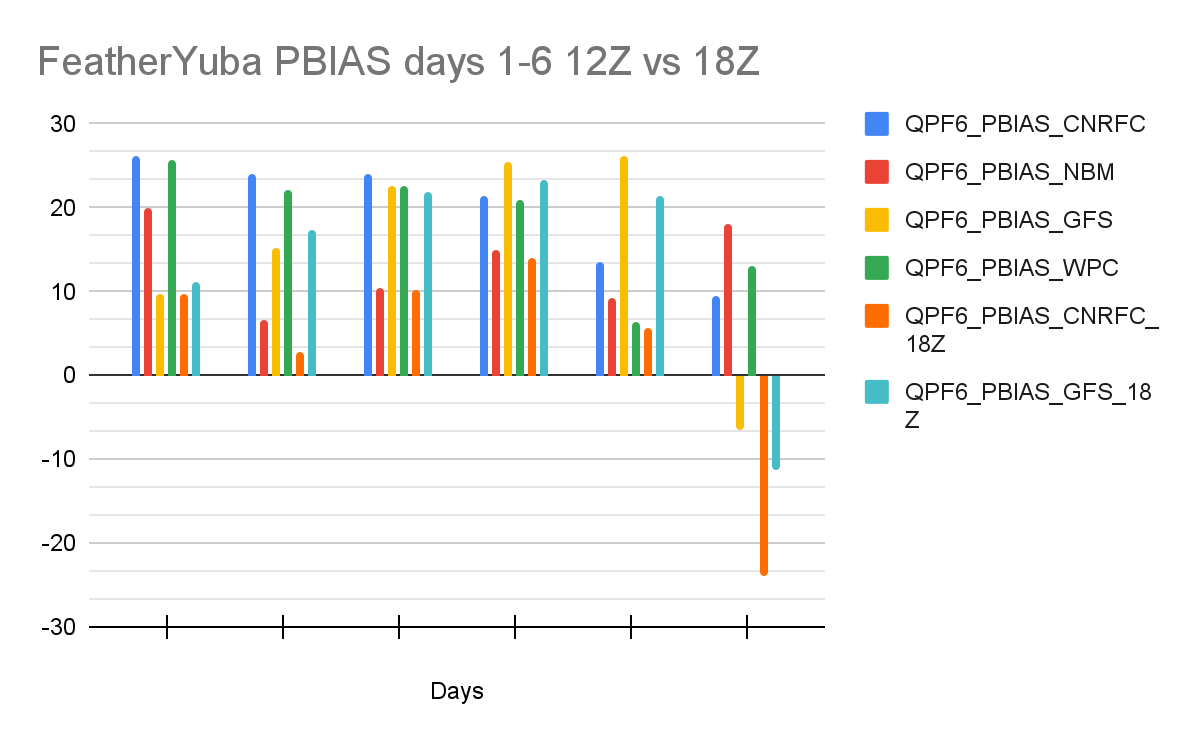 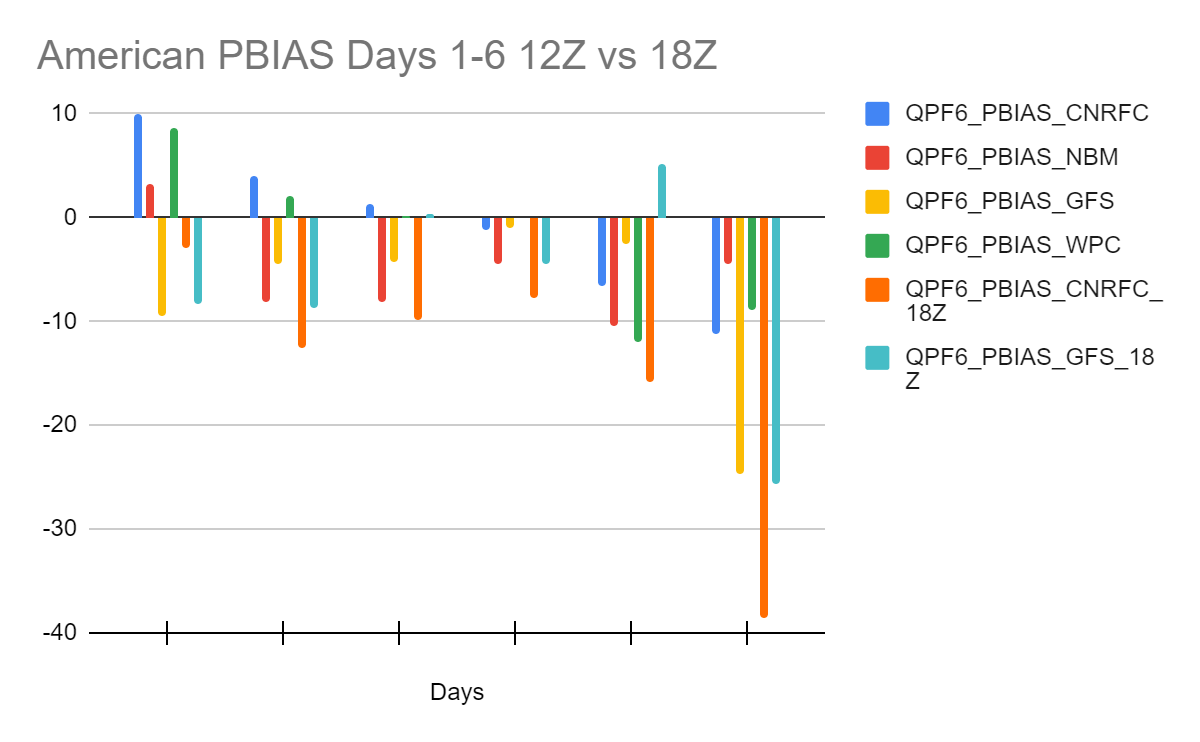 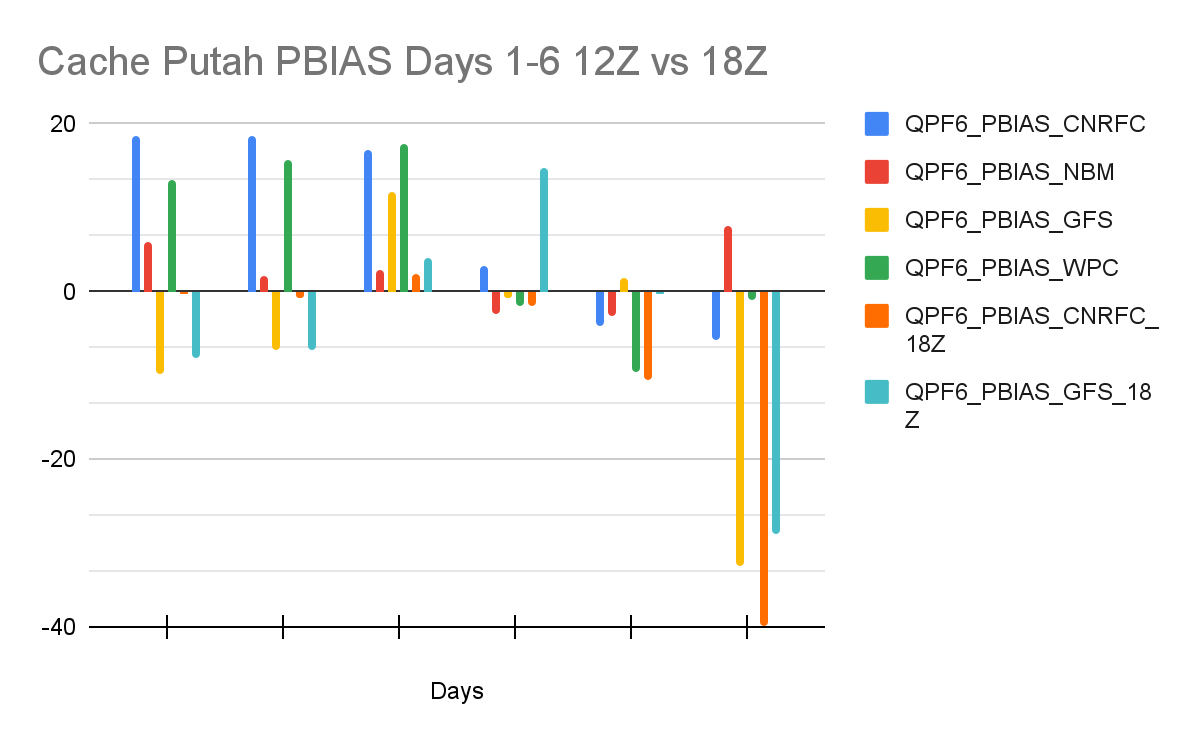 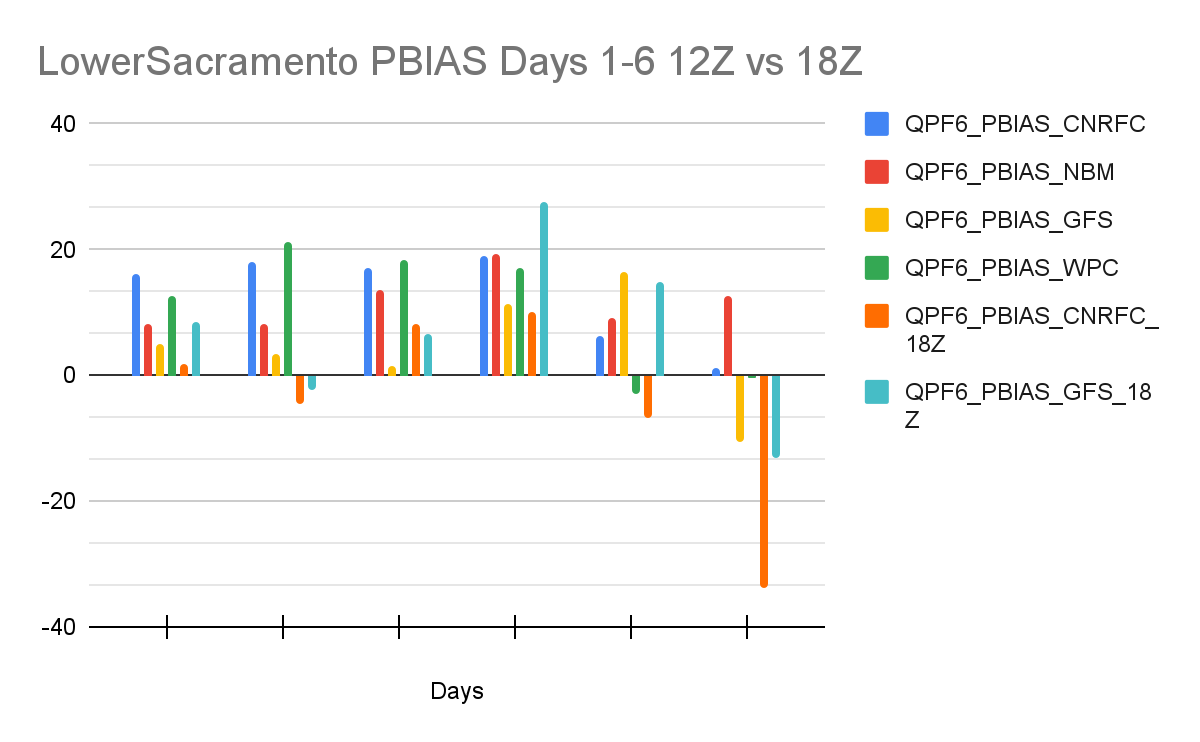 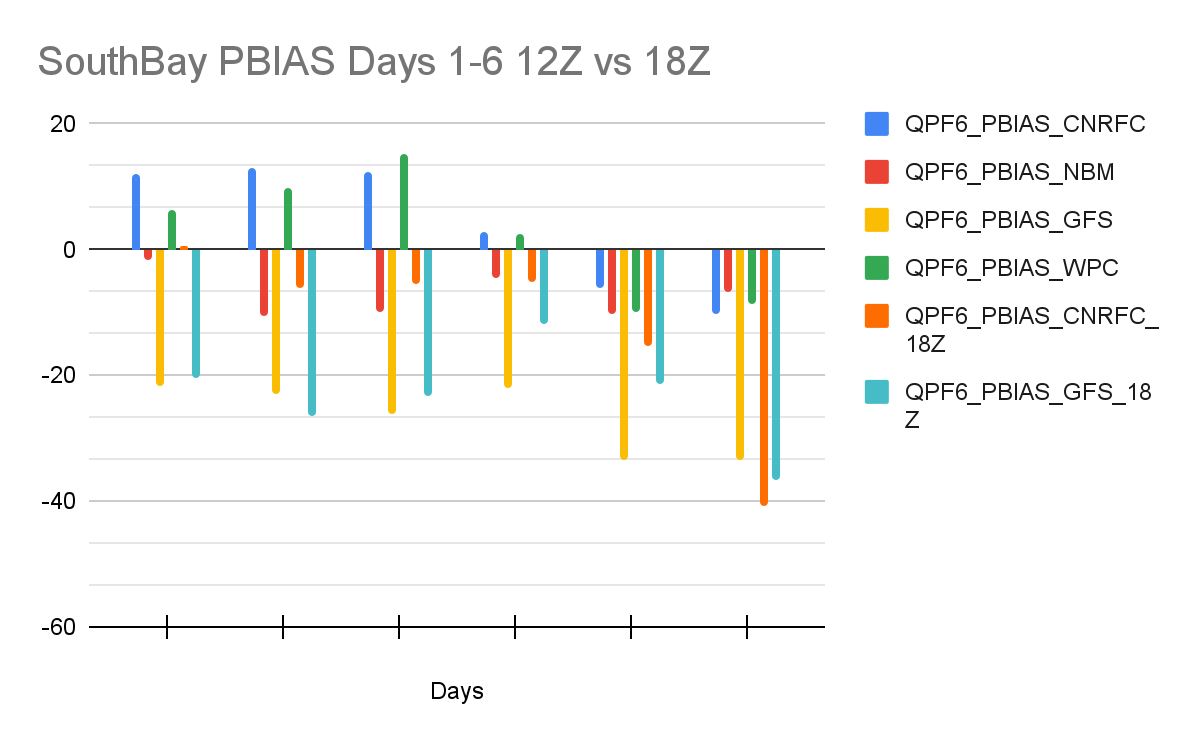 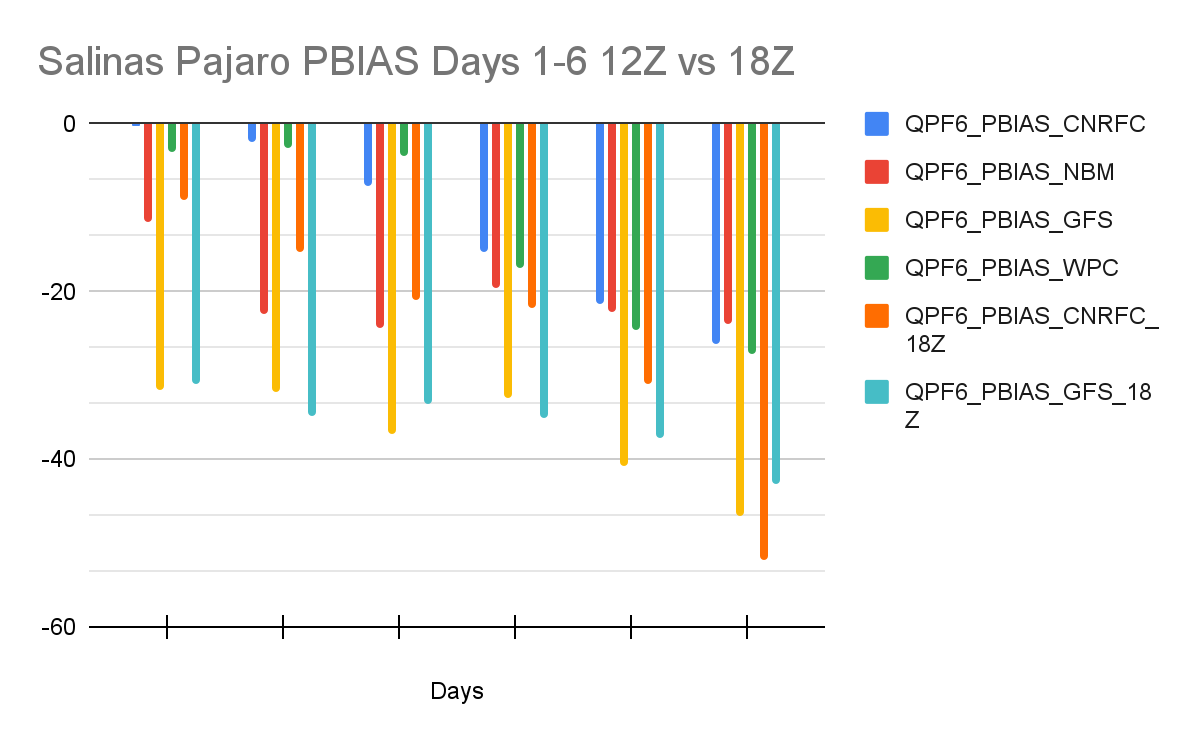 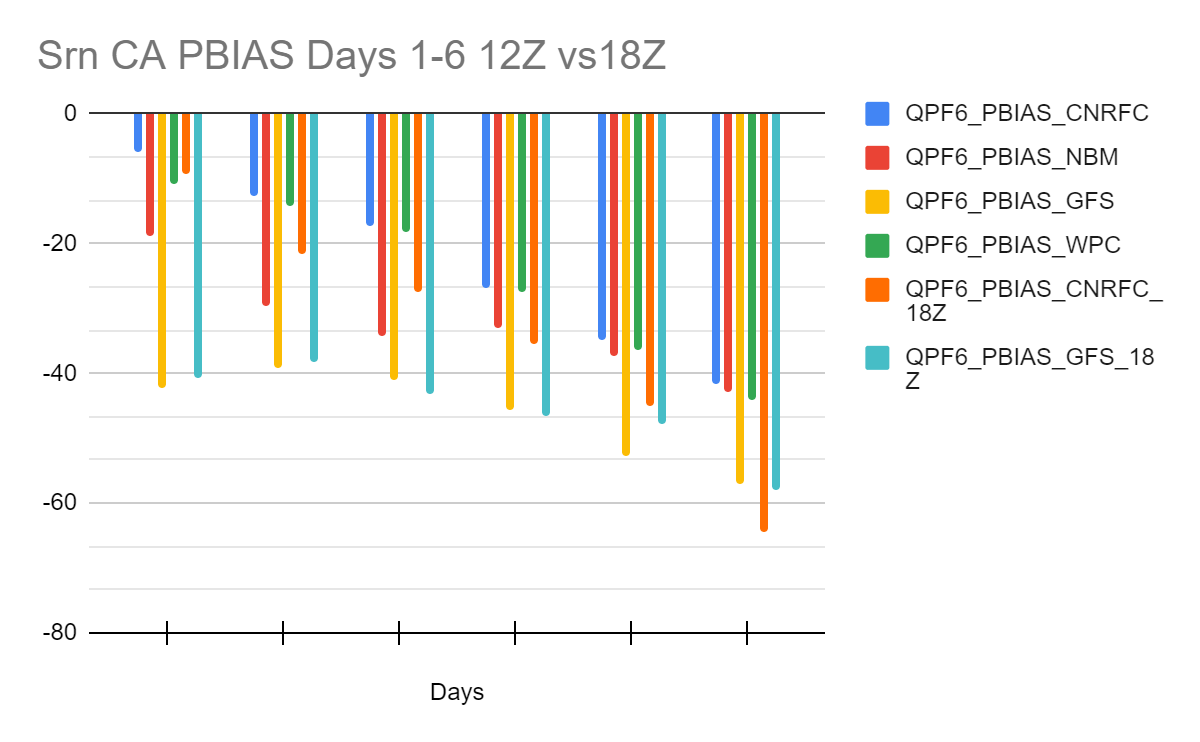 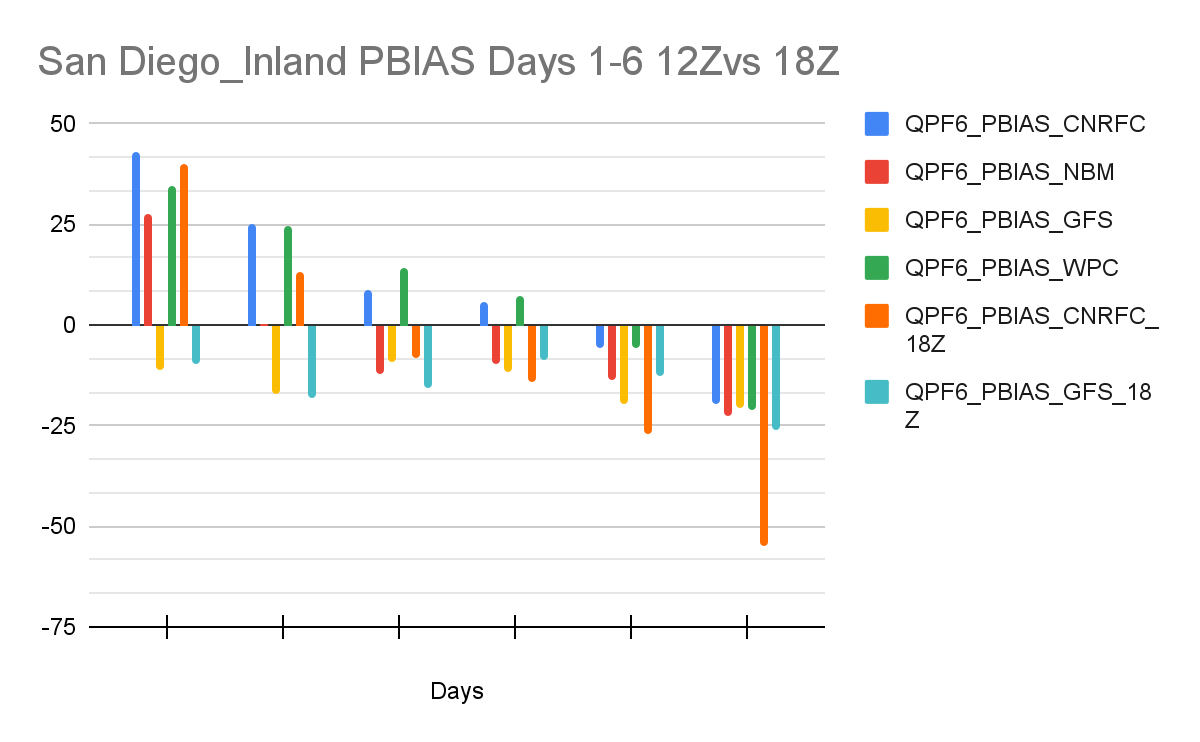 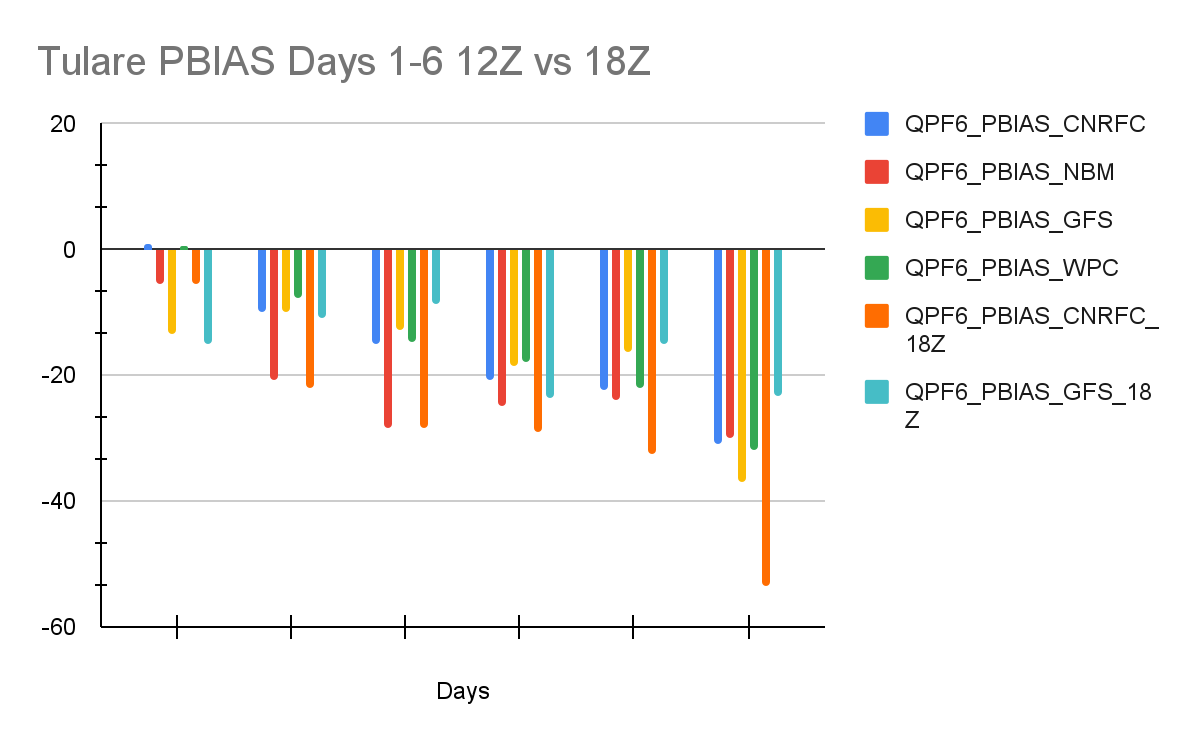 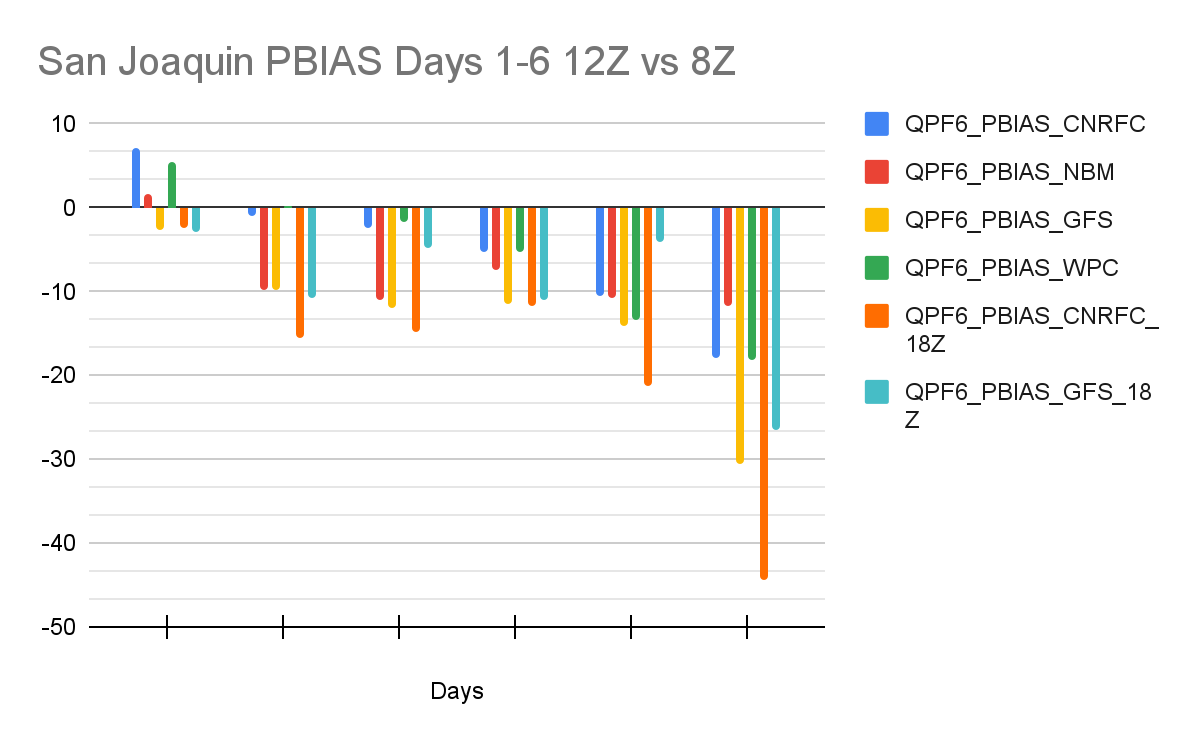 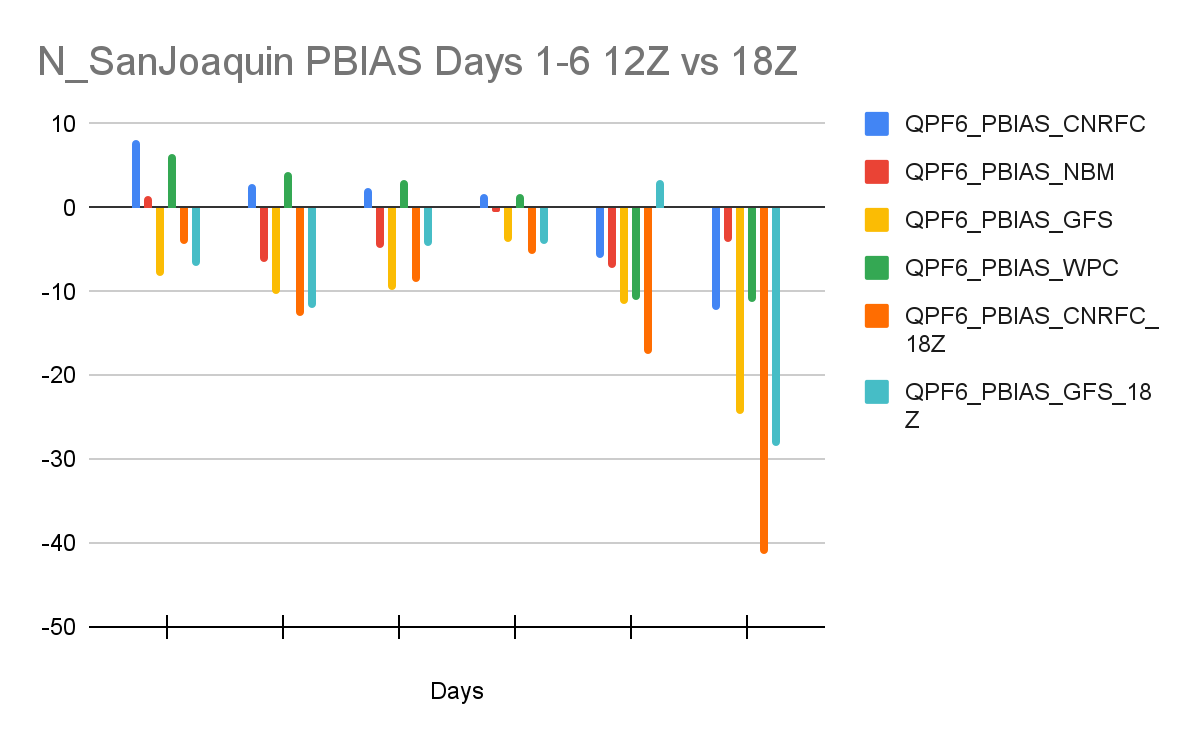 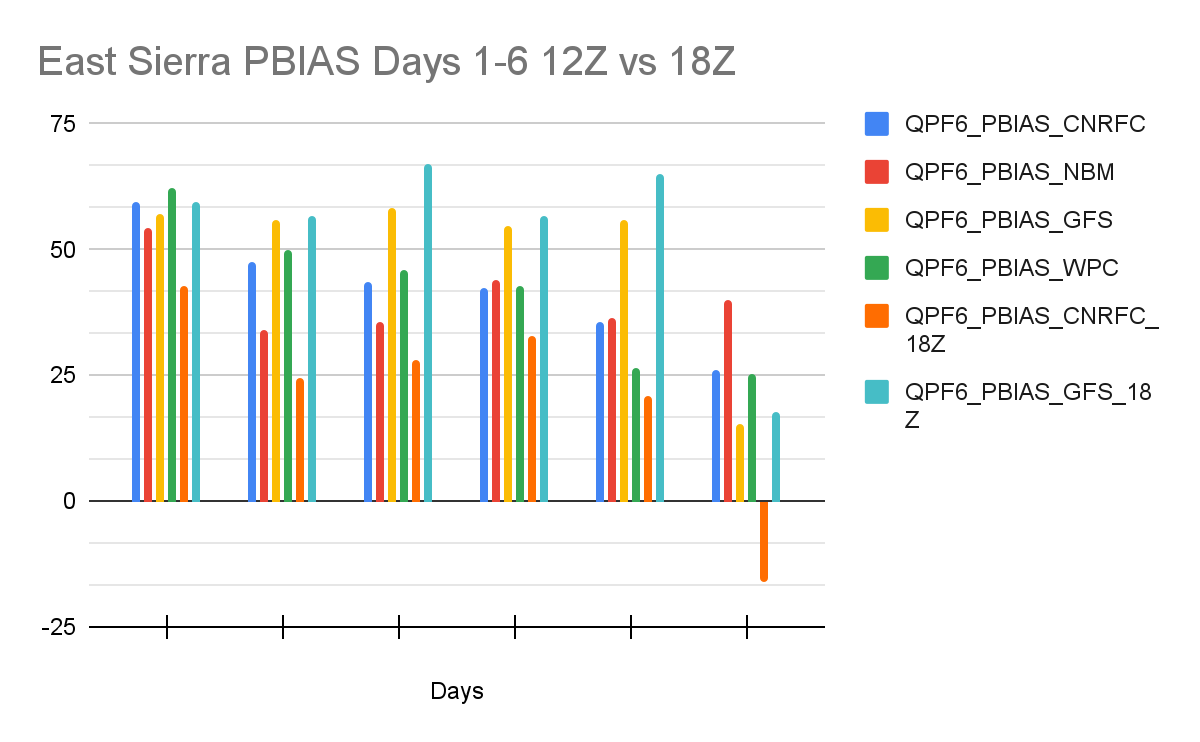 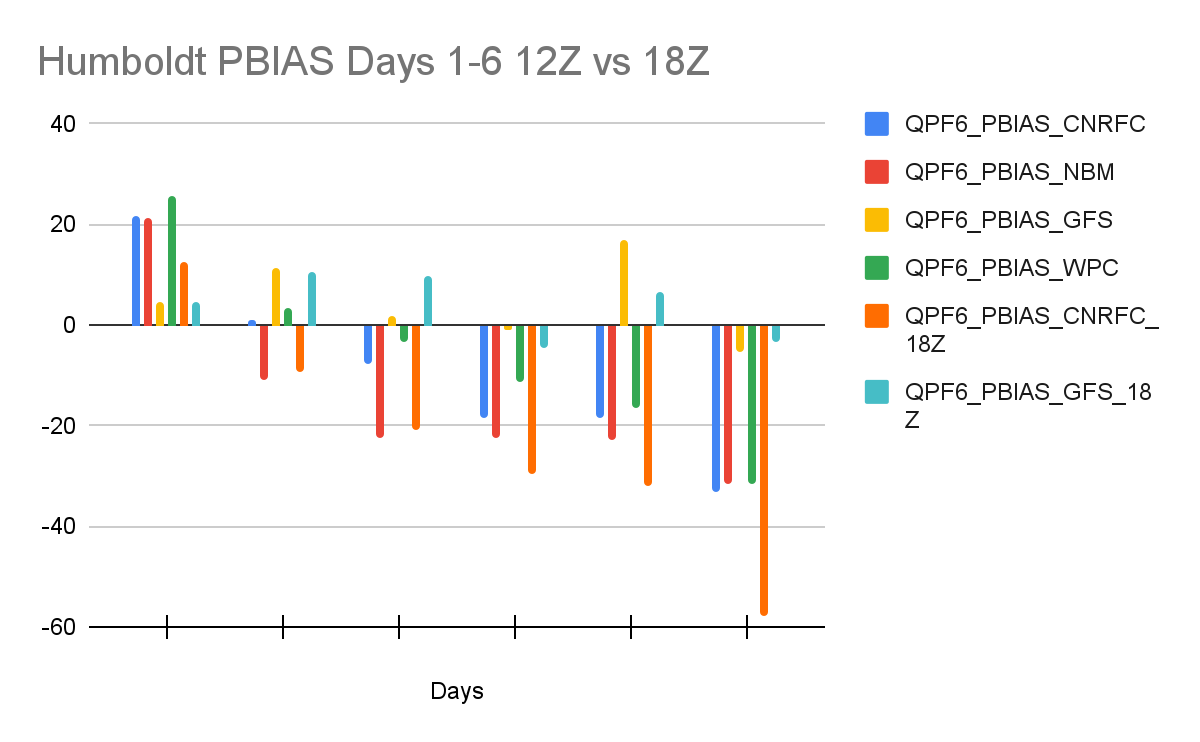 The images below display the individual river forecast group Heidke Skill Score (HSS) for Days 1-6 for CNRFC morning forecasts (12Z), 12Z GFS, NBM, WPC, CNRFC afternoon forecasts (18Z), and 18Z GFS. Click on the individual images below to enlarge and open in a new tab. 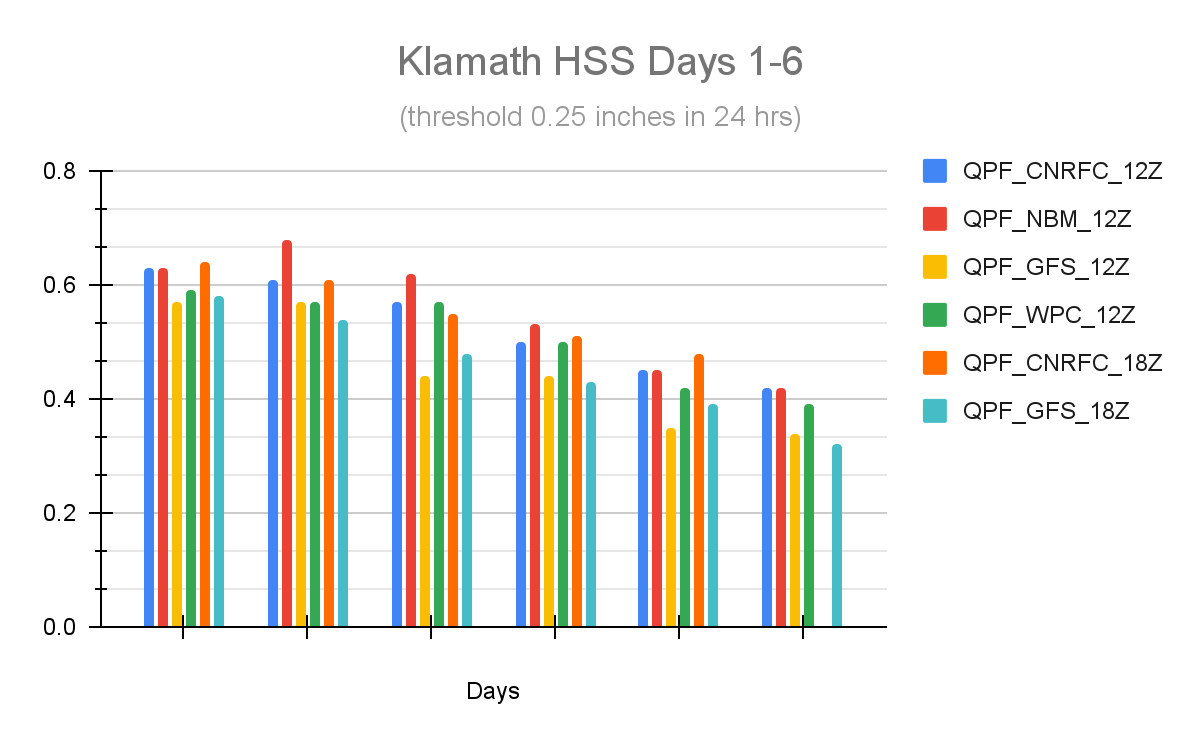 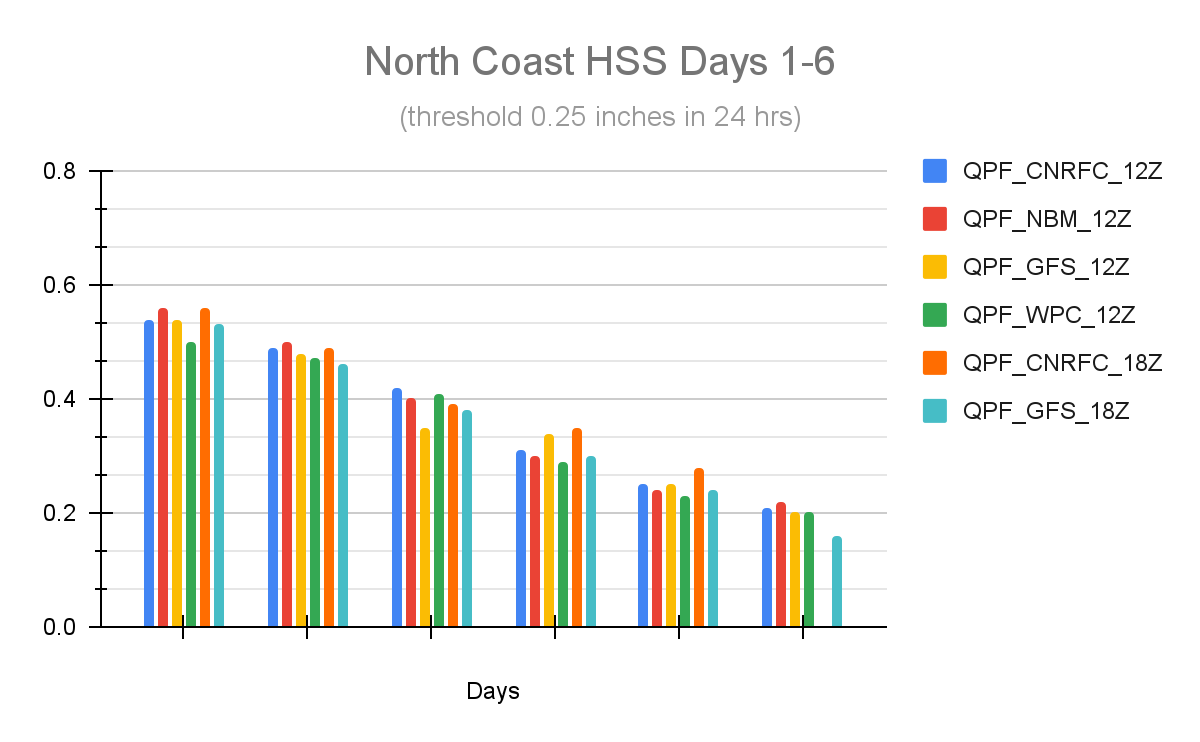 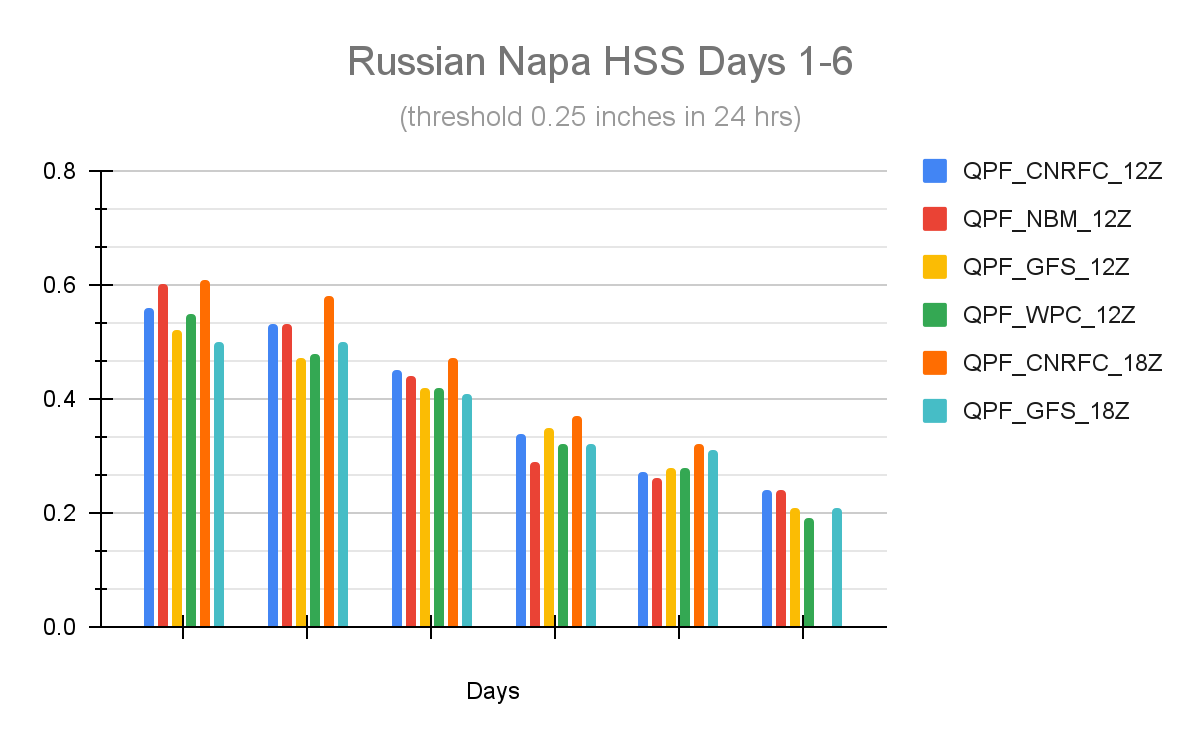 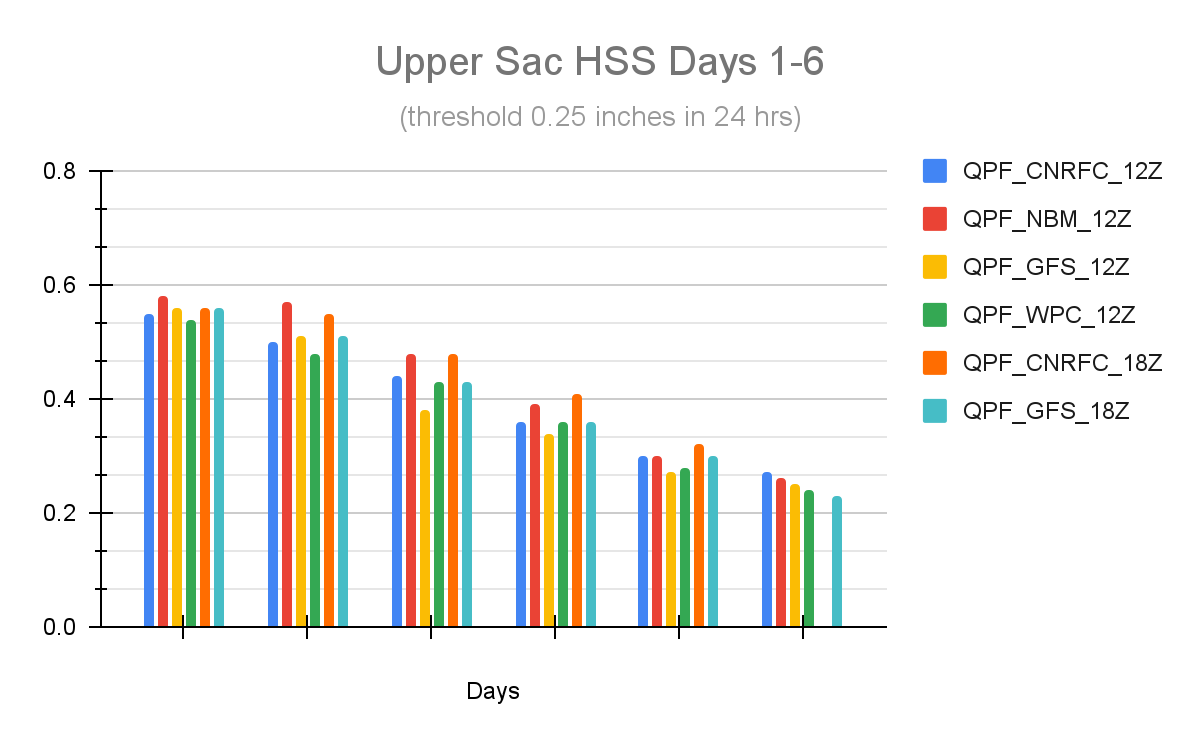 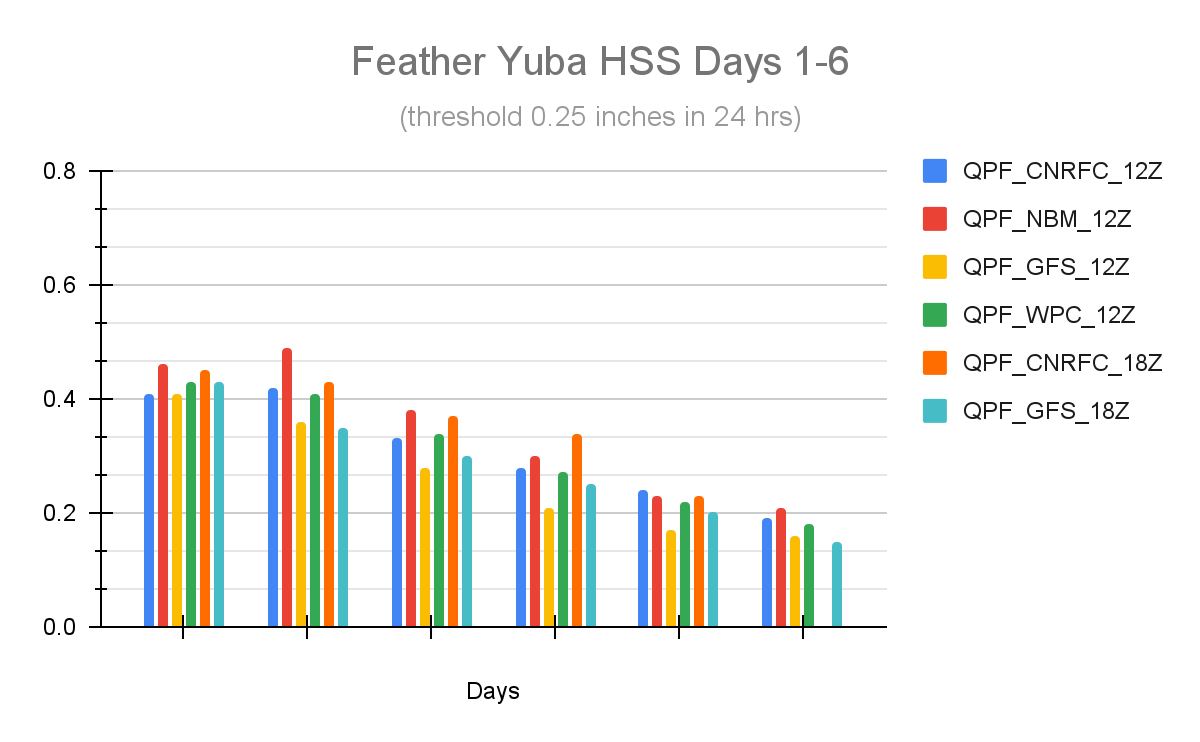 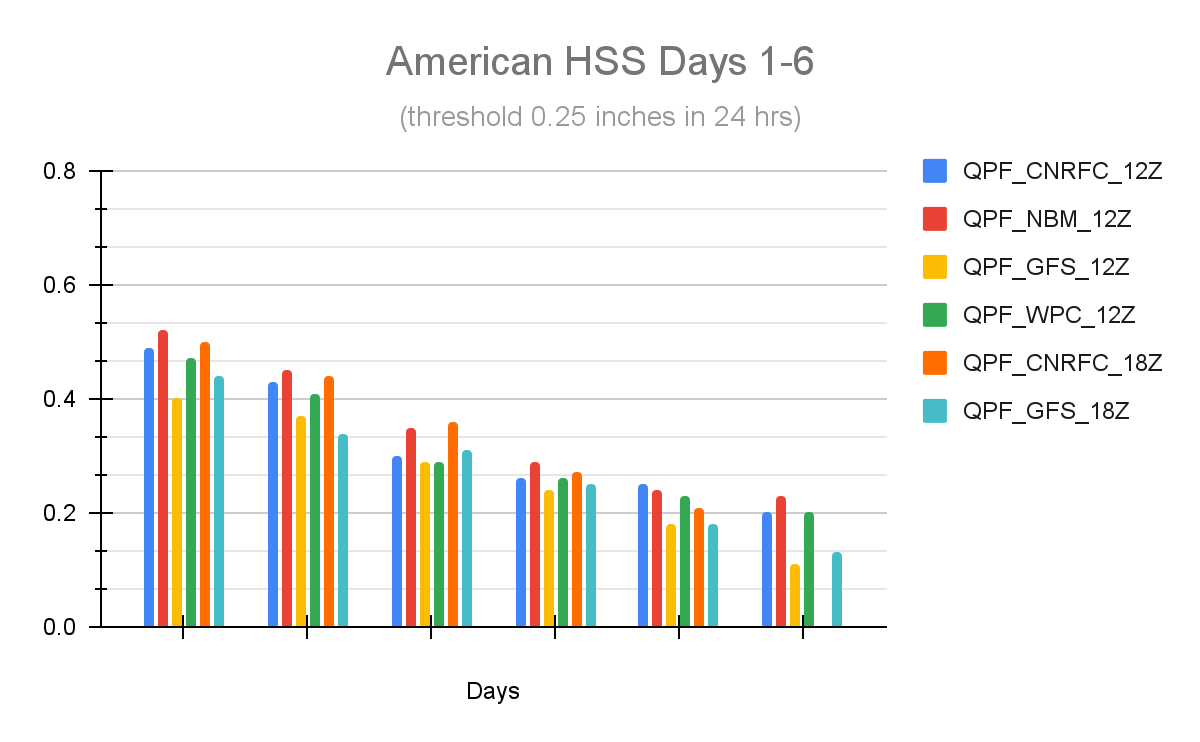 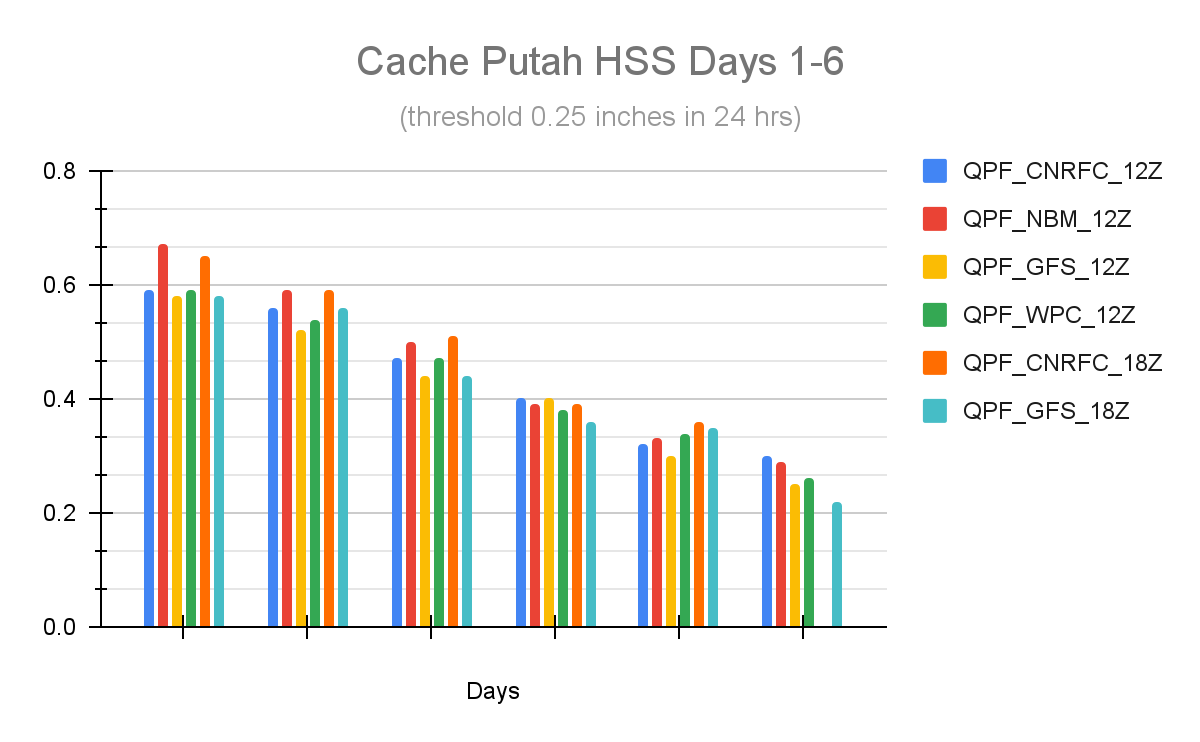 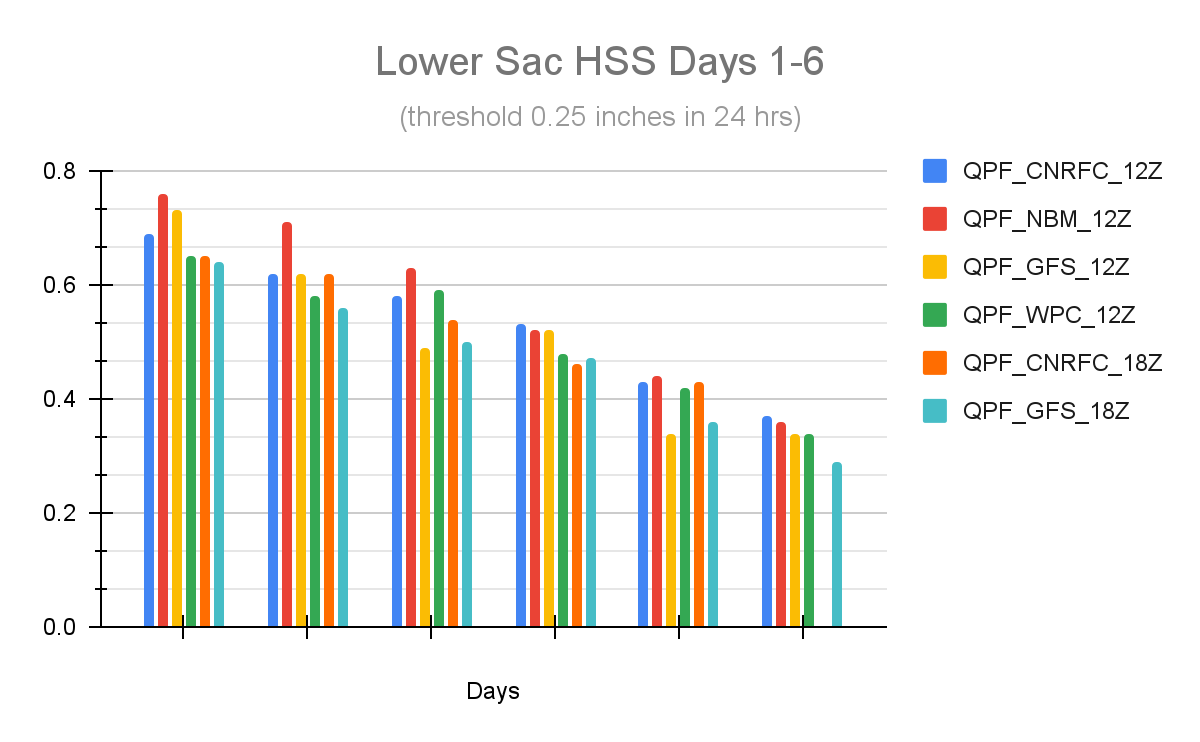 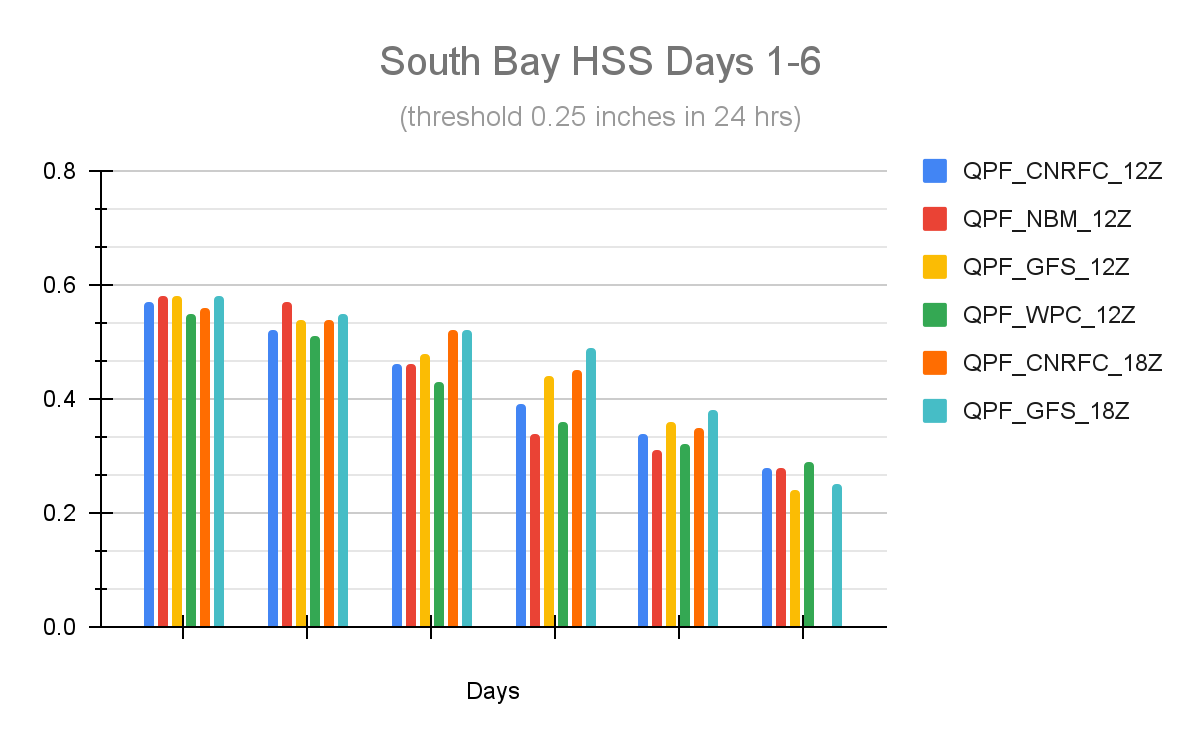 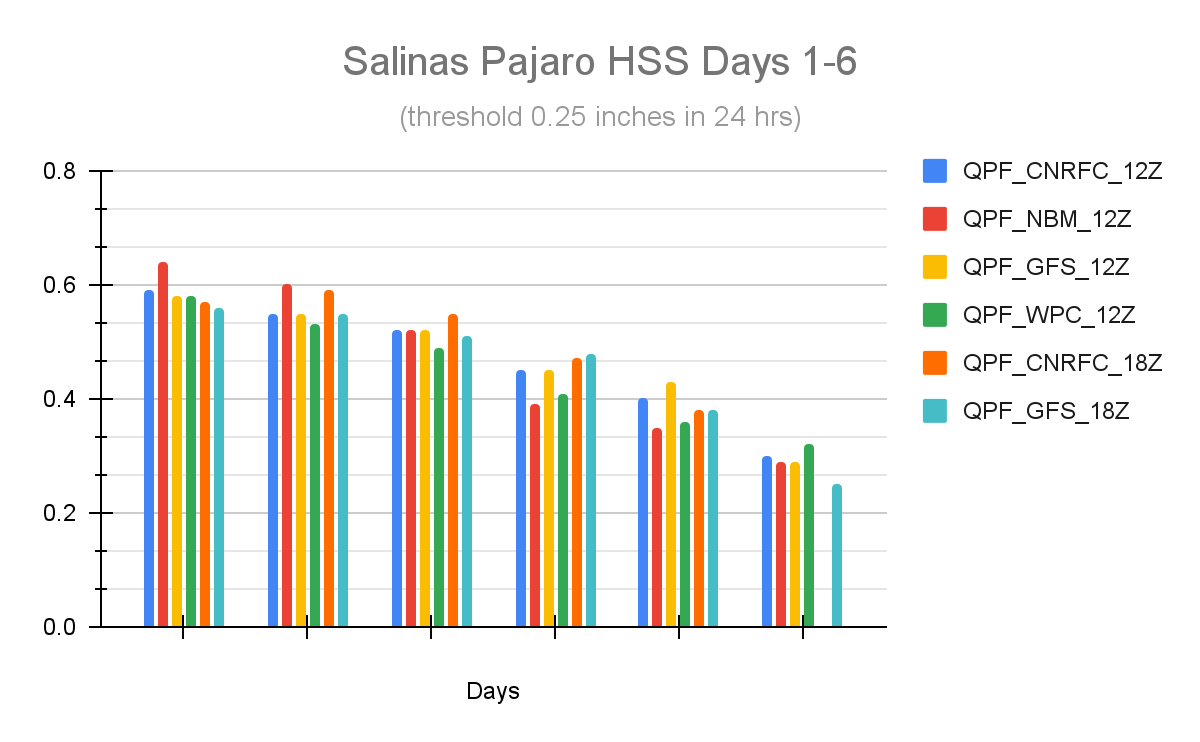 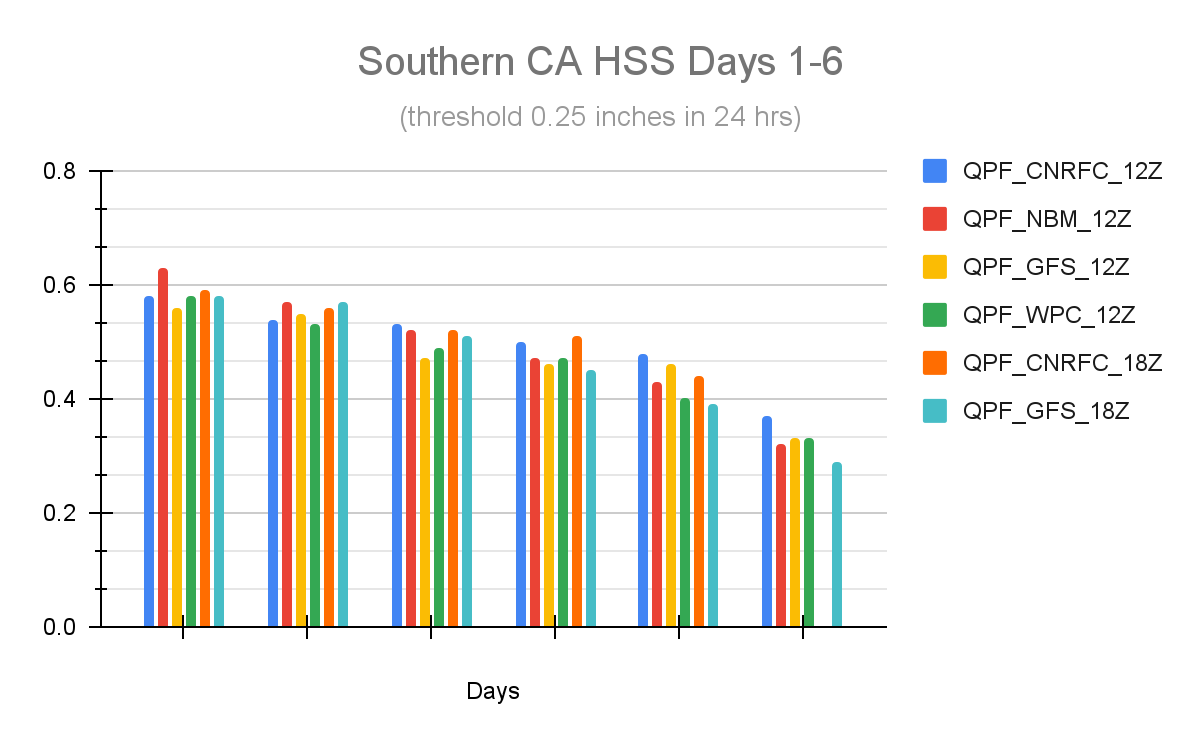 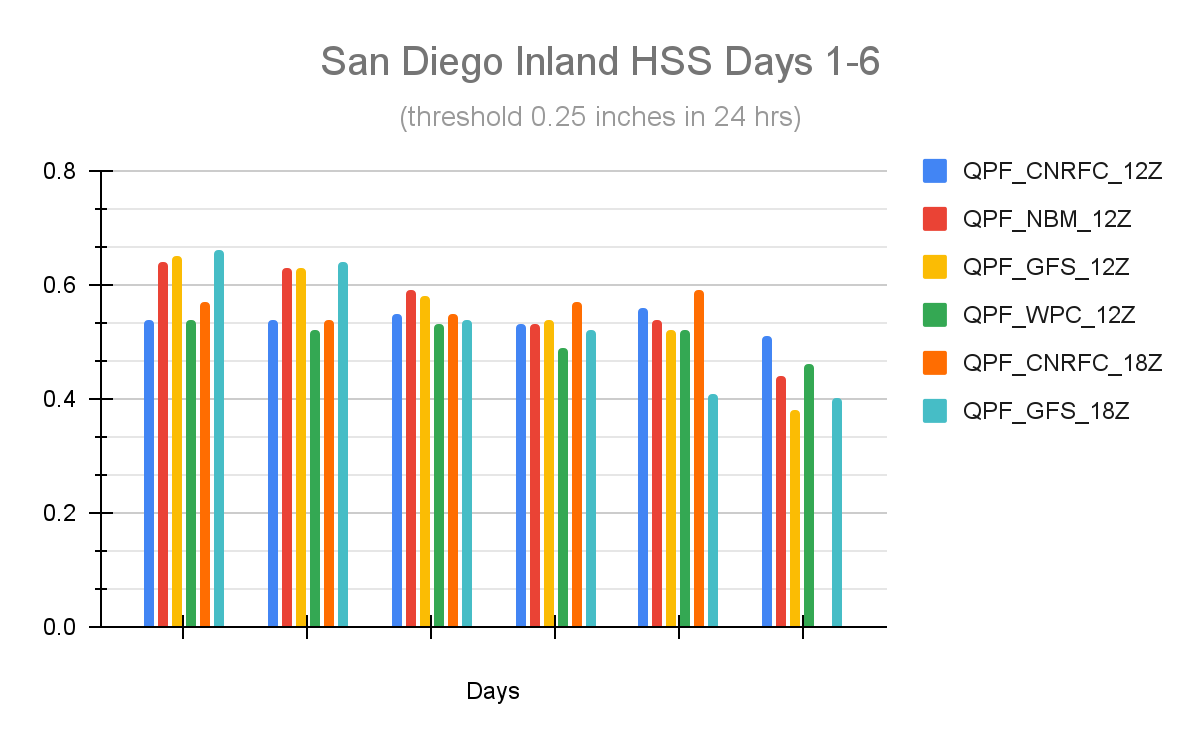 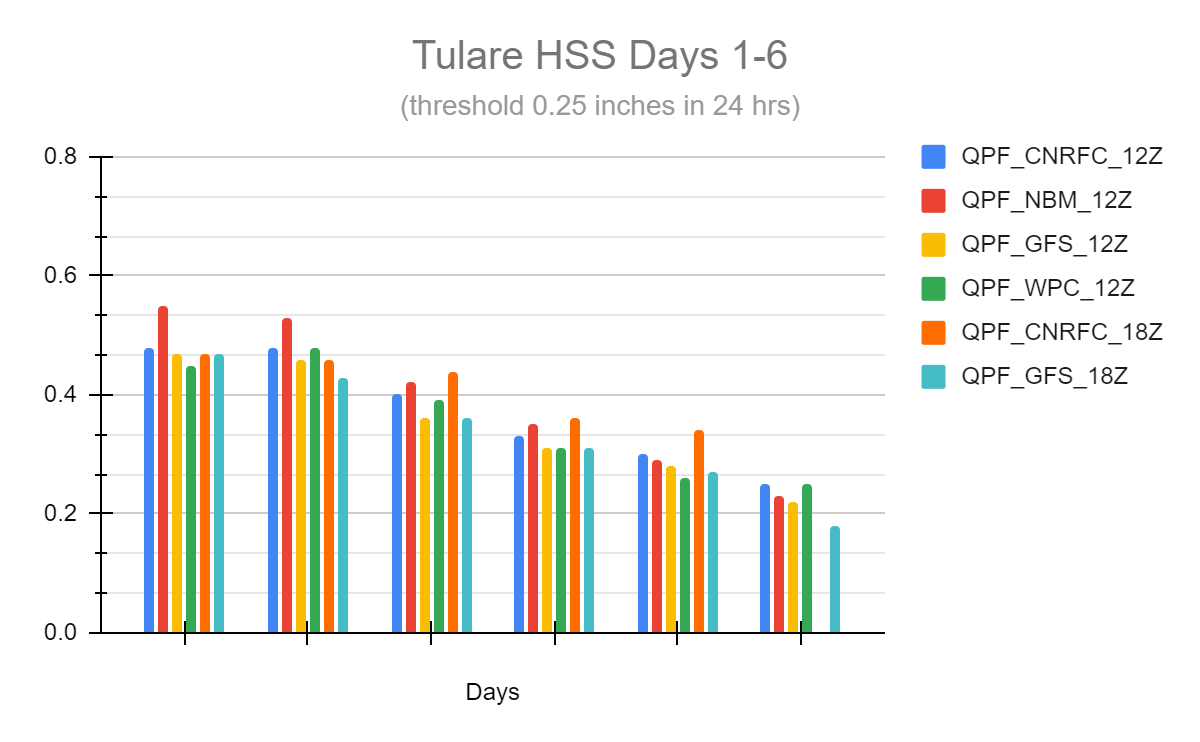  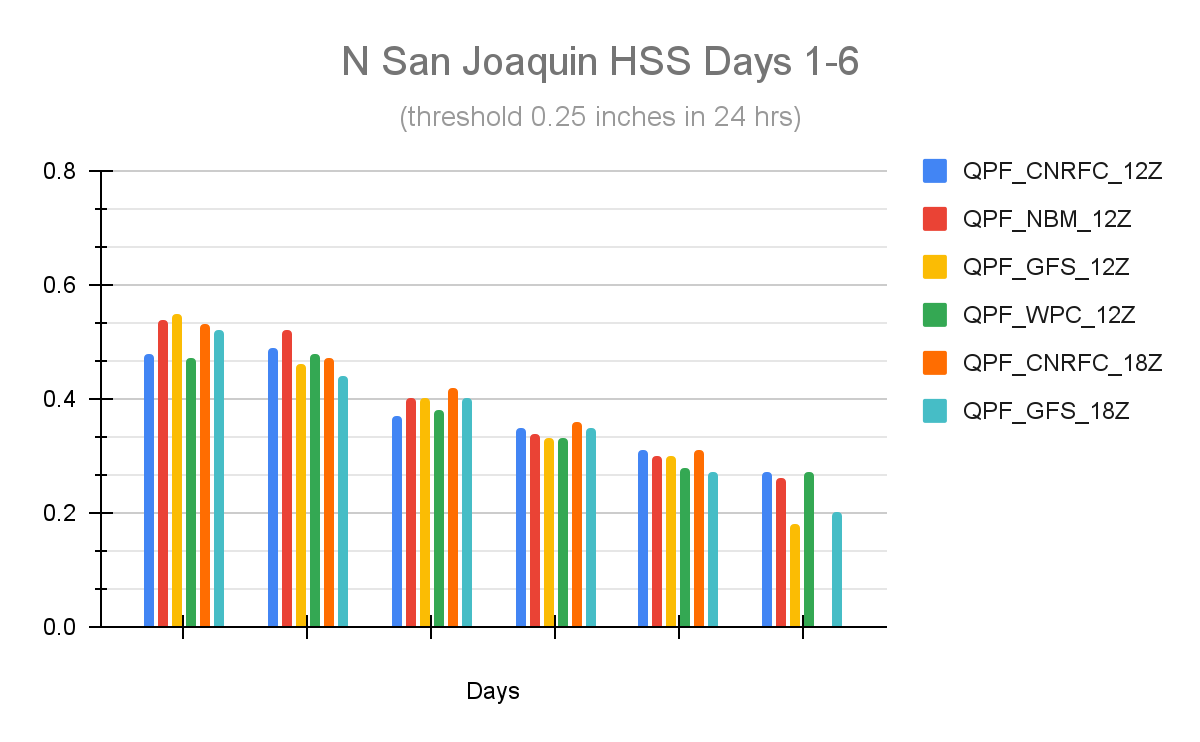 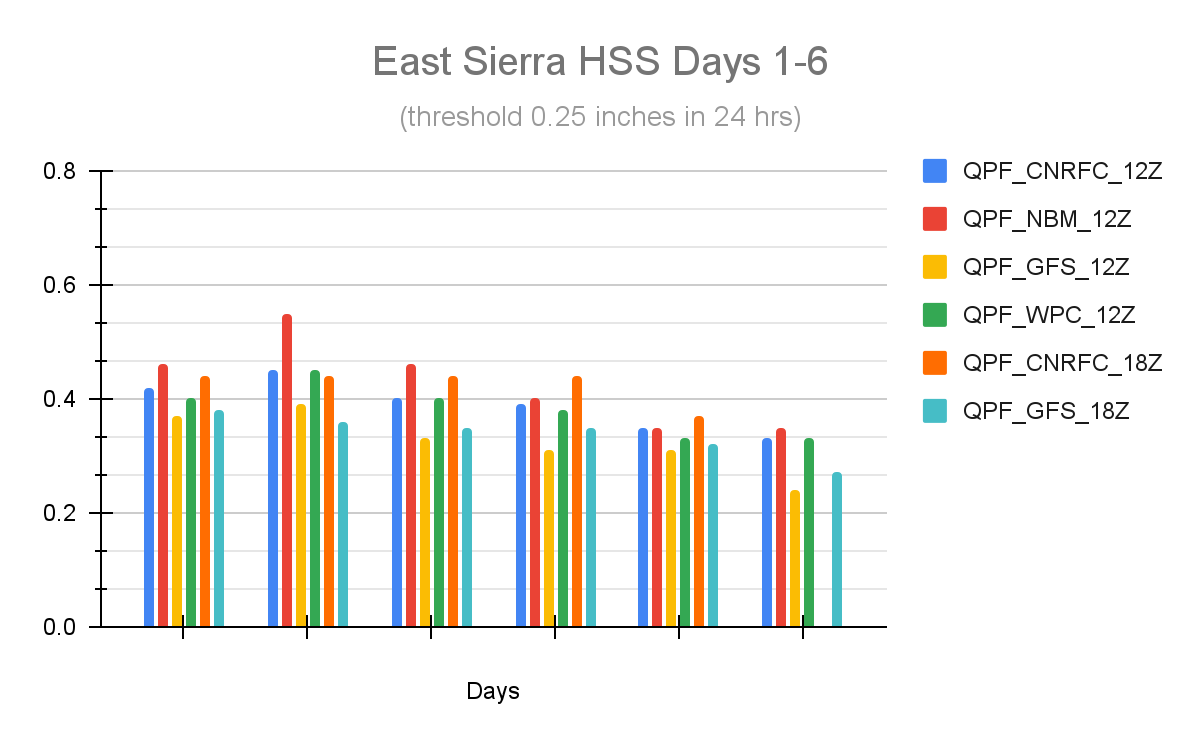 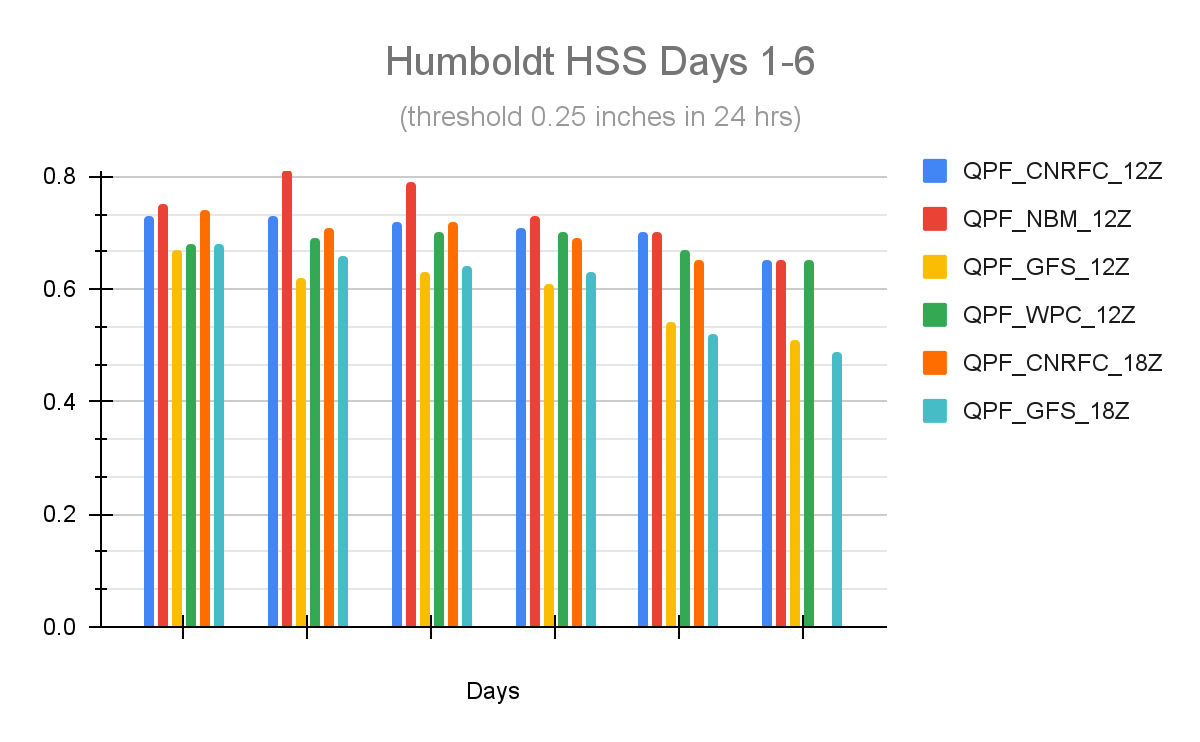 1 | ||||||||||||||||||||||||||||||||||||||||||||||||||||||||||||||||||||||||||||||||||||||||||||||||||||||||||||||||||||||||||||||||||||||||||||||||||||||||||||||||||||||||||||||||||||||||||||||||||||||||||||||||||||||||||||||||||||||||||||||||||||||||||||||||||||||||||||||||||||||||||||||||||||||||||||||||||||||||||||||||||||||||||||||||||||||||||||||||||||||||||||||||||||||||||||||||||||||||||||||||||||||||||||||||||||||||||||||||||||||||||||||||||||||||||||||||||||||||||||||||||||||||||||||||||||||||||||||||||||||||||||||||||||||||||||||||||||||||||||||||||||||||||||||||||||||||||||||||||||||||||||||||||||||||||||||||||||||||||||||||||||||||||||||||||||||||||||||||||||||||||||||||||||||||||||||||||||||||||||||||||||||||||||||||||||||||||||||||||||||||||||||||||||||||||||||||||||||||||||||||||||||||||||||||||||||||||||||||||||||||||||||||||||||||||||||||||||||||||||||||||||||||||||