|
Heavy Precipitation Events Navigation: General Summary | Precipitation | Weather Synopsis | Hydrologic Impacts | Verification Note: This storm summary will focus on the storms in late February through March 2023, while the active pattern from late December 2022 into January 2023 is covered in Section 1, as a separate storm summary webpage. Information in this document is considered current as of January 3, 2024. Also, the CNRFC published an ArcGIS StoryMap reviewing the historic 2023 Water Year. To access this ArcGIS StoryMap, please visit this link here. The 2023 Water Year, in particular the period from late December through the first half of January, and then again from late February through March, brought historical precipitation and snowpack conditions to parts of California and Nevada. Many of the storm systems were characterized by cool temperatures and low snow levels, brought on by numerous moist and strong low pressure systems, including over a dozen Atmospheric Rivers (also referred to as ARs) and three bomb cyclones (a rapidly developing area of low pressure where the atmospheric pressure drops at least 24 millibars over a 24-hour period) during the period from December 2022 through March 2023. The images below, courtesy of the Center for Western Weather and Water Extremes (CW3E), show where each of these ARs made landfall along the west coast and their strength determined using Integrated Water Vapor Transport (IVT). The image on the left covers the period from December 27, 2022, through January 17, 2023. The image on the right covers the period from February 25, 2023, through March 31, 2023. To expand each image in a new tab, click on each image. 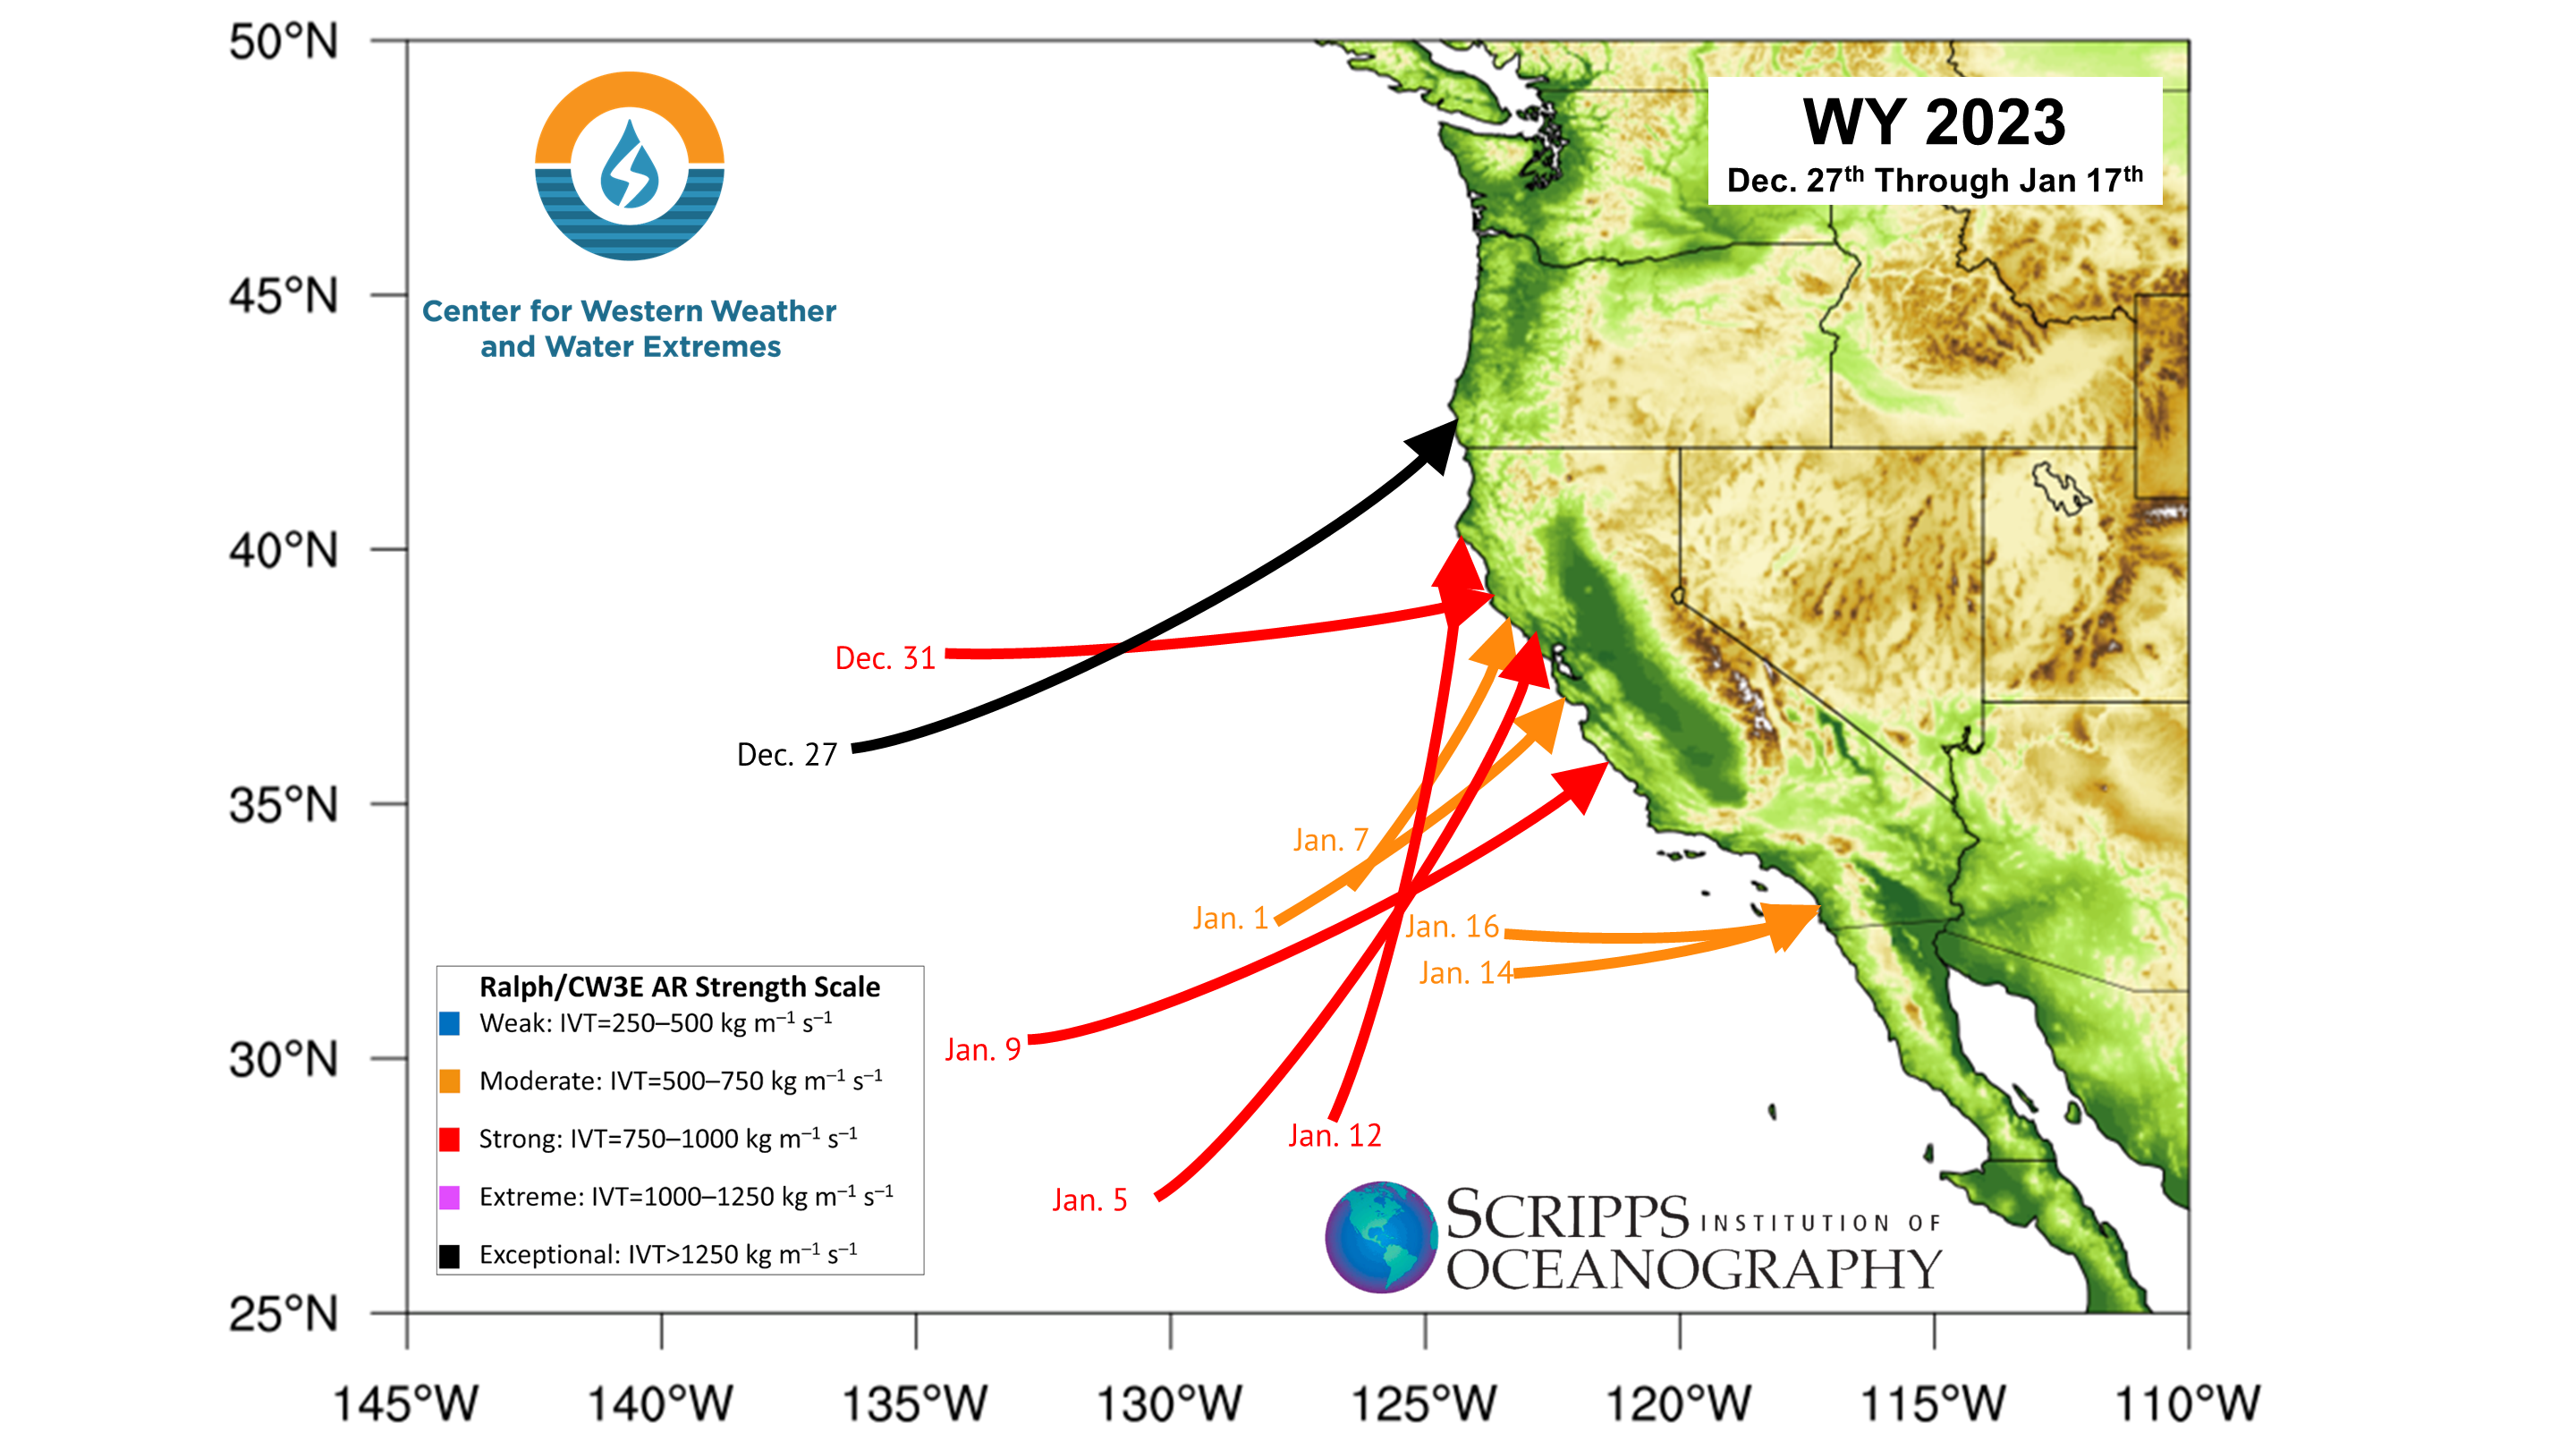 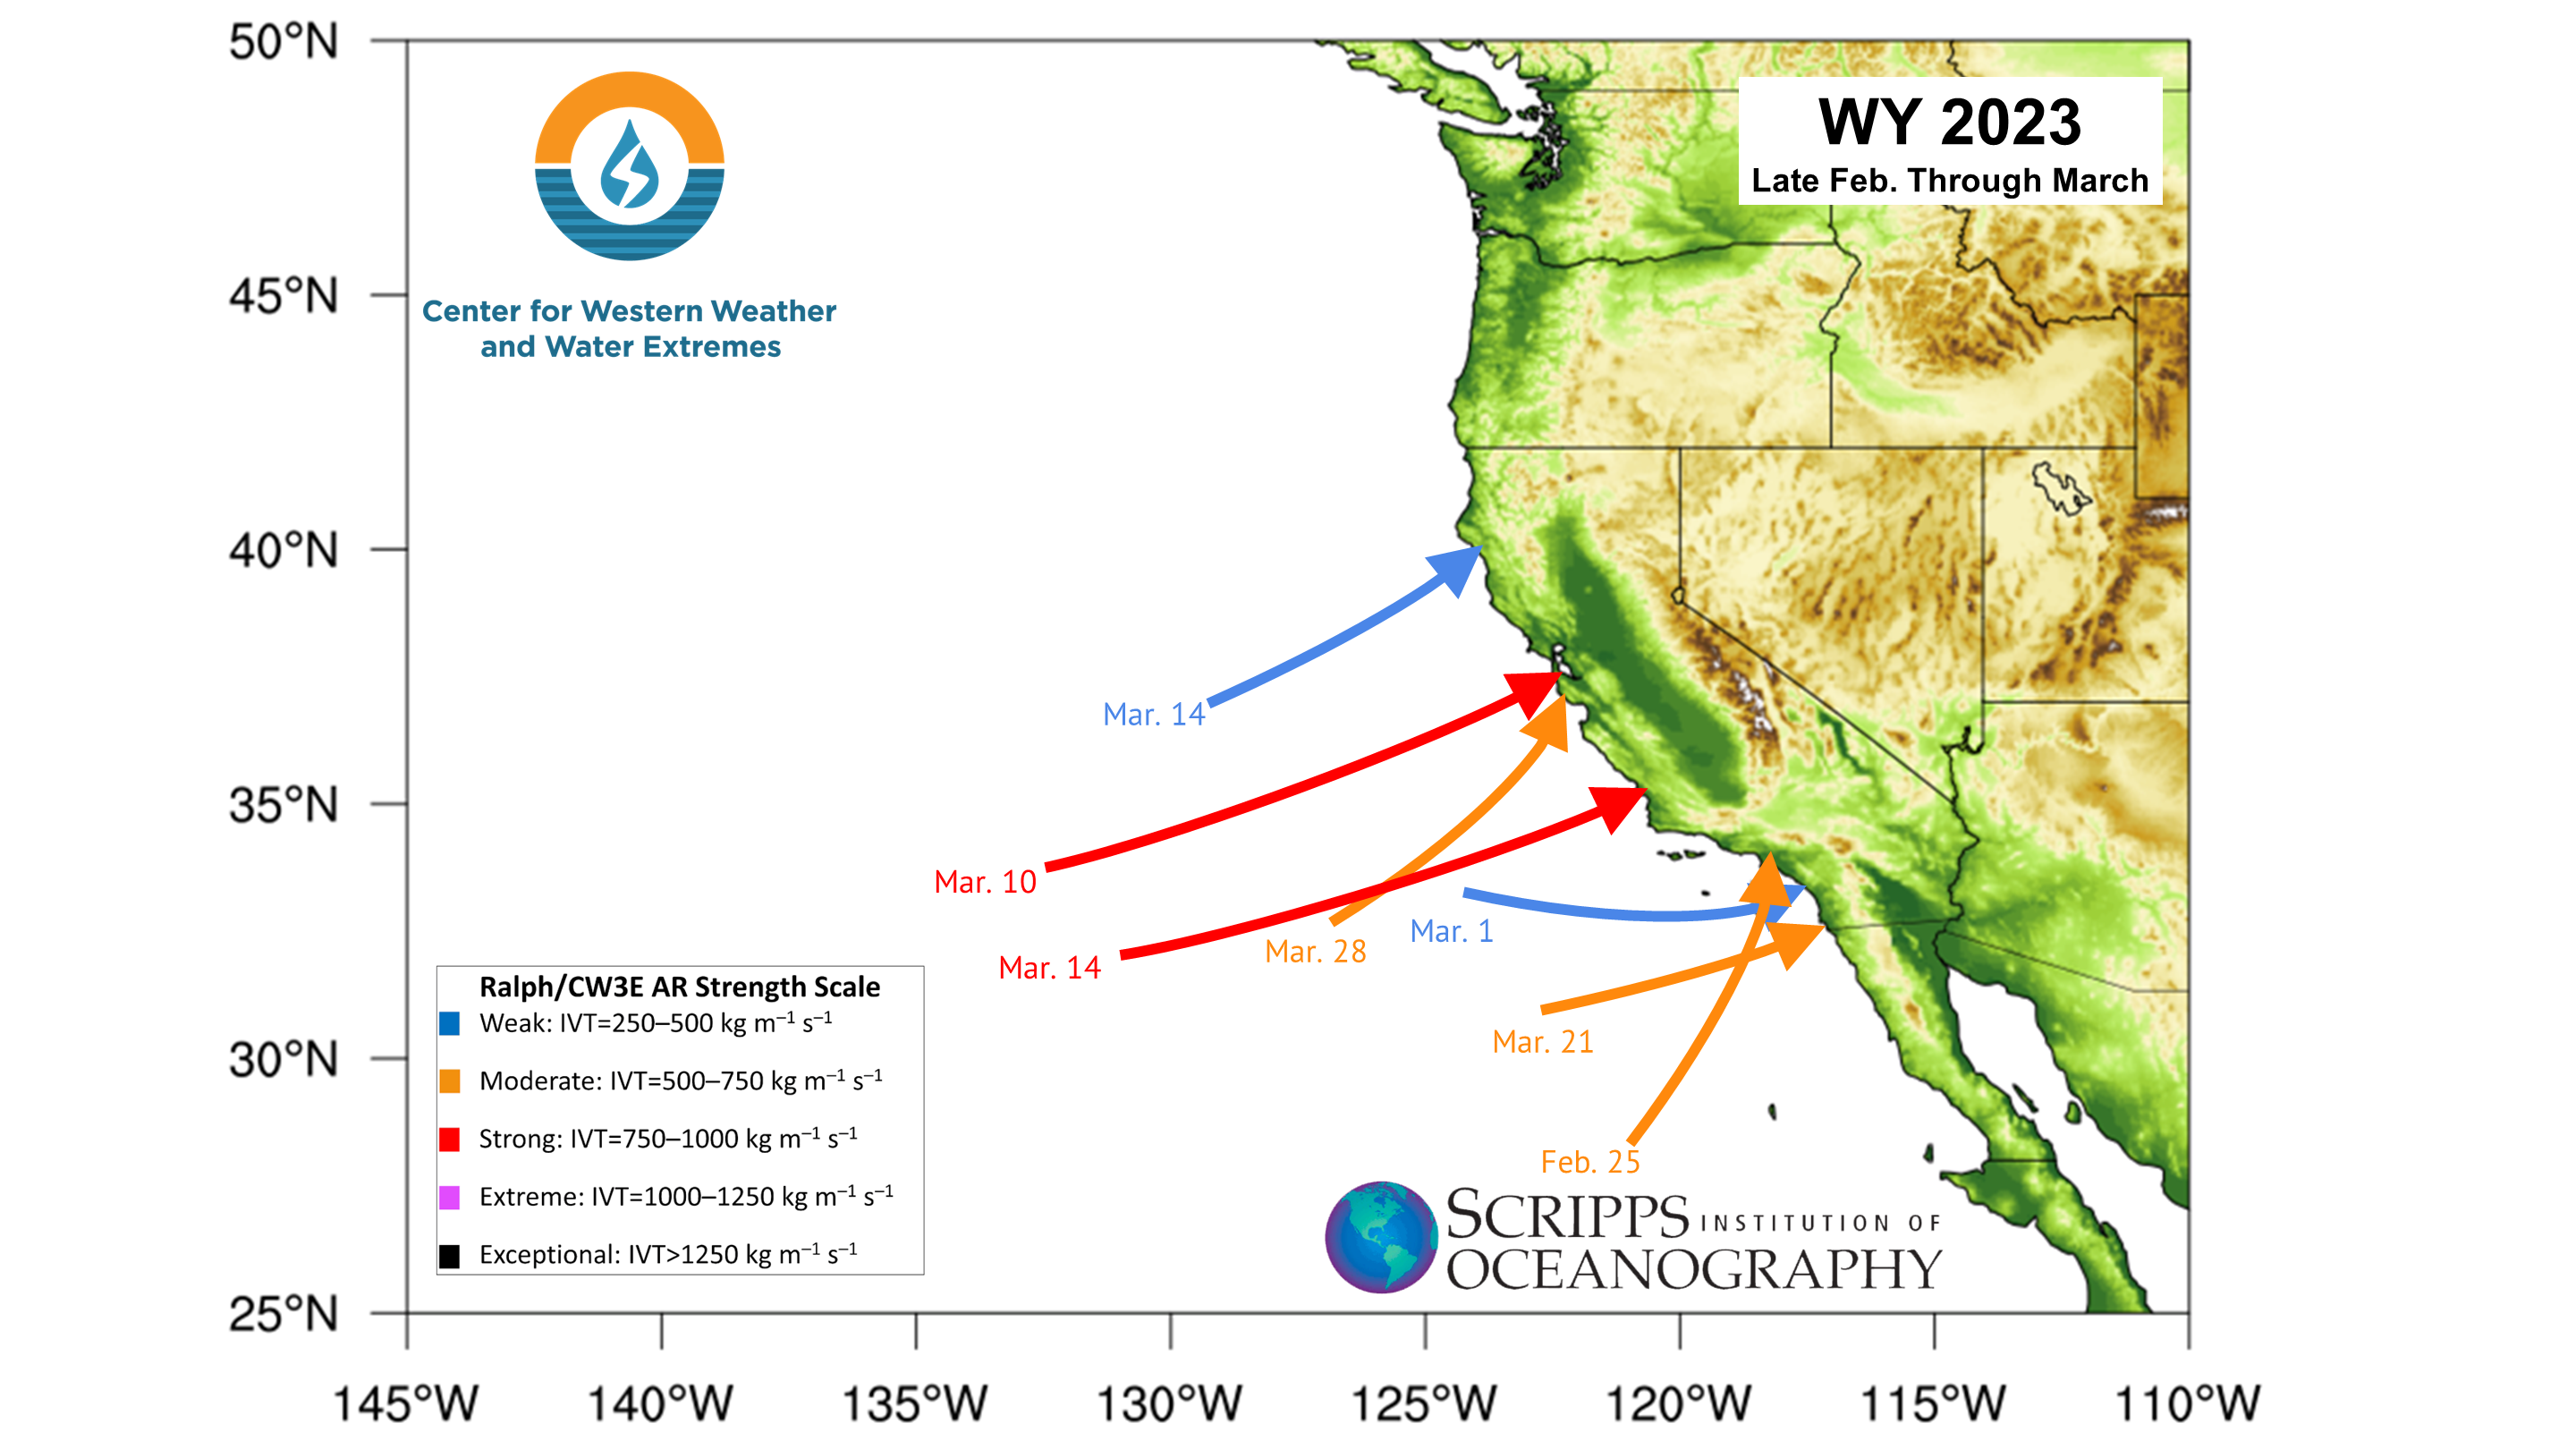 From December 2022 through March 2023, almost all of California and Nevada saw above-normal precipitation, with the most anomalous amounts primarily falling across central CA into central NV. The image below from the Western Regional Climate Center (WRCC) depicts a gridded ranking using PRISM data for the four-month period from December 2022 through March 2023. The period of record is from 1895 through 2023 and shows many locations ranking as either the "Record Wettest" or falling in the "Much Above Normal" Top-10 Percentile. Click on the image below to expand and open in a new tab. 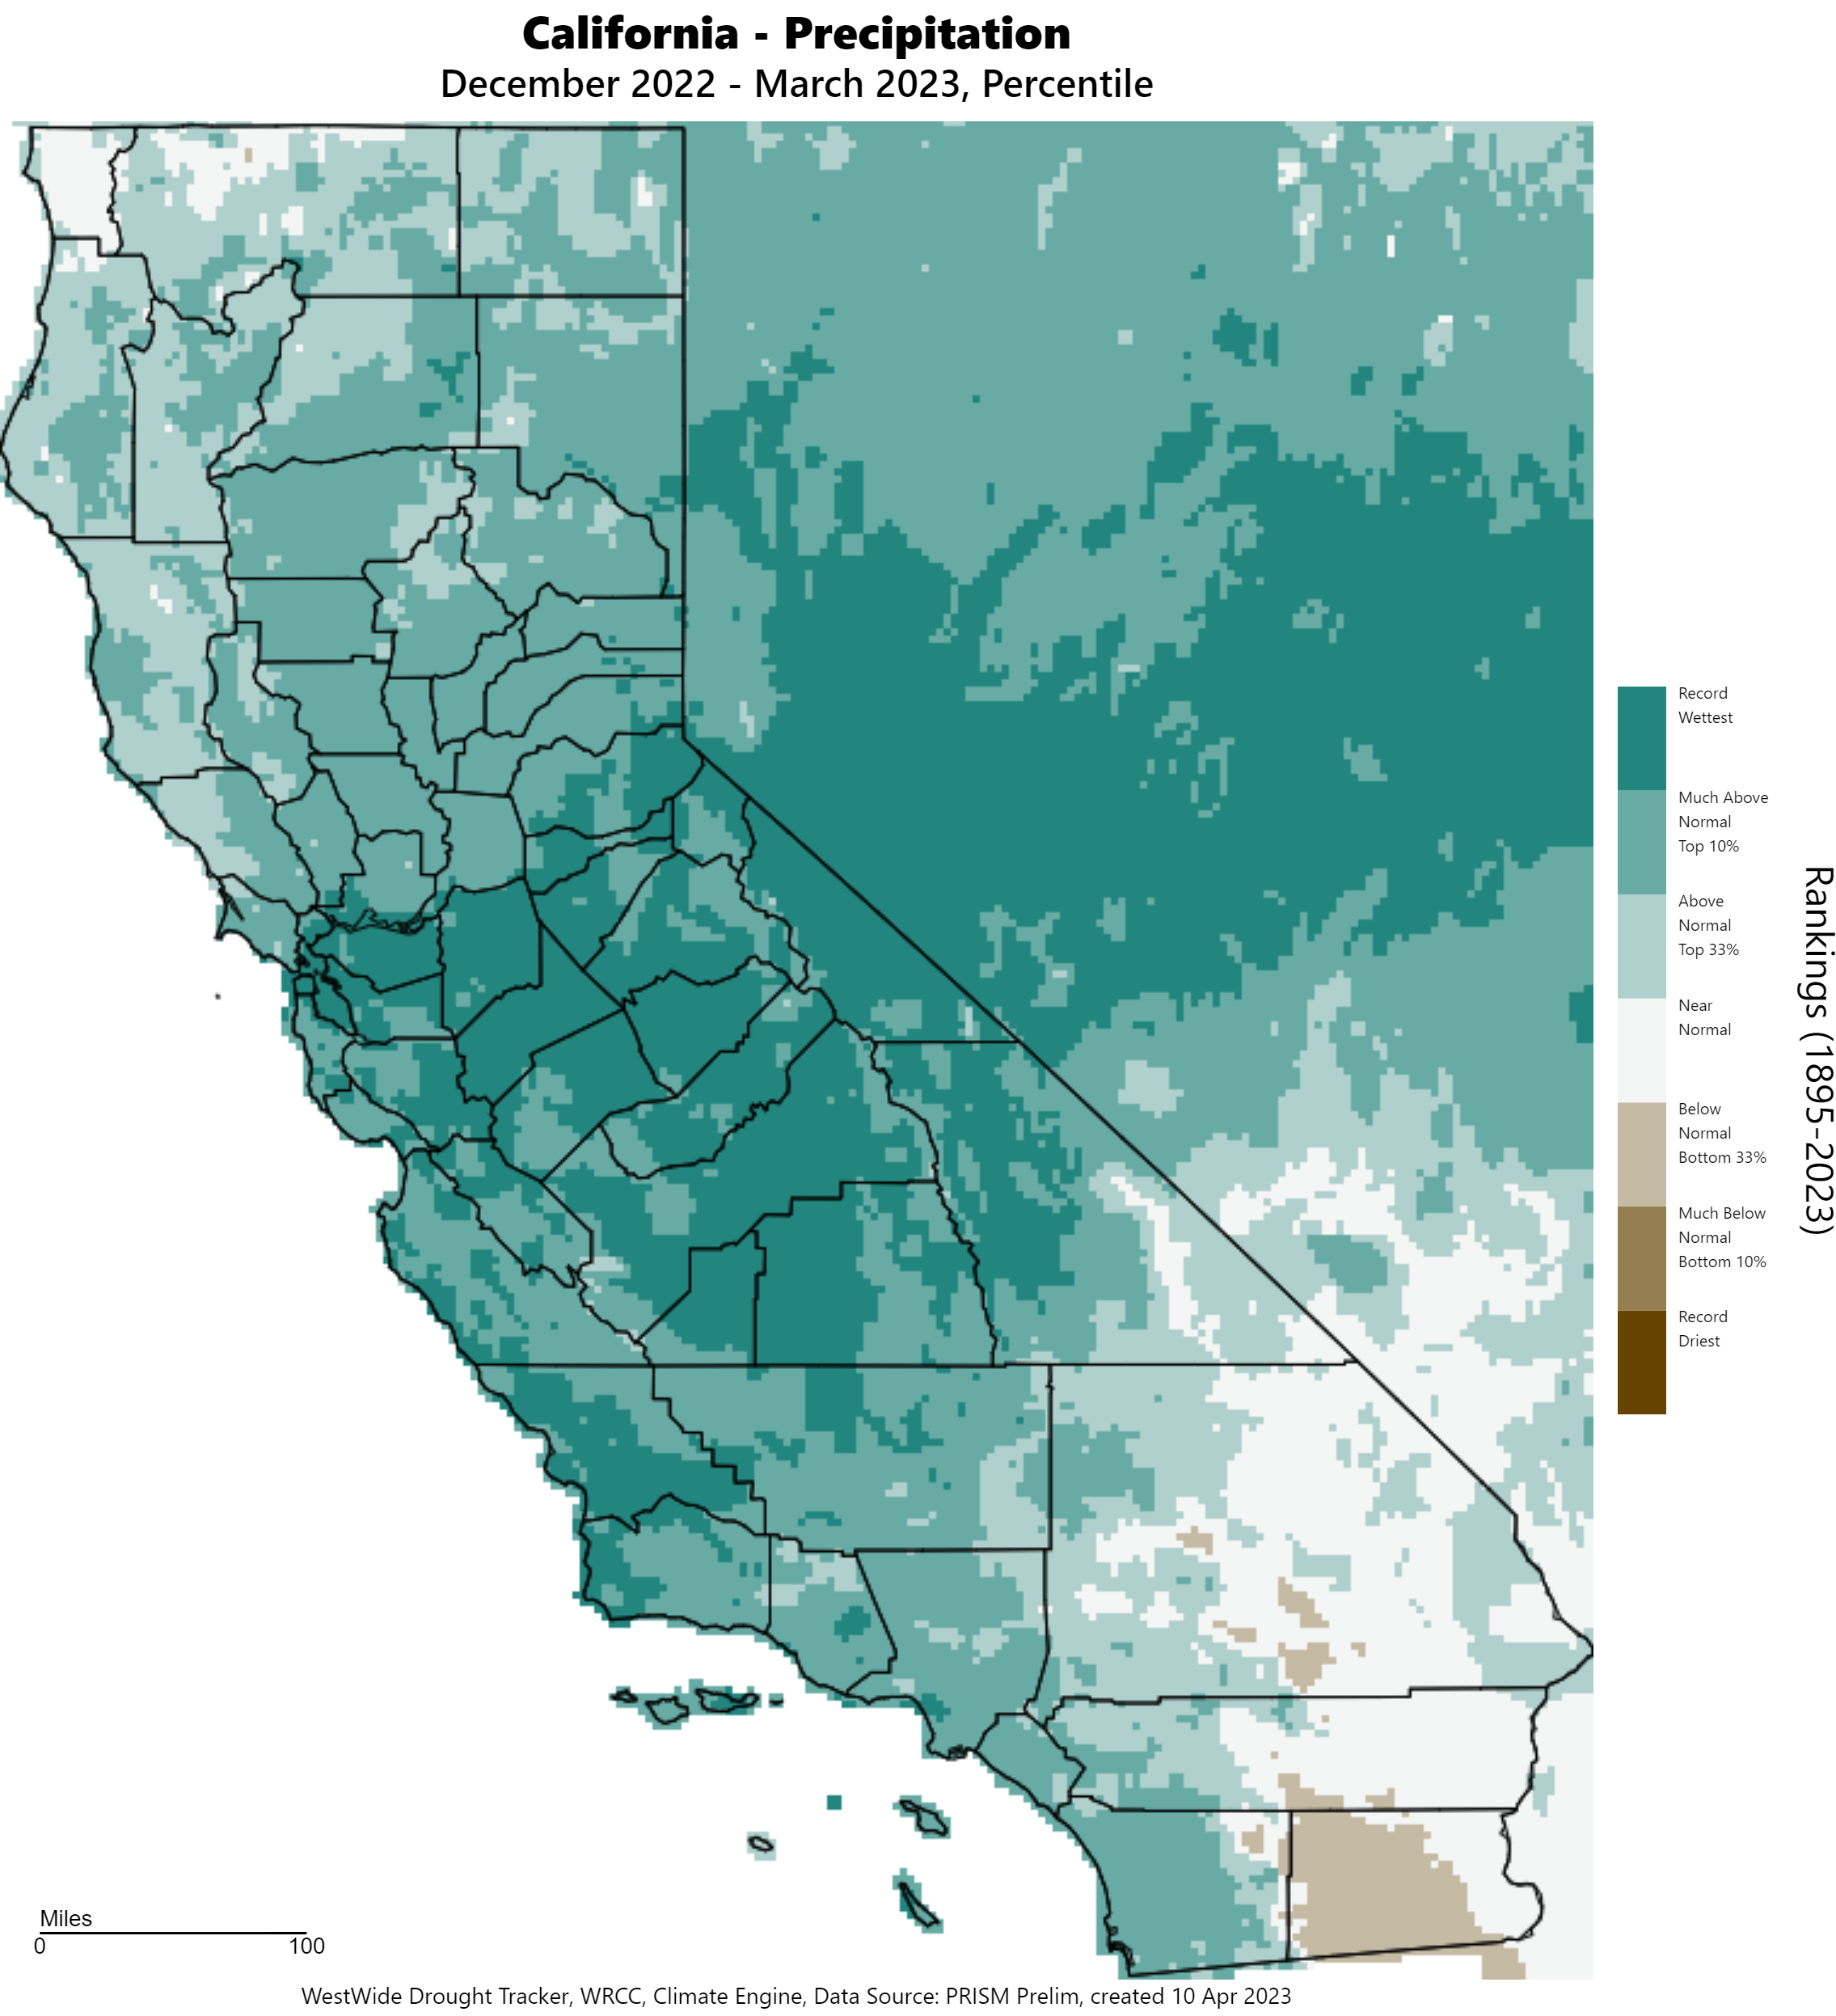 According to the NOAA National Centers for Environmental Information (NCEI) "Climate at a Glance", California saw the 7th-wettest December through March since 1895, while Nevada was the 3rd wettest. Precipitation was above average for California in December 2022 (ranking 17th-wettest out of 128 years [1895-2022]) and much above average for Nevada (ranking 8th wettest out of 128 years). In January and March 2023, much above average precipitation fell over California and Nevada, with January precipitation ranking 10th wettest for CA and 12th wettest for NV (out of 129 years). For March, California was 7th wettest since 1895, and Nevada was 6th wettest. Numerous precipitation records were tied or broken at Global Historical Climatology Network (GHCN) stations with the precipitation in December 2022 (267 daily records in CA and 121 in NV) and March 2023 (265 daily records in CA and 112 in NV). With this anomalously-high precipitation, drought impacts decreased this winter. The entire state of California was in a drought (100% in D0-D4) on December 6, 2022, improving to 34% in drought (D0 (abnormally dry) - D1 (moderate drought)) mainly across far Nrn CA and SE CA on April 11, 2023. Nevada was also in a drought in December 2022 (100% D0-D3) and improved to drought (D0-D2) in only 67% of the area on April 11, 2023, with almost 3% in D2 (Severe Drought) in Clark County, NV. Below are images of the US Drought Monitor showing the improvement in drought conditions across both California and Nevada. The U.S. Drought Monitor is created by a team of meteorologists and climatologists from the National Drought Mitigation Center at the University of Nebraska-Lincoln, NOAA, and the U.S. Department of Agriculture. Click on each image below to expand and open in a new tab. 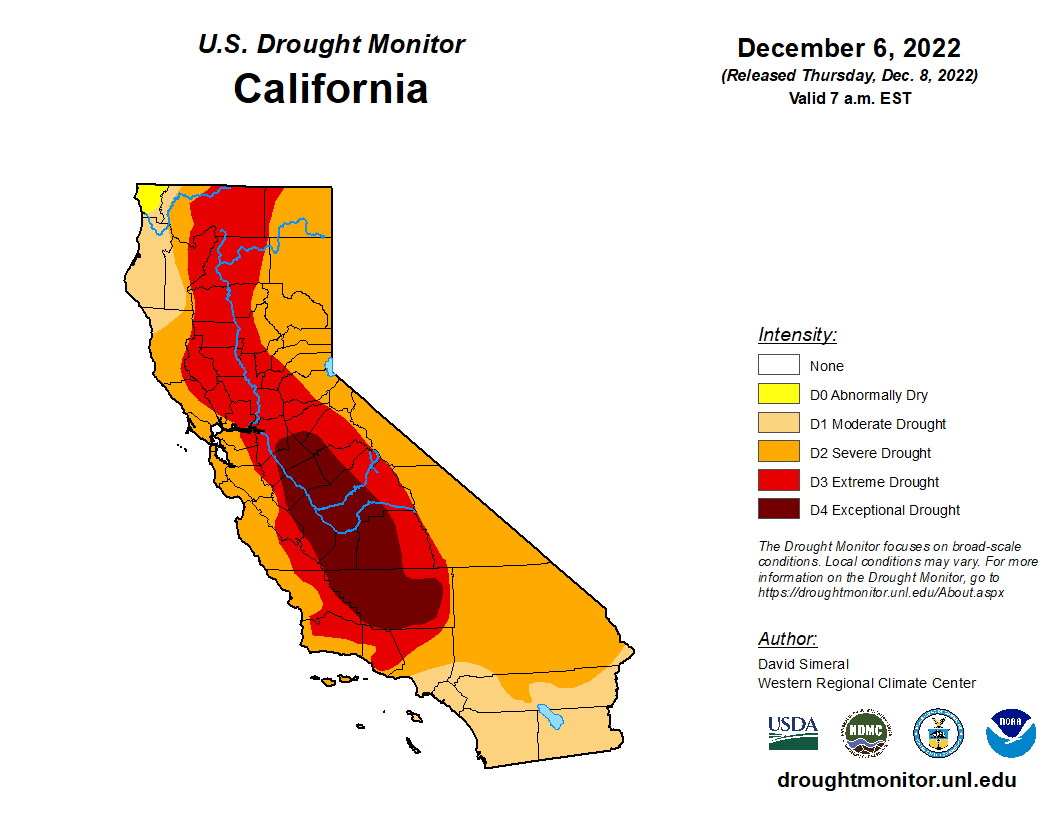 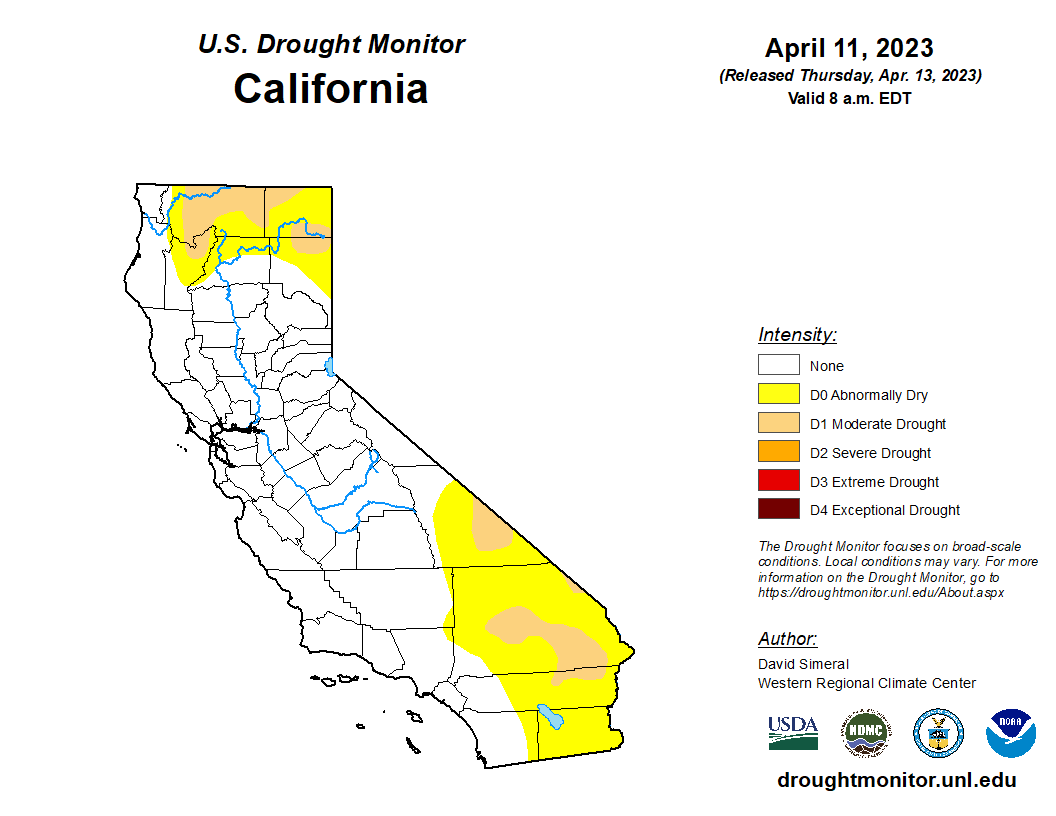 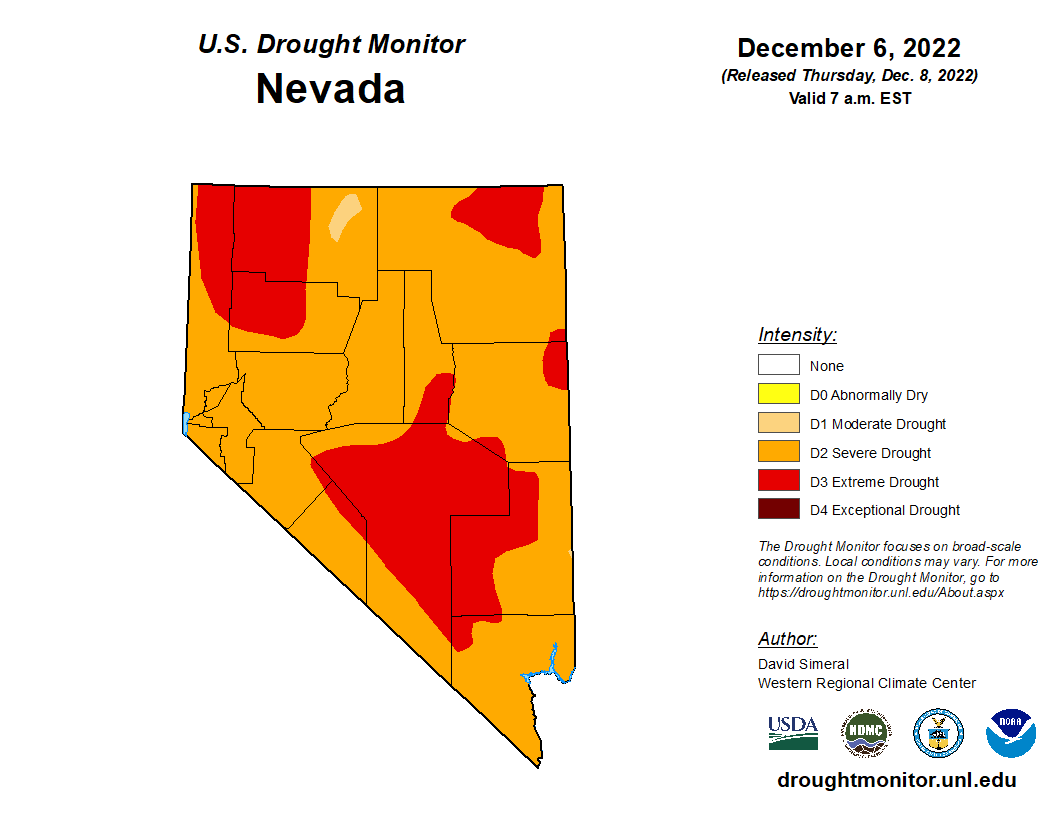 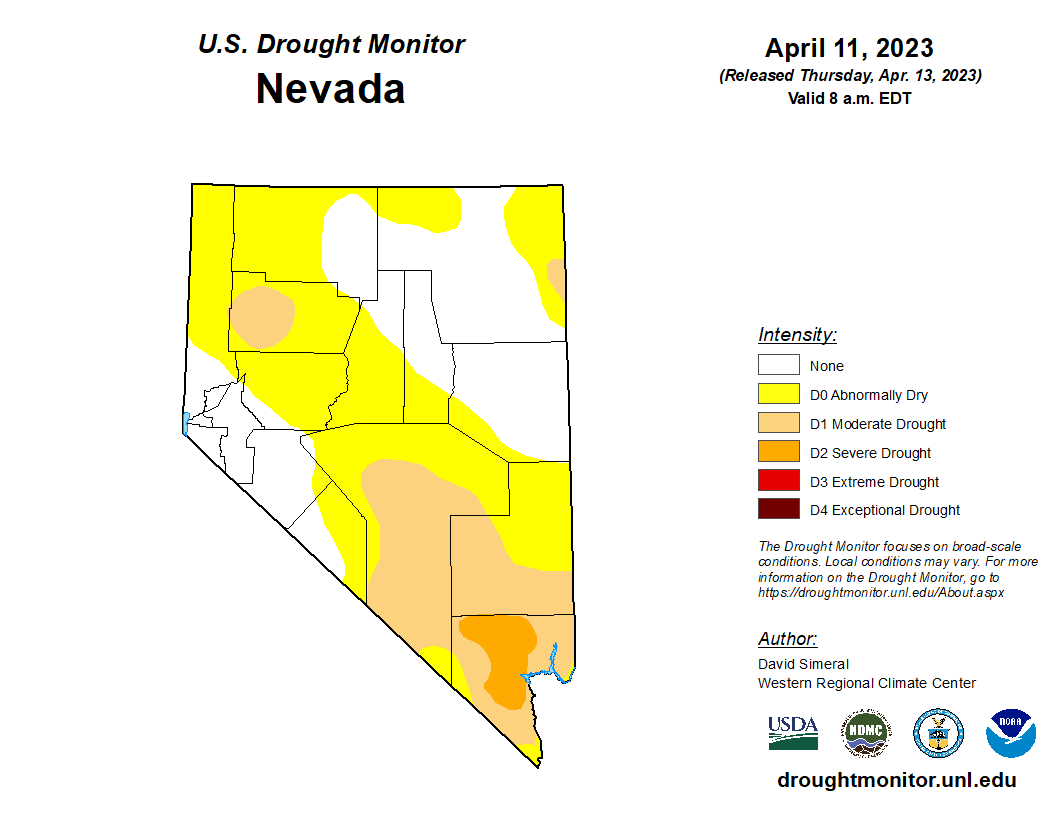 The Snow Water Equivalent (SWE) increased dramatically from December 2022 through March 2023, with the California statewide average Snow Water Equivalent increasing from 3.2” (106% of normal for the date) on December 1, 2022, to 61.1” (236% of normal for date) on March 31, 2023 (according to the California Cooperative Snow Surveys). The snow amounts compared to normal increased from north (191%) to south (294%). The northern Sierra had 3” (104% of normal for the date) on December 1, 2022, and increased to 57” (191% of normal for the date) on March 31, 2023. The central Sierra had 3.3” (100% of normal for the date) on December 1, 2022, and 62.5” (235% of normal for the date) on March 31, 2023. The southern Sierra had 3.1” (123% of normal for the date) on December 1, 2022, and 62.5” (294% of normal for the date) on March 31, 2023. The central and southern Sierra saw their highest-ever snow water content around March 31, 2023. In the last week of February (2/24-3/1), 8-12' of snow fell over the higher elevations. The snowpack at lower elevations was also significant throughout CA. For the season, Blue Canyon, elevation 5,280' along Interstate 80, accumulated 42" of SWE, which is the second-highest SWE accumulation at this location in the last 50 years. Abundant and heavy snow caused avalanches (10 between 1/10/23-3/29/23), snow loading on roofs, power outages, and lengthy road closures. Lower elevations also saw snow accumulations, with snow levels dropping as low as around 500 feet with the colder storms at the end of February. The image below shows a trace of the California statewide snowpack throughout the 2022-2023 Water Year, peaking near or just after April 1, 2023, which is when the snowpack in California typically peaks.  December through March was cool, with nearly the entire region seeing below-average temperatures, and numerous daily minimum and low-maximum temperatures records being tied or broken. The image below from the Western Regional Climate Center (WRCC) depicts a gridded ranking using PRISM data for the four-month period from December 2022 through March 2023. The period of record is from 1895 through 2023 and shows almost the entire states of California and Nevada at least in the "Bottom 33%", with a smaller subset in the "Bottom 10%" and even "Record Coldest". Click on the image below to expand and open in a new tab. 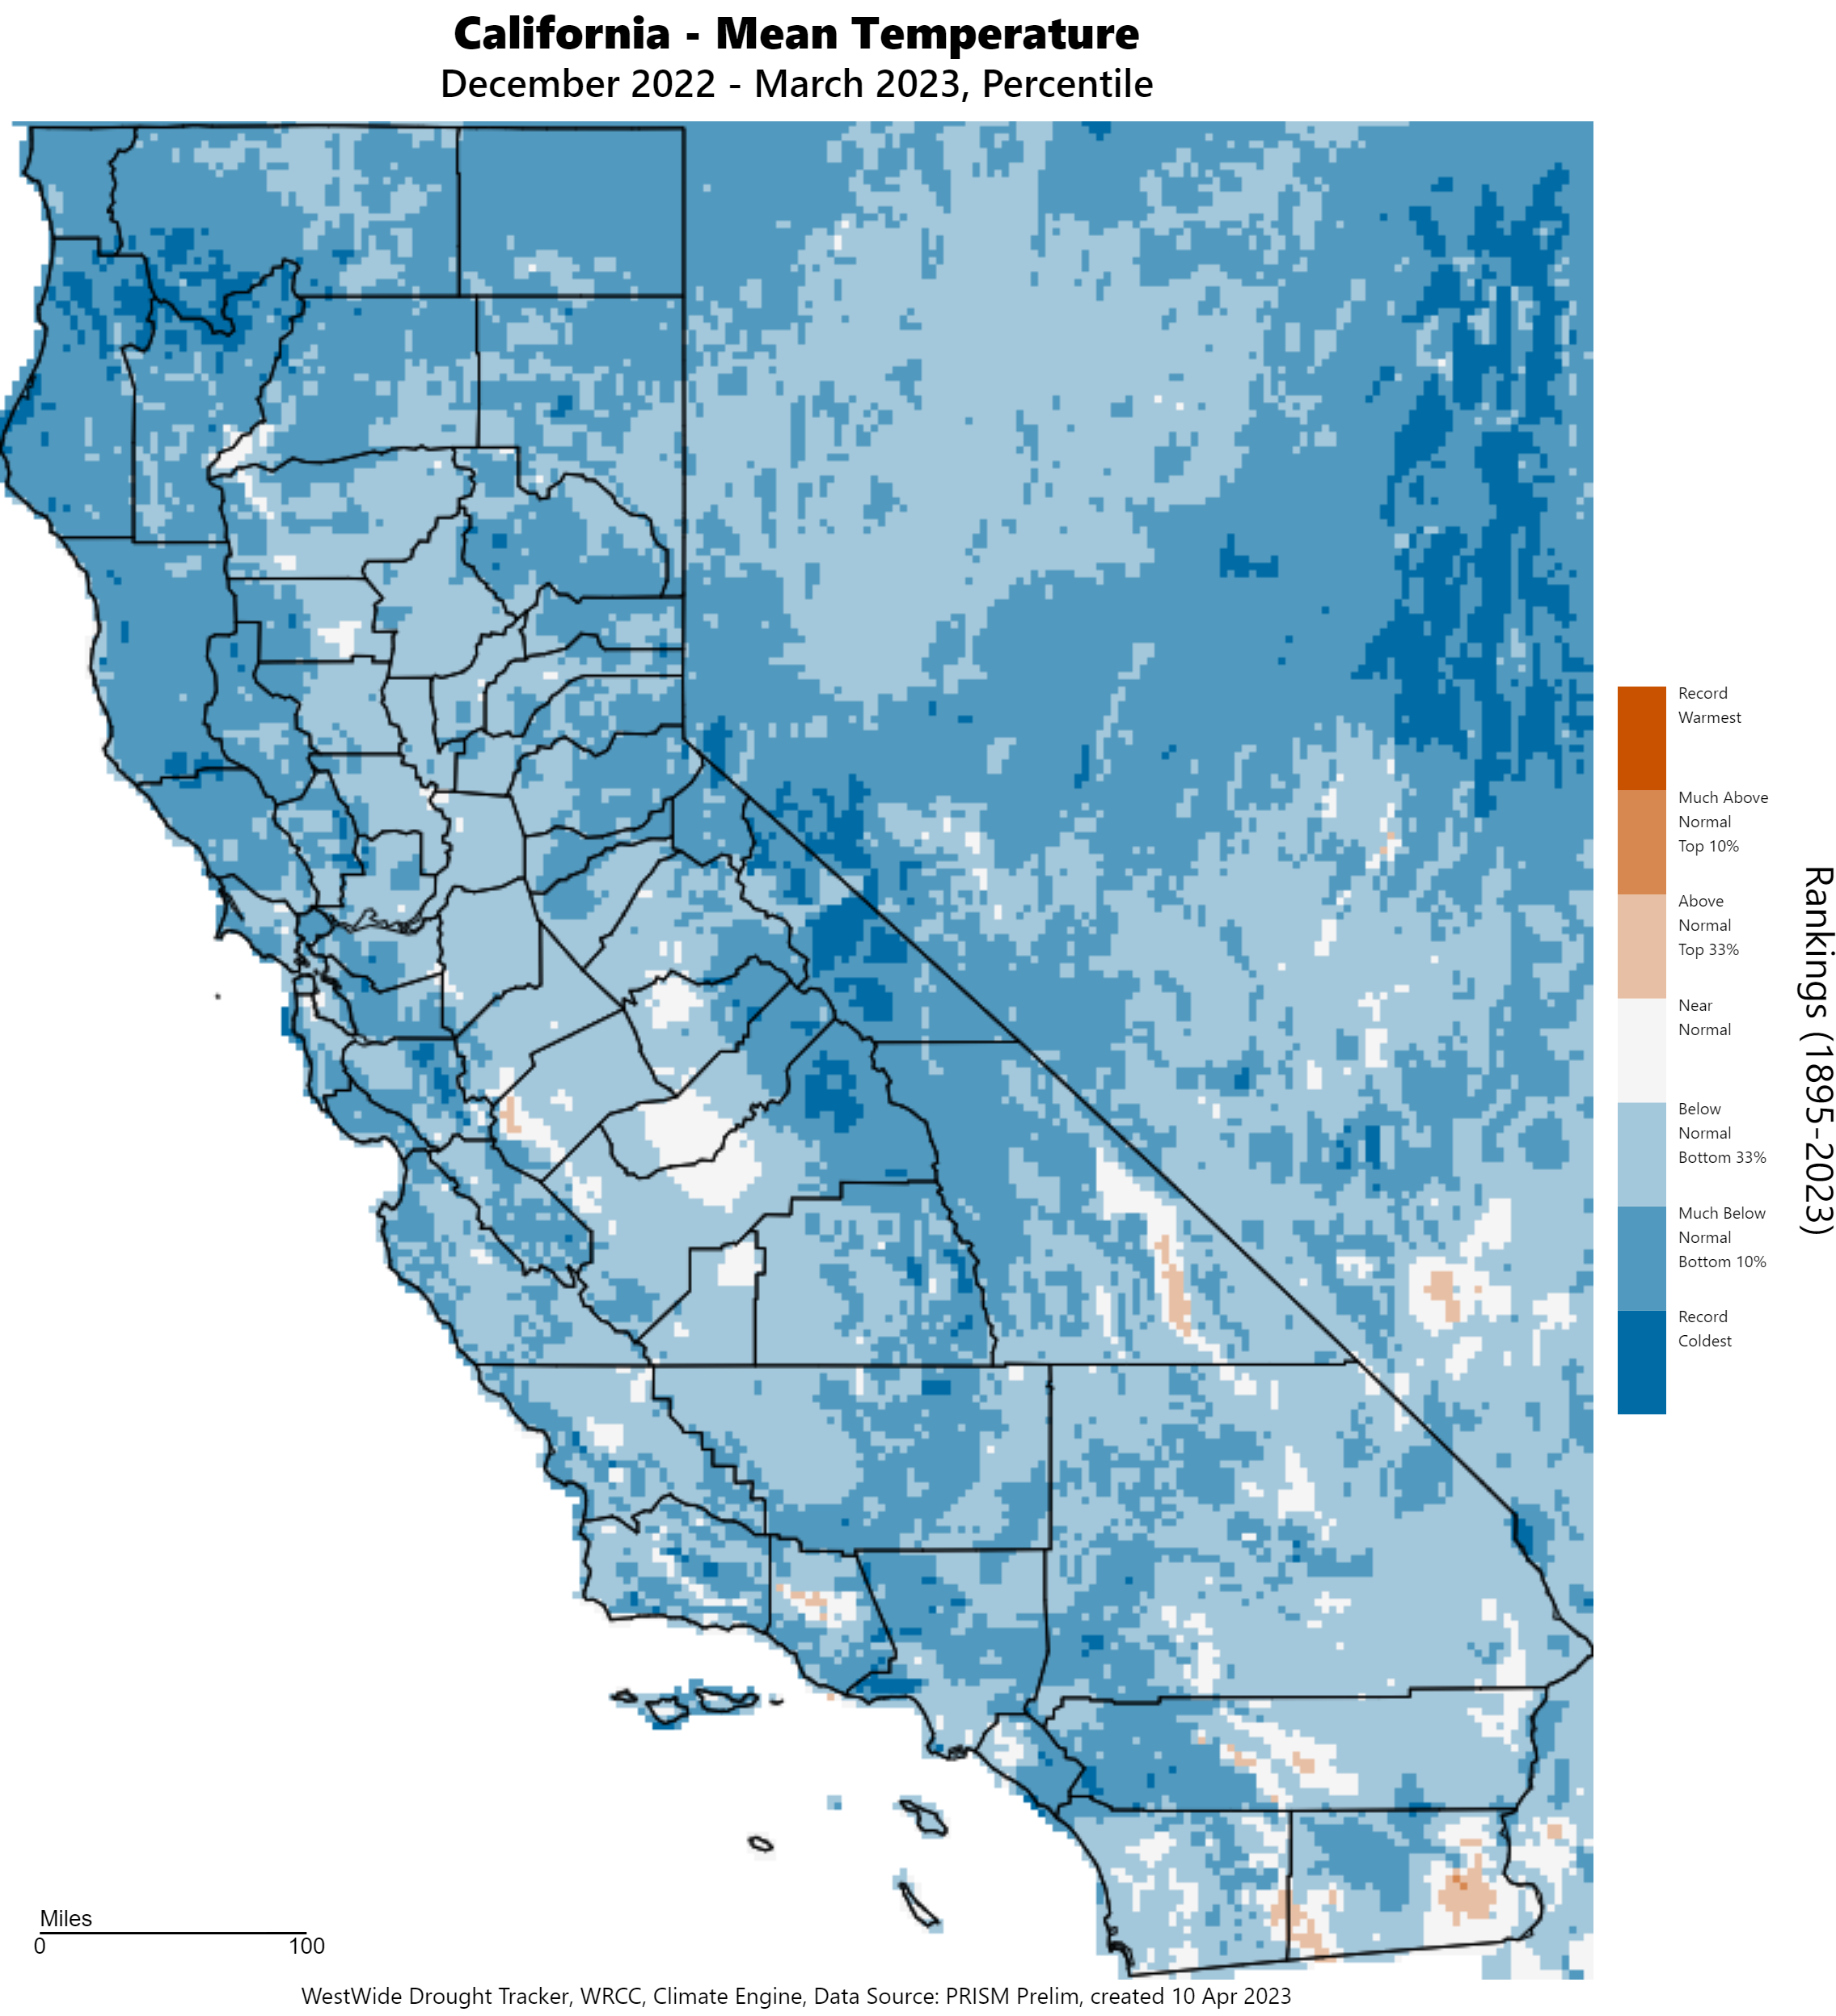 According to the NOAA National Centers for Environmental Information (NCEI) "Climate at a Glance", maximum temperatures were the 13th coldest in California for December 2022 through March 2023 and the 11th coldest for Nevada (out of 128 years of record). The average temperatures were 17th coldest in California and 18th coldest in Nevada. Minimum temperatures were 32nd coldest in California and 35th coldest in Nevada. January saw below-average maximum temperatures (ranking 39th coldest for California and 30th coldest for Nevada out of 129 years). February also saw below-average maximum temperatures (33rd coldest for California and 28th coldest for Nevada) and below-average minimum temperatures (ranking 16th coldest for California and 26th coldest for Nevada out of 129 years). In February 2023, an amazing 666 daily low maximum temperature records were tied or broken in California at Global Historical Climatology Network (GHCN) stations. March 2023 had the 3rd-coolest maximum temperatures for March since 1895 for California and Nevada. Minimum temperatures ranked 15th coldest for California and 11th coldest for Nevada in March 2023. Average temperatures in March ranked 5th coldest in California and Nevada. Low maximum temperatures records were broken or tied numerous times in March 2023, with 643 in California and 388 in Nevada at GHCN stations. Overnight temperatures were also cool in March 2023 with low minimum temperatures tied or broken 459 times in California and 237 times in Nevada at GHCN stations. Heavy precipitation brought flooding to many creeks, streams, and rivers, along with substantial storage increases in area reservoirs, including the reemergence of the normally dry lake bed, Tulare Lake. River forecast points on the Mad, Eel, Navarro, Russian, Salinas, Carmel, Sisquoc, Santa Ynez, Ventura, Sacramento, San Diego, Santa Margarita, Cosumnes, Mokelumne, East Fork of the Carson, and Susan Rivers and Sespe and Bear Creeks reached flood stage in the December-January storms. Points on the Eel, Navarro, Russian, Salinas, Carmel, Santa Ynez, Ventura, Santa Clara, Sacramento, Middle Fork of the Feather, Merced, San Joaquin, West Fork of the Carson, and Humboldt Rivers reached flood stage in February-March 2023 storms. Reservoir percent of average storage levels on December 1, 2022 were 57% at Shasta, 55% at Oroville, 64% at Folsom, 76% at Don Pedro, and 58% at Pine Flat. Reservoir levels increased by the end of March 2023 to 105% of average at Shasta, 116% at Oroville, 109% at Folsom, 115% at Don Pedro, and 137% at Pine Flat. The images below provided by the California Department of Water Resources (CA DWR) show the state of reservoirs across California from before the heavy precipitation to after the series of storms impacted California and Nevada. To expand each image in a new tab, click on each image. 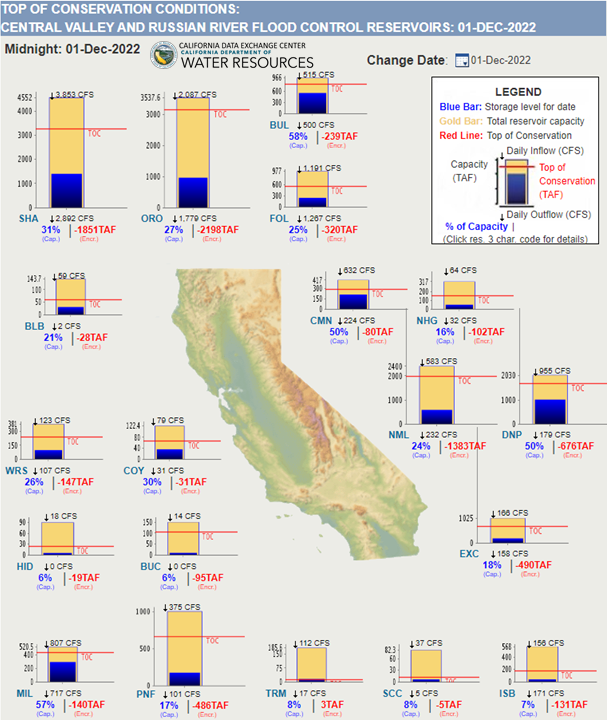 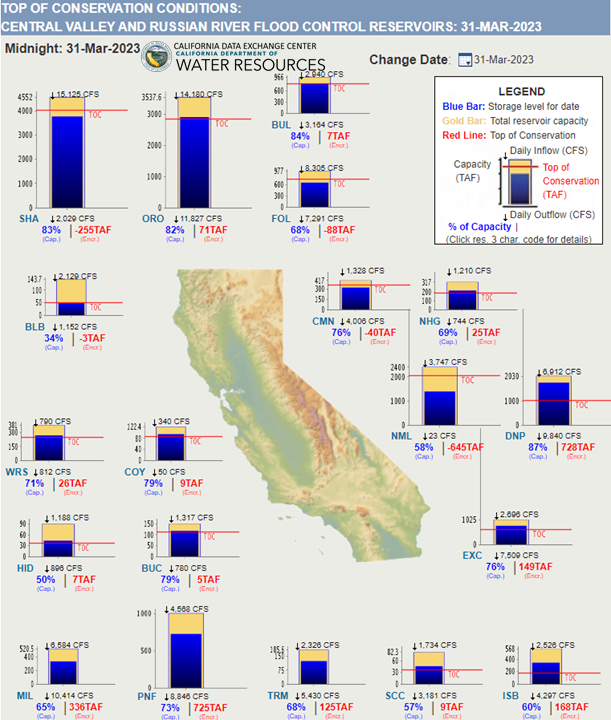 Flooding impacted homes, businesses, roads, vehicles, levees, and agriculture, along with other infrastructure. Many water rescues were performed in the flooded rivers throughout California. Strong wind from the storms, especially the bomb cyclones, brought wind gusts as high as 80-100 mph in some areas, leading to numerous power outages and downed trees. Seven tornadoes occurred in California from January 10, 2023, through March 22, 2023, in Sacramento, Los Angeles (2), Mendocino, Tuolumne, and Santa Barbara Counties, with magnitudes of EF0 or EF1. Mud and debris flows, especially over recently-burned areas, and landslides were also observed due to the heavy precipitation. The impacts of the floods and winds led to over 20 fatalities. Flooding disasters in California cost $3.5 billion (CPI-Adjusted Estimated cost) for December 26, 2022, through March 19, 2023, and resulted in 22 deaths, according to NCEI Billion-Dollar Weather and Climate Disasters. The image below links to the U.S. 2023 Billion-Dollar Weather and Climate Disasters on the NCEI website, which depicts the California flooding as one of the dozens of these types of disasters across the U.S. Also, NCEI provides a PDF document that summarizes all of the U.S. Billion-Dollar Weather and Climate Disasters since the year 1980. 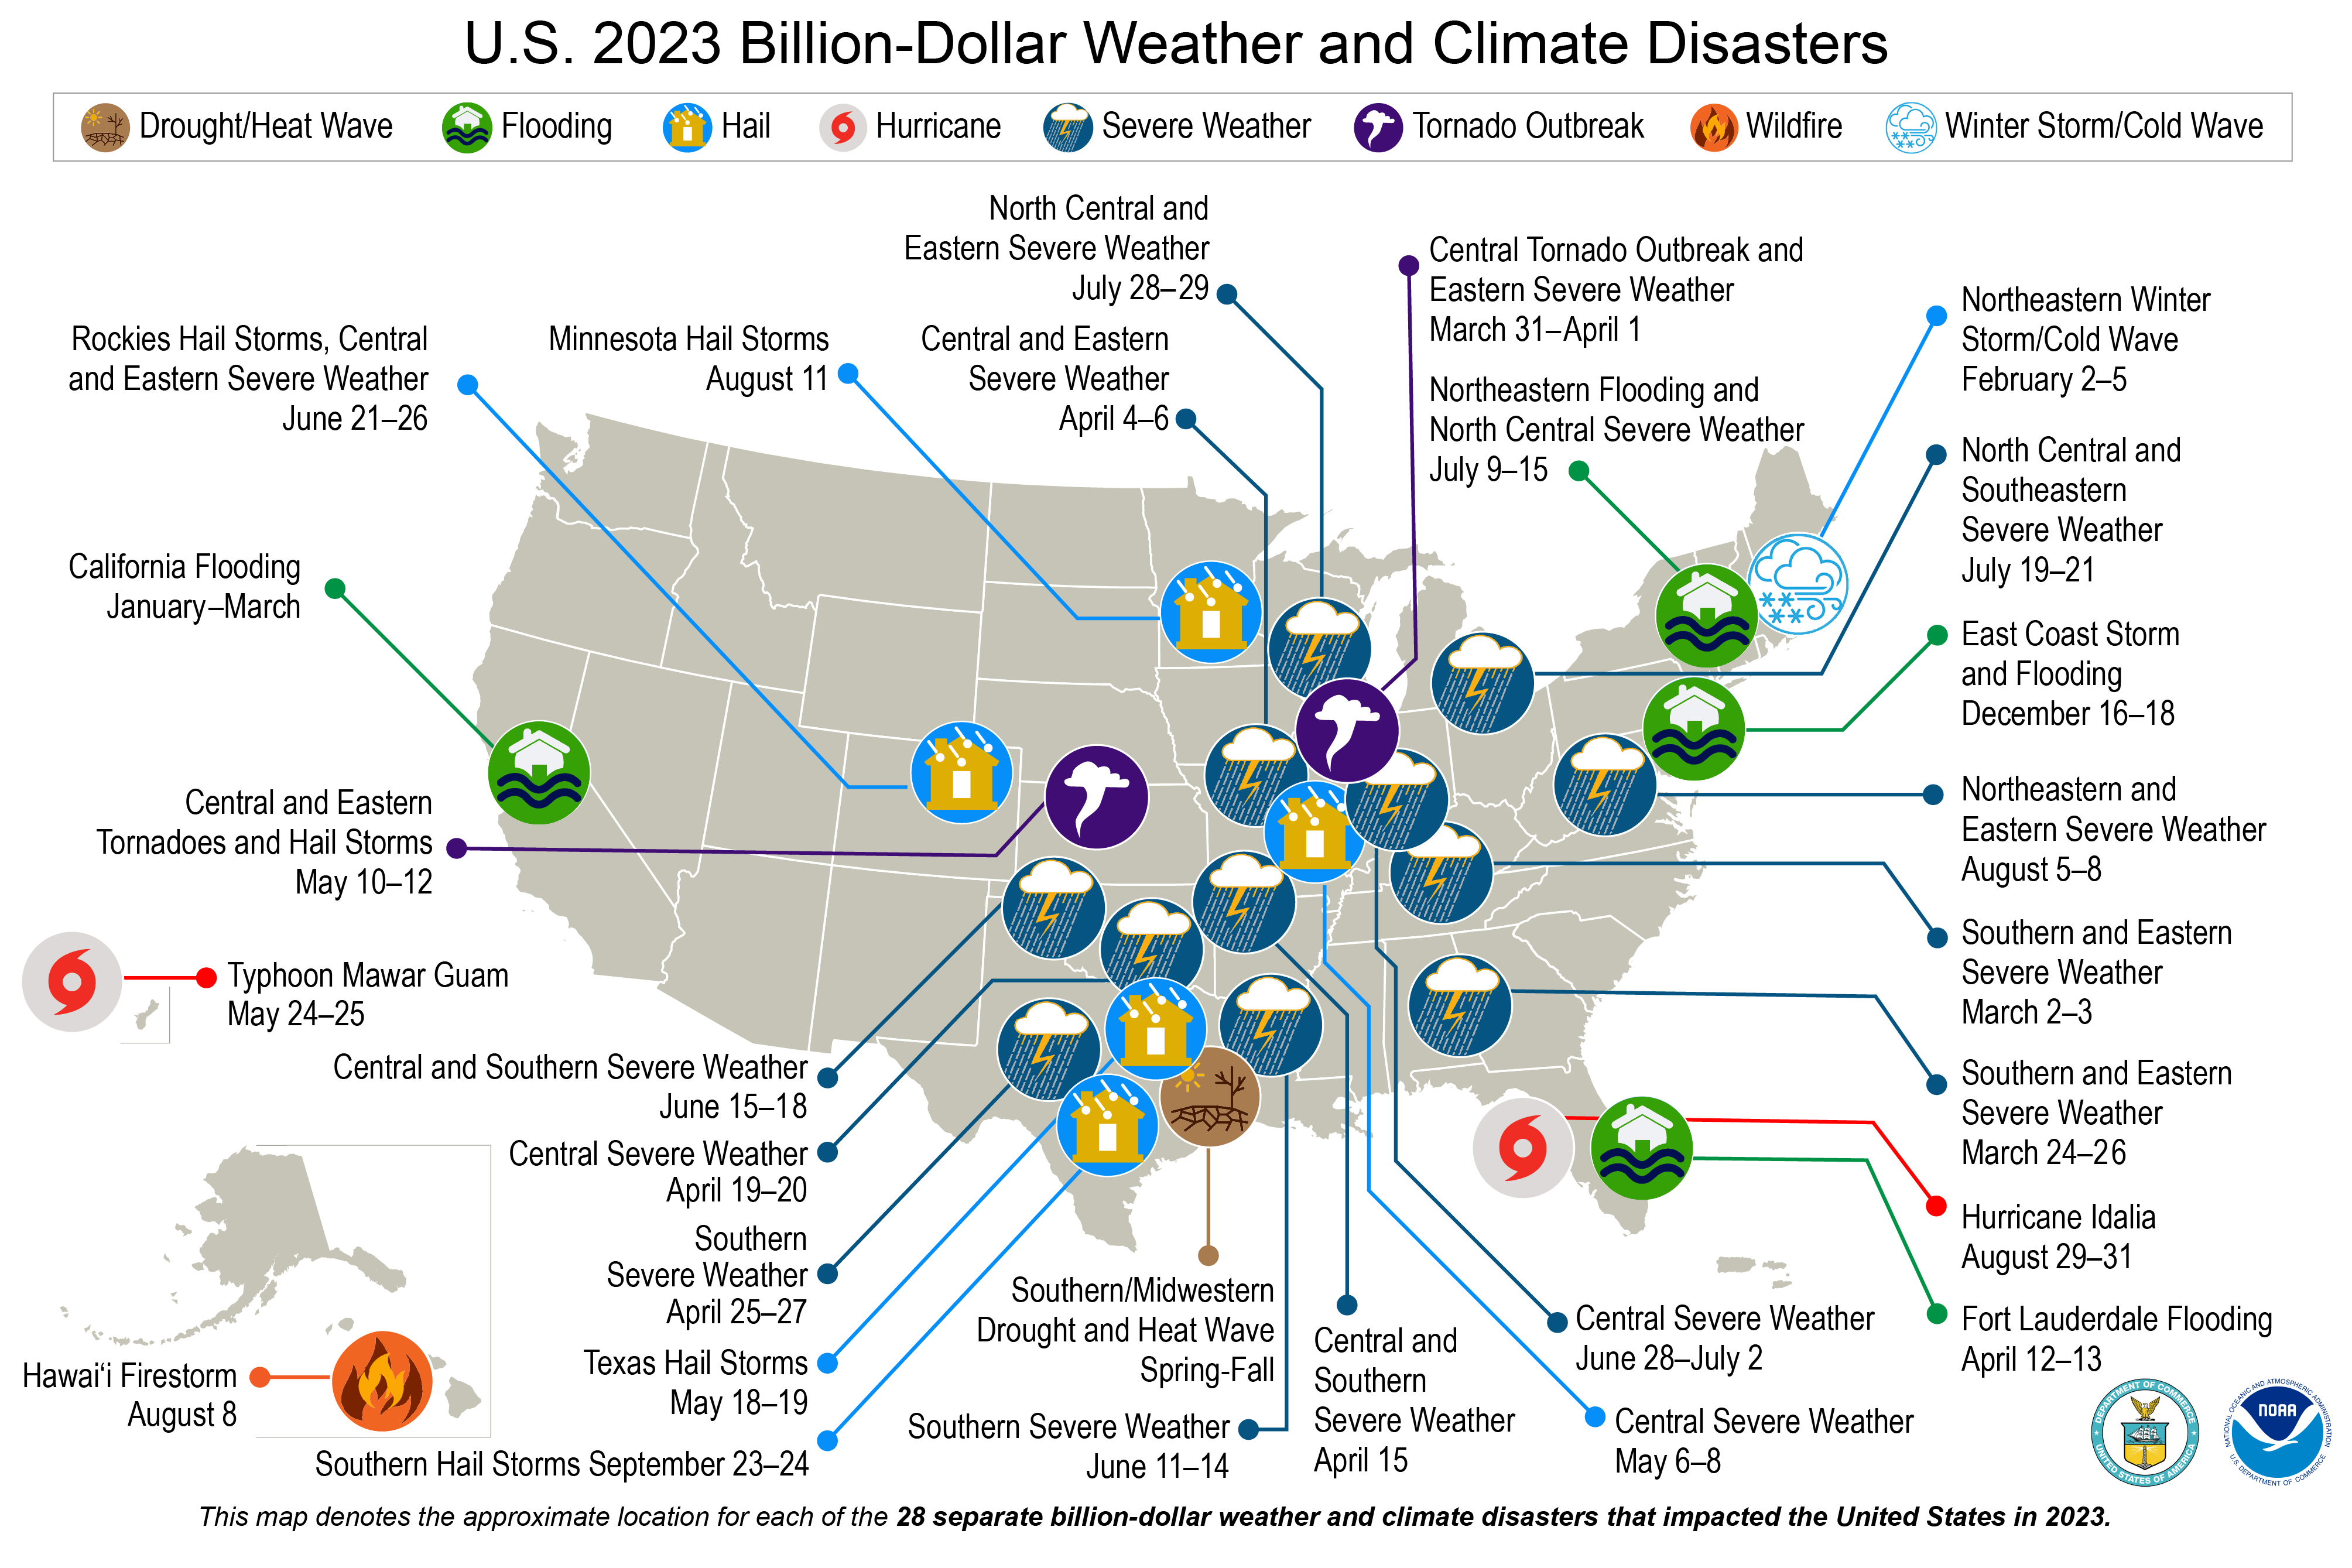 A second prolonged active period of weather impacted the west coast, in particular central California, from late February through March. These colder systems entrained copious amounts of moisture from the lower latitudes and brought above-normal precipitation that contributed to a record or near-record snowpack across the Sierra, especially the central and southern portions of the mountain range. The following section summarizes the observed precipitation and evolution of the snowpack from late February through March 2023. The table below provides a link to an interactive map interface with the ability to view both quality-controlled point and gridded data at daily and multi-day timesteps. This covers the period of the prolonged active weather pattern from February 21, 2023, at 4 AM PST through March 31, 2023, at 5 AM PDT. Daily products are available for the entire period along with several distinct periods throughout the heavy precipitation. The first covers February 23, 2023, at 4 AM PST through March 1, 2023, at 4 AM PST covering the onset of the series of storms affecting the region. The next spans a period from March 8, 2023, at 4 AM PST through March 16, 2023, at 5 AM PDT, which includes the most active period in terms of precipitation, centered around March 10-11 with a second maximum around March 15. The final multi-day period covers the tail end of the event from March 20, 2023, at 5 AM PDT through March 31, 2023, at 5 AM PDT. Also, there is an option to view the entire time period of this active weather pattern, covering the almost 40-day stretch.
The two interfaces below provide options to download quality-controlled precipitation data in either gridded static PNG images (daily only), or point XML format files (daily and multi-day). The data is valid starting and ending at 4 AM PST (5 AM PDT).
After a relatively quiet period in terms of precipitaton from late January through the first three weeks of February, another period of unsettled weather with several rounds of precipitaiton moved across the area. The graph below shows both daily and accumulated precipitation amounts at the California Department of Water Resources' 8-Station (Northern Sierra), 5-Station (San Joaquin Basin), and 6-Station (Tulare Basin) indices from February 22, 2023, through March 31, 2023. The daily amounts (ending 4 AM PST/5 AM PDT) show the first significant wave of precipitation on February 25, with precipitation continuing through the end of the month. The next impactful series of storms moved in on March 10-11, with precipitation continuing until a secondary wave of precip moved through on March 15. Then through the second half of the month, although not nearly as strong, rounds of precipitation continued to affect the region. During this nearly 40-day period, the focus of the storm track was primarily central California. Accumulated precipitation in the 5-Station (25.00") and 6-Station (24.82") indices were nearly identical, while the 8-Station Index (typically the wettest) received 20.27". This is also evident when looking at the entire months of February and March combined. The 8-Station Index received 21.93" of precipitation during the two-month period, which is only 129% of average and ranks as 16th wettest (Wettest: 1986 Water Year with 37.72"). In comparison, the 5-Station Index received 26.38" of precipitation during February and March 2023, which is twice the average and 4th-wettest on record (Wettest: 1986 Water Year with 32.01"). More impressive is the precipitation total for the 6-Station Index: 25.65". This amount is 267% of average, and when compared to the historical data ended up setting the record for the wettest February and March combined (Previous Record Wettest: 1938 Water Year with 23.18").
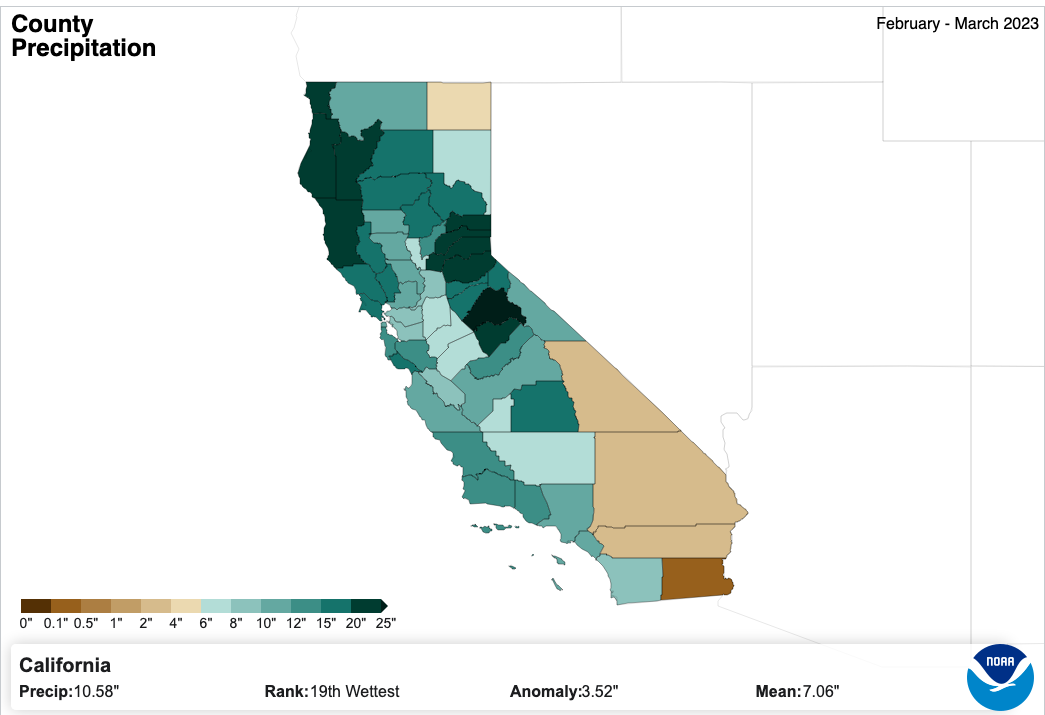
The series of maps below are from the NOAA National Centers for Environmental Information's "Climate at a Glance", showing county-based precipitation across California and Nevada for the combined period of February and March. The first column of buttons displays the county-based observed precipitation. The second column of buttons displays the county-based precipitation rank, based on 129 years of data back to 1895. The third column of buttons displays the county-based precipitation anomaly. Finally, the fourth column of buttons displays the county-based precipitation mean using data between 1901 and 2000. As expected, anomalous precipitation amounts across the region were widespread, and most counties across California (except Del Norte and Imperial counties) and Nevada (except Clark County) ranked at least in the top third wettest on record. It should be noted, there were several counties across central/southern California and central/southern Nevada that ranked in the top 10% wettest, which is not surprising given the hydrologic impacts observed across these areas.
The late February and March 2023 period brought historic precipitation to California and Nevada, setting several hundred station indvidual daily precipitation records, a couple dozen monthly preciptation records, and even a few all-time precipitation records, according to the NOAA National Centers for Environmental Information. The link below will open a webpage in a new tab containing several tables with the new records, the previous records, the date of the previous record, and the period of record for the station.
With the period from late February through March generally being dominated by cooler moisture-laden storms, the California snowpack increased considerably, and in some locations, mainly over the central and southern Sierra, reached record levels. According to the NOAA National Centers for Environmental Information's "Climate at a Glance", the average temperature across California was 43.5°F (-3.6°F anomaly). This ended up being the 6th coldest on record, which includes data back to 1895 (129 years), pointing to the cooler airmass across the region with relatively lower snow levels. Looking at the chart below, the three distinct sections of the Sierra saw an increase in SWE close to 25". This took the statewide percent of average SWE from 174% on February 22, 2023, to 236% on March 31, 2023, when the snowpack is typically near its peak. The statewide SWE on March 31, 2023 was recorded at 61.1". This rivaled the 1983 WY, which is considered the historical banner year.
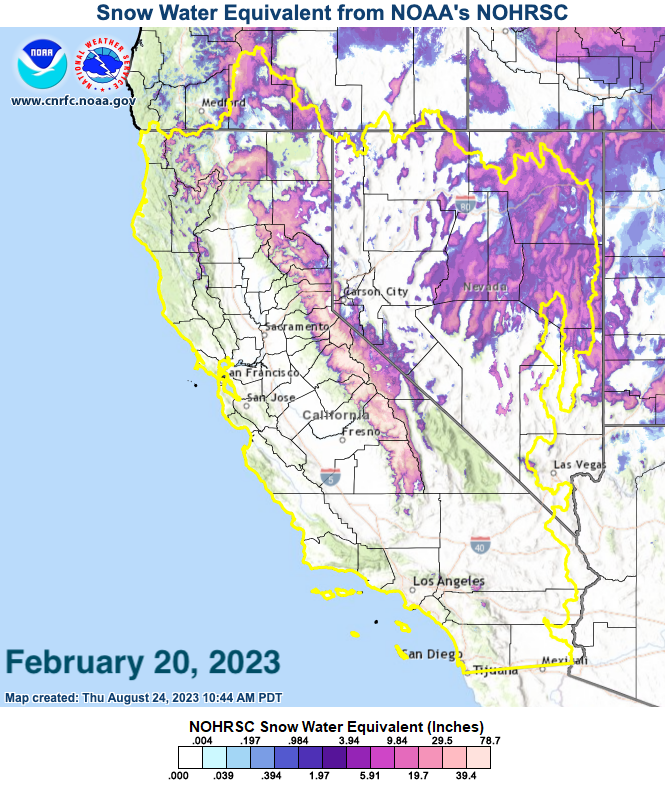
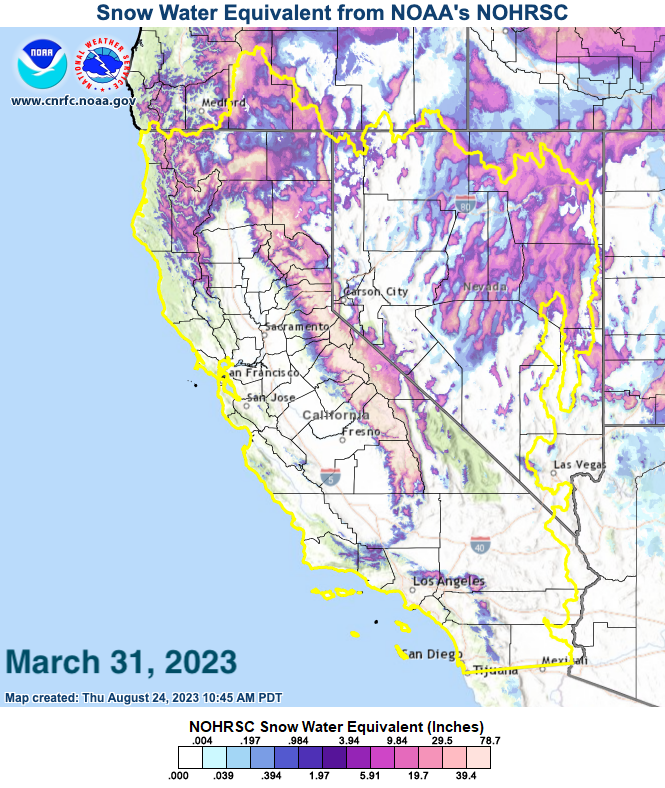
The interface below allows the user to compare the modeled snowpack between the beginning of the active weather pattern on February 20, 2023, and the end of the stormy period on March 31, 2023. Coincidentally, the end date is when the snowpack is historically at its peak. Across California, not only is the increase in higher-elevation SWE apparent, but the increase in the extent of the snowpack across lower elevations should also be noted, indicative of the colder storms that impacted the area. This data is provided by the National Operational Hydrologic Remote Sensing Center (NOHRSC).
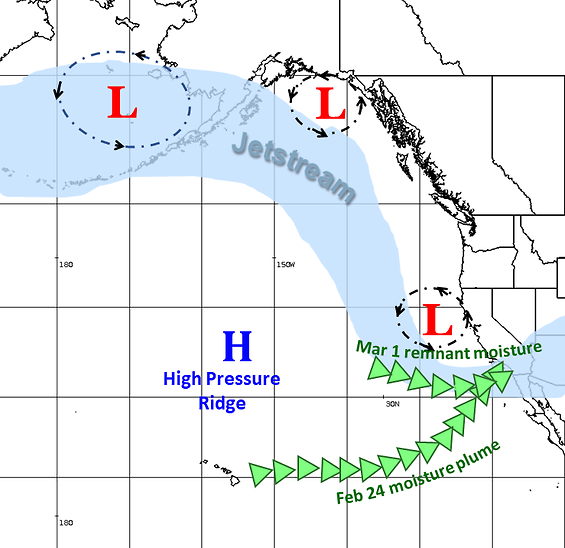
Overview Winter 2022-2023 for California and Nevada was among the top-ten wettest on record as storm after storm hammered the region from December through March. At one stretch, nine atmospheric rivers moved across CA in a period of only three weeks from late December through mid-January, causing widespread flooding and landslides (Dec/Jan Storm Summary). This winter also saw three low-pressure systems undergo rapid intensification known as bombogenesis, two of which occurred one week apart in late March. This summary is broken up to cover the storms in December/January and February/March. Each page is then sectioned to focus on time periods during which either one or a series of events impacted the region. This portion will cover February and March. February 24 (Fri) - March 1 (Wed), 2023 After a brief break in more notable weather activity, two systems impacted CA in the last week of February. Both of these arrived from the Gulf of Alaska and were colder in nature than most of the January systems. This resulted in low snow levels and widespread accumulating mountain snow in addition to heavy rainfall. Cold Upper Low Feb 24-25: The first system to kick off this wet period was a cold surface and upper low that approached from the Pacific Northwest (also referred to as PacNW in this summary). Flow ahead of the low shifted to a west/southwest direction, increasing Pacific moisture brought into the coast. Precipitable water (also referred to as PW in this summary) values of nearly 0.50” were observed over portions of the coast and advected inland towards the western slopes of the Sierra. This brought in widespread precipitation Thursday night into Friday morning, particularly across the Central Valley and into the foothills. Morning 12z soundings also recorded low freezing levels of 500 to 4,000 feet, allowing snow to fall across lower elevations. The low then traveled southward off the northern CA coast, reaching Sonoma County in the afternoon as precipitation continued to progress across northern/central CA. PW values increased throughout the day as the surface low pulled a weak tropical moisture plume into southern California (also referred to as soCal in this summary). Values were measured at nearly an inch in the evening, allowing precipitation intensity to pick up. Heavy precipitation shifted focus into soCal in the evening/overnight, benefiting from favorable upslope conditions into the coastal mountains as the upper low neared Point Conception Saturday morning. Low-level flow was recorded out of the south at 50 kt at 850 mb, veering out of the southwest aloft early Saturday. This continued to produce upslope conditions over the eastern San Gabriel and San Bernardino mountains. The low finally ceased its southward progression and began to push inland later Saturday. As the system moved eastward across southern CA Saturday, moisture aloft was funneled into soCal to the south and east of the low, while the southern Sierra and southern NV benefitted from diffluent flow aloft. This acted to enhance precipitation across those locations. The upper low finally began to exit the region to the east Sunday morning, bringing an end to the heavy precipitation across southern CA/NV. The heaviest precipitation over this time period fell across the Transverse Ranges and southern Sierra at 2-10”, locally up to 12”. Numerous daily records were broken again, seven of which were monthly records for February in CA and one in NV. There were also three all-time daily records set across CA at Corcoran (3.10”), Hanford (2.49”), and Kettleman City (2.27”). This heavy rain resulted in numerous reports of roadway flooding and mudslides. As mentioned above, this was a colder system, resulting in snow levels roughly 1,000 to 5,000 feet and generating snow totals from a few inches to as much as 1-3 feet in just 24 hours across the Sierra and San Bernardino/San Gabriel mountains. It also produced strong wind gusts ranging from 45-75 mph, causing downed trees and power outages. The next cold system was on the way and was expected to impact the region early to mid week. Cold Surface Low/Upper Shortwave Feb 27-Mar 1: The next system approached from the Gulf of Alaska and the PacNW as a surface low and upper shortwave. This would be a colder system once again, with about 0.50” PW or so ahead of the main surface cold front. The shortwave and cold front also again produced prolonged orographic enhancement from favorable 700 mb winds along the western slopes of the Sierra out of the SW to WSW at 30-50 kt. The cold front moved through on Monday the 27th, reaching the Bay Area later in the morning and then the Central Coast in the afternoon, bringing widespread precipitation across northern/central CA. The upper shortwave was offshore of the PacNW Tuesday morning, strengthening throughout the day and allowing showers to continue and intensify before the system began to move inland. Heavier precipitation shifted focus across the southern Sierra and Transverse Ranges overnight as the trough traveled inland across central CA and closed off into an upper low. Lower freezing levels allowed much of that precipitation to fall as snow across the mountains, with profiler data and observations showing snow levels between 1,000 to 4,000 feet. On Wednesday the 1st, the surface and upper low reached soCal as showers rotated around the low into southern CA/NV. Thunderstorms also developed near the core of the low. The system exited to the east into AZ in the evening as an upper ridge began to build in behind it. Between February 27 and March 1, generally 1.50-5” of precipitation fell across CA. Much of this fell as snow over the mountains thanks to lower snow levels. Snow totals ranged from 5” to 1.5 feet, with higher peaks over the Sierra receiving 2-3+ feet. Three-day totals of 67” accumulated at Kirkwood, 83” at Soda Springs (42” of which fell in only 24 hours), and 87” (>7 feet) at the Central Sierra Snow Lab. SWE across the state remained 150% to over 200% of normal for the time of year. This system also generated strong wind gusts at 45-60 mph and over 80 mph for area peaks. These winds and thunderstorms resulted in numerous downed trees, while heavy precipitation caused roadway flooding. There was even a waterspout that briefly moved onshore to become a tornado on the 27th near Shelter Cove in Humboldt County. For the past week (approx 2/24-3/1), CA reported generally 3-8” of precipitation with 10-15+” of liquid equivalent across parts of the Sierra and Transverse Ranges. The colder nature of these systems caused dangerous amounts of snow to accumulate over the Sierra. The Central Sierra Snow Lab reported 142” (nearly 12 feet) of snow over a period of 7 days, with numerous other locations reporting at least 100” (over 8 feet) of snow in that time. The large amount of snow in a short duration was on top of an already well-above-normal snowpack. After these most recent two storms, heavy snow stranded residents in their homes and caused power outages, and roofs collapsed from snow load. Images and videos from residents showed snow burying street signs and houses. There was a brief break in activity the next couple of days before additional cold, but weaker, systems moved across the region over the weekend and into early the following week. This added several inches up to over a foot of additional snow to the region. The next round of big storms would arrive mid-March. March 9-16 (Thu-Thu), 2023 After a series of colder weather systems that added a decent amount of snow to the area's mountains, the pattern shifted back to storms fed by warmer tropical moisture. For the next week, a pair of ARs would impact an already-soaked CA/NV, causing additional flooding. Snow would continue to pile up above 7,000 to 8,000 feet, while areas that saw low-elevation snow in previous weeks experienced some melt due to warmer rainfall. AR Mar 9-11: Mid-week, a pair of troughs, one over the central Pacific and the other just offshore of the western United States, pinched off a narrow upper ridge between 140W and 150W, increasing moist southwest flow over the eastern Pacific. This allowed an elevated moisture plume of nearly 2” PW to head towards the CA coast. The low continued to spin off the coast of the PacNW Thursday morning, while the moisture plume (now 1.5” PW) made its approach. The plume reached the coast in the afternoon, spreading itself across CA from Cape Mendocino to Point Conception. This moisture expanded inland into the Central Valley while gradually shifting to the south. Friday morning (10th) the plume shifted focus from the Bay Area into soCal, while a front moved across NE CA and the Bay Area. At the same time, the offshore upper low began to move into the PacNW. This produced moderate to heavy rainfall near the moisture plume and allowed thunderstorms to develop behind the front. Tropical moisture traveled southward across the state the rest of the day as the overall flow gradually shifted to a more westerly direction. This occurred as the main moisture plume became focused over soCal overnight, acting to diminish orographic effects in the Transverse Ranges. This limiting effect continued for Saturday morning as well, though precipitation was still falling across southern CA. Favorable upsloping persisted over the Sierra, however, as moisture lingered over much of the region, allowing precipitation to continue even after the moisture plume had passed. Another weaker moisture plume then approached northern CA as it was drawn from offshore by the southern end of an upper low in the Gulf of Alaska and the near zonal 500 mb height pattern that remained from HI to CA. Showers and thunderstorms hung around for northern/central CA the rest of the day. The majority of the precipitation for Saturday fell across the Sierra, with lesser amounts along the northern/central CA coasts. The system also produced thunderstorms across the region. From the 9th to the 11th, 1.5-4” of precipitation fell across the North Coast, 1.3-4.50” over the Bay Area, 3.25-13” for the Central Coast, 4-12.75” along the Sierra, and 1.2-3.50” across the Transverse Ranges. This resulted in 45 broken daily precipitation records in CA (4 monthly) and 23 in NV (2 monthly). Initial snow levels were around 8,000 to 10,000 feet, falling to 1,500 to 6,000 feet, allowing snow to accumulate again for area peaks. Snow amounts ranged from as little as a dusting to as much as 1.5 feet. Additionally, this system produced thunderstorms and strong winds at 40-60+ mph across lower-elevation areas and up to 80+ mph in the mountains. A gust of 102 mph was recorded at Mammoth Mountain. The result was more downed trees and powerlines as well as roadway flooding and mudslides/debris flows from heavy rainfall. Moisture from this system lingered over most of CA on Sunday as Total Precipitable Water (also referred to as TPW in this summary) imagery measured 0.5-1” PW across much of the state. This, in combination with an offshore warm front, allowed precipitation to continue the rest of the day, mainly for northern CA and the northern Sierra. The result was an additional 1-2.50+” across the Sierra and 0.10-1” over the rest of the state. AR Mar 13-15: The next round of tropical moisture approached Monday from the southwest, originating near HI as it was pulled towards southern CA by a surface low and upper trough. The initial moisture landed Monday afternoon before the main plume arrived early Tuesday morning (14th), funneling moisture between Cape Mendocino and Point Conception. PW values in the moisture plume were between 1.25-1.33” Tuesday morning, bringing broad areas of precipitation to northern and central CA. The surface low and upper shortwave reached the North Coast in the afternoon. This allowed low-level flow to develop out of the south to southeast, providing upslope conditions into the western half of the Shasta Lake drainage as well as the west side of the coastal mountains. As the moisture moved into central CA, the Santa Lucias inland towards the southern Sierra became the beneficiaries of favorable mid-level southwest winds, resulting in upsloping into the afternoon. The moisture plume then entered southern CA not long thereafter. The result was two areas of moderate to heavy precipitation, one over the North Coast thanks to the surface low and upper shortwave, and the other over southern CA from Point Conception to the Mexico border due to the tropical moisture plume. The only mechanism to potentially dampen precipitation was a dry slot that developed offshore early Tuesday morning before moving across the Bay Area and inland in the afternoon. This led to a considerable drop-off in precipitation across central CA. However, in the late afternoon/early evening, a convective line developed near Redding southward to Red Bluff, dropping 0.75-1.50” of precipitation in a span of a few hours as it moved to the east. Another convective line was also present around Los Banos northeastward into Tuolumne County moving to the southeast. Both of these dropped heavy precipitation that caused rises on the upper Sacramento River, with multiple locations reaching flood stage that evening. Decent moisture remained over the area the rest of the afternoon and overnight. The 00z soundings at KVBG - Vandenberg and KNKX - San Diego measured PW of 1.07“ and 1.18” respectively, ranking 7th in the top PW values for March. TPW satellite overnight showed 1.1” of PW still over soCal from Point Conception down to the Mexican border. The upper shortwave moved across northern CA Tuesday night into Wednesday morning, allowing upslope showers to continue along the Sierra as additional thunderstorms developed across the region. The moisture plume shifted southward across soCal overnight as well, finally exiting the region through Wednesday morning, while another shortwave traveled across soCal. This kept precipitation going across southern CA through much of the day. For this system, Monday through Wednesday precipitation totals were as follows: 2.2-6.50” along the North Coast, 0.70-3” over the Bay Area, 1.50-6.75” for the Central Coast, 2.3-8.20” across the Sierra, and 3-6.50” for the Transverse Ranges. This broke 57 daily precipitation records across CA (4 monthly) and 11 in NV. Snow levels ranged from 4,500 to 9,500 feet throughout the life of this event, again bringing additional snow to the mountains. Snow amounts over 24 hours ranged from 3-14”, with some areas receiving two to three feet in only a few days. This was another system that generated strong winds. Gusts were measured at 40-60 mph and over 80 mph again in the hills. The combination of heavy rain and strong winds resulted in widespread flooding, debris flows, and downed trees. Over this week-plus stretch (8th-16th), the Sierra received 6-16” of precipitation, with amounts elsewhere as follows: 7-12” North Coast, 3.50-9” Bay Area, 10-17.5” Central Coast, and 3.50-6.50” for the Transverse Ranges. Much of this fell as snow above 7,000 to 8,000 feet, with statewide SWE between 170% and 270% of normal across CA by mid-March. There was another brief break in storms through the weekend before additional systems arrived the last week of March. March 21-30 (Tue-Thu), 2023 The end of March proved that winter would not go quietly, as CA experienced another AR in addition to two low-pressure systems that underwent rapid intensification, known as "bombogenesis", in just a week. This brought more heavy rain and mountain snow to the region, resulting in additional flooding. These systems also generated strong winds and thunderstorms that caused more damage to an already fatigued region. Mar 21-22 AR/Bomb Cyclone: On Monday the 20th, a cold surface/upper low could be seen approaching the west coast. This system tapped into a subtropical moisture plume of about 1.3” PW that reached southern CA in the late afternoon. The stacked surface and upper low arrived offshore of central CA by the early morning of the 21st. Overnight, the surface low strengthened from 1005 mb at 00z the 21st to 986 mb at 18z. Thunderstorms then developed near the core of the system offshore as a now 1” PW plume of moisture funneled into southern CA. This generated two areas of widespread precipitation: one north of Point Conception to the Bay Area due to the surface/upper low, and the second over coastal southern CA due to the tropical moisture. The low rotated in place offshore of central CA the rest of the day while continuing to strengthen, reaching a minimum central pressure of 984 mb at 00z. San Francisco International Airport's (SFO) sea-level pressure measurement that day, also at 984 mb, was the lowest recorded pressure for the airport in the month of March. The largest 24-hour drop in pressure was captured by the Monterey Bay Buoy, where on the 20th at 1930 local time, the buoy measured 1014 mb before lowering to 985.6 mb 24 hours later. This pressure drop in 24 hours was enough to consider this low a “bomb cyclone” given its rapid intensification. The moisture plume began to move out of soCal later Tuesday morning; however, the presence of the low provided favorable southwest flow into the coastal mountains, generating additional upslope precipitation. Meanwhile, the low continued to push precipitation into the Central Coast and Bay Area as it remained just offshore. This system also generated thunderstorms and gusty winds. Observations showed widespread gusts of 40-50+ mph and 60-70+ mph gusts over the hills. A gust of 72 mph was even reported at KOAK - Oakland in the afternoon. As the surface low rotated offshore just south of the Bay Area in the afternoon, radar imagery captured two mesocyclones rotating around one another. The first was just southwest of Santa Cruz, and the second was further offshore. The easternmost mesocyclone moved right into Santa Cruz, producing strong winds and causing damage. Mesonet sites near Boulder Creek recorded gusts of 60-65 mph, and numerous reports of downed trees and power lines were also noted across the Santa Cruz area. One tree fell, hitting a home and vehicle and injuring one person. 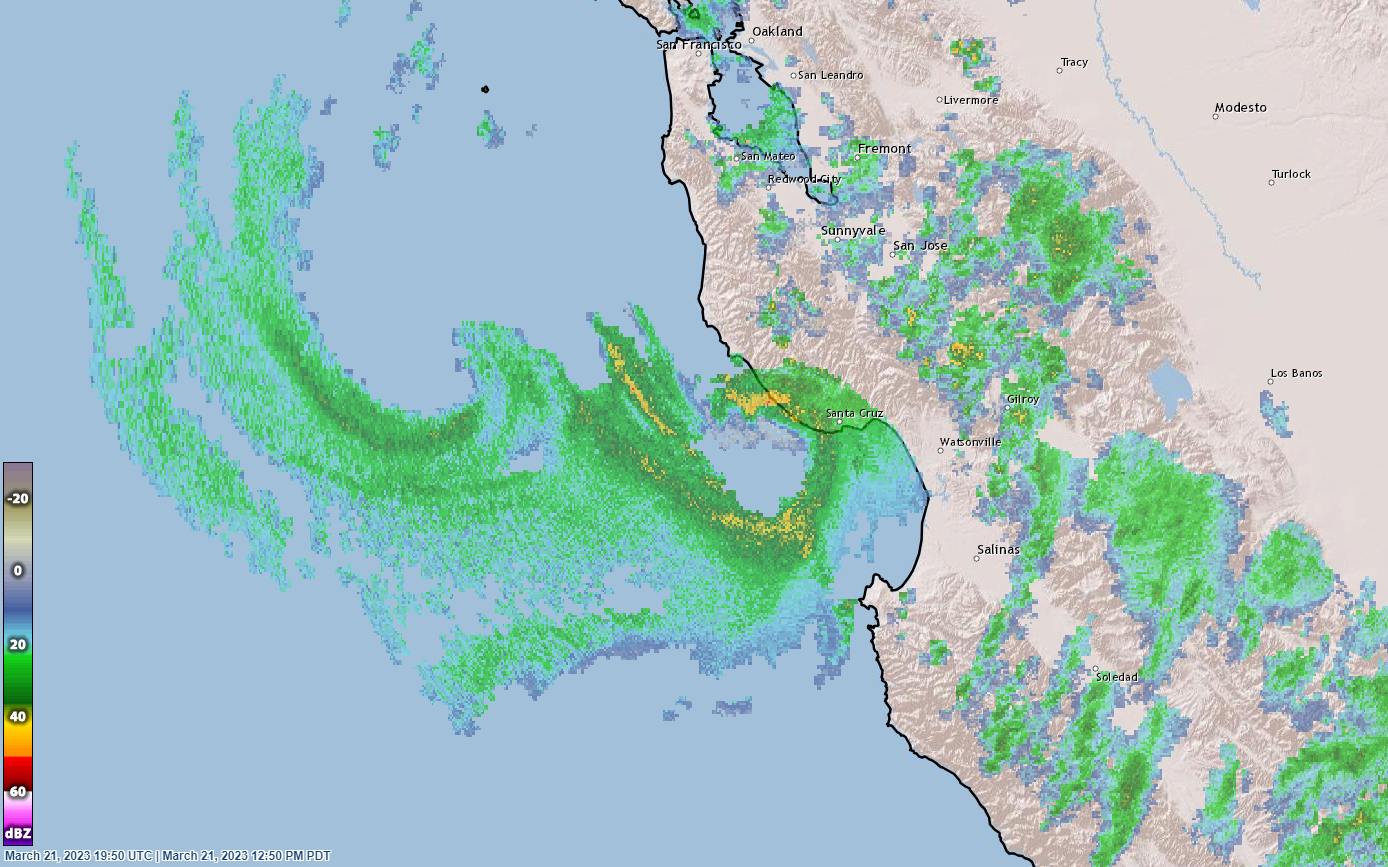 Later Tuesday afternoon, southern CA was aided by a 120-130 kt jet streak, adding dynamic support to the already-favorable flow pattern. One thunderstorm outside of Santa Barbara produced an EF-0 tornado, damaging 25 mobile homes with an estimated peak wind speed of 75 mph. Farther to the south, two narrow cold frontal rainbands (NCFRs) developed, one moving across San Diego in the morning (left) and a second in the evening (right). NCFRs are known for dropping heavy precipitation over a relatively short duration. 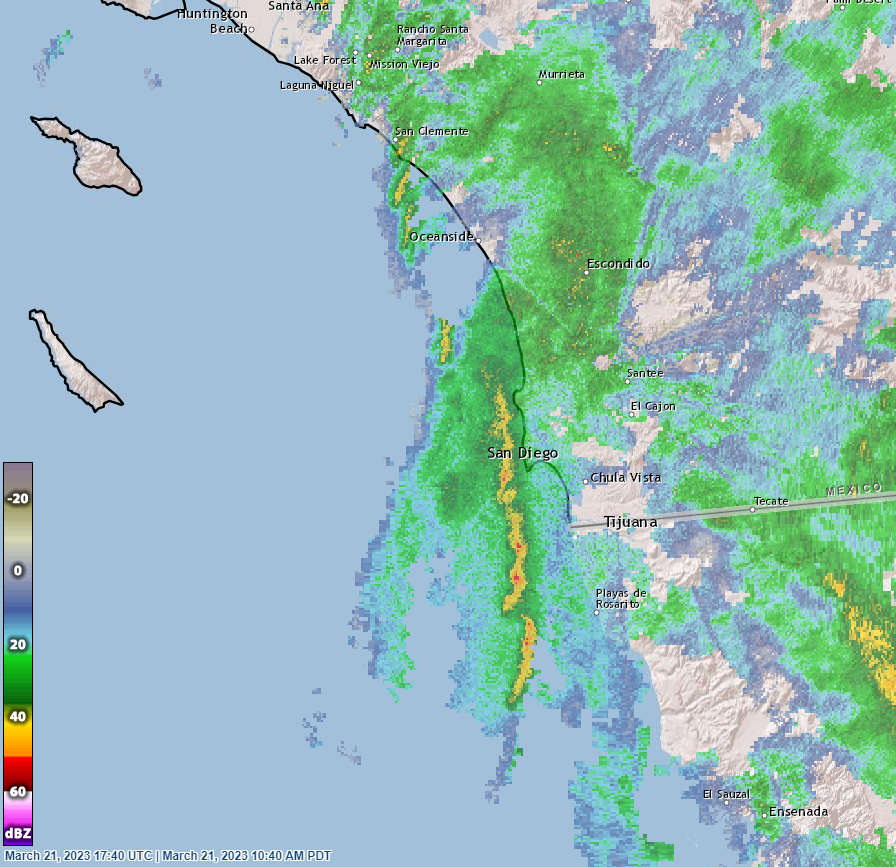 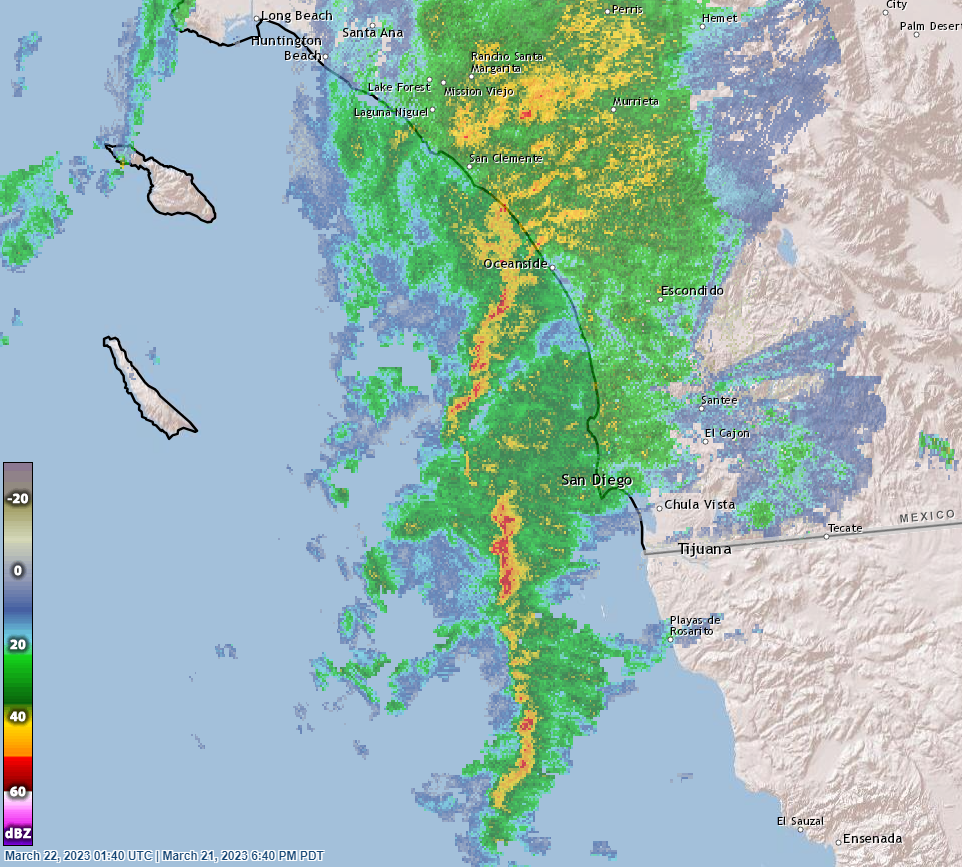 The surface low began to weaken by early Wednesday after the upper-level system had moved over CA. The surface low then slowly moved to the south just off the coast the rest of the morning before finally pushing inland and weakening in the afternoon. However, the system continued to generate thunderstorms, one of which produced an EF-1 tornado in Montebello (near LA) that generated peak winds estimated at 110 mph and damaged 17 structures while also injuring one person. Monday through Wednesday, approximately 1-5” of precipitation fell along the coast from Sonoma County through San Diego County, with 1-3” across the Sierra as well. This broke 48 daily rainfall records in CA, 9 in NV, and one monthly record in each state. The cold nature of this system resulted in lower snow levels at about 2,500 to 5,500 feet, generating 1-3 feet of snow in the Sierra and Transverse Ranges. Heavy rainfall led to numerous reports of flooding, rising streams/creeks, and mudslides necessitating multiple water rescues. Strong winds across the region caused damage and downed trees, which were responsible for at least five fatalities around the Bay Area. Thunderstorms generated two tornadoes over southern CA, causing damage and injuries. In less than a week, another low-pressure system would undergo rapid intensification and again impact CA. Mar 28 Bomb Cyclone: The next system approached from the Gulf of Alaska drawing on an area of elevated moisture at 1” PW over the eastern Pacific near 140W. The low combined with another to its SW before deepening as it headed ESE towards the OR coast. Like the one the week prior, this low underwent a rapid intensification from 1006 mb at 12z on the 27th to 980 mb 18 hours later. The surface low remained offshore of the OR Coast the morning of the 28th, bringing a front to the North Coast and out into the Pacific. An upper low sat just above its surface counterpart. TPW satellite imagery showed nearly 1” PW offshore ahead of the main front as precipitation moved into central CA across the I-80 corridor. The cold front traversed CA the rest of the morning as the surface low slowly moved southeastward towards northern CA, spreading more moderate precipitation across the state. The low arrived near the CA/OR border later in the afternoon, while the cold front continued its march across northern CA, producing moderate precipitation ahead of the front and scattered showers/thunderstorms behind it. This storm also produced strong wind gusts at 50-60 mph at lower elevations and 80-100 mph in the mountains. A gust of 51 mph was recorded at KOAK - Oakland. These winds caused additional downed trees/power lines across northern/central CA Tuesday, while rain caused flooding and landslides. This system was a colder one once again, with snow levels ranging from 2,500 to 7,000 feet, resulting in additional heavy snow for the Sierra. For Tuesday, 1-3” of precipitation fell across CA, with the Sierra reporting roughly 12-30” of snow. The system moved very slowly overnight, only reaching Cape Mendocino early Wednesday morning. At that time, the cold front made its way into central NV and across southern CA. The low traveled southward along the northern CA coast the rest of Wednesday, dropping scattered showers and thunderstorms across the region. The system weakened as it traveled, finally opening up into a trough and moving onshore near the Central Coast overnight. The system headed southeast across CA the rest of Thursday before exiting into the Four Corners in the evening. As it passed through, showers and thunderstorms continued mainly over the San Joaquin Valley, southern Sierra foothills, and southern CA. Wednesday and Thursday saw another 0.75-2.50” of precipitation fall, mainly across the coastal mountains and the Sierra. This caused additional urban-area flooding and mudslides as well as downed trees and powerlines. There were reports of damage to homes from winds in San Diego County. An avalanche was even reported in the southern Sierra in Inyo County that forced a road closure. Throughout the duration of this storm, 68 daily rainfall records were broken in CA and 13 in NV. The last week and a half of March saw 1-4” of precipitation across the lower elevations of CA/NV and 4-9” in the mountains, much of which fell as snow. These heavy rains caused widespread flooding, debris flows, and landslides. Strong winds and thunderstorms resulted in downed trees and power lines that caused damage to homes and vehicles. The first of these bomb cyclones was responsible for at least five fatalities due to fallen trees amid strong winds. Summary The final bomb cyclone in late March marked the end of a long, wet winter across CA and NV. February and March saw multiple cold systems drop feet of snow over the mountains, three atmospheric rivers, and two bomb cyclones a week apart. This added an additional 10-30+” of precipitation along the CA coast and across the Sierra. These storms caused widespread flooding, debris flows, downed trees, and power outages. There were also NCFRs, tornadoes, and even an avalanche. The February storms left residents stranded in their homes, buried road signs, and caused roof damage as over 100” of snow fell in only 7 days. After three dry winters in a row, December through March of 2023 was CA’s seventh-wettest winter season since 1895 and third wettest for NV. The CA coast received between 40” to over 100” of precipitation for the water year by the end of March, while the Sierra saw 30” to just under 100” of liquid equivalent. The highest precipitation amount was over the Big Sur coastal mountains at Three Peaks (105.8”). At the end of the winter, most of CA was between 100-300+% of normal. So much rain fell that Tulare Lake in the San Joaquin Valley, which was converted to farmland in the early 20th century and therefore typically dry afterwards, was covered in water. Agricultural fields near Corcoran were covered in water, flooding homes and causing road closures. These systems also dropped feet of snow across the mountains in short durations repeatedly throughout the winter. Several stations reported season snow totals of over 650” (>50 feet) at the end of March. The snow survey done by the CA Department of Water Resources in early April measured one of the largest snowpacks ever observed at 126.5” (54” SWE), which was 221% of average for the date. Statewide, the SWE was 61.1” or 237% of average. This winter’s storms caused widespread urban and river flooding that prompted evacuations/rescues, accumulating heavy mountain snow, debris flows, numerous downed trees/power lines damaging property, and multiple tornadoes. This all resulted in at least 22 fatalities in total for the winter season (Dec-Mar). That wraps up a historic winter season for the region that will not soon be forgotten. Weather Graphics
The table below provides links to atmospheric soundings across the region during each storm event period for February and March. The end of February systems were colder compared to the warm atmospheric rivers impacting the region in January. This resulted in lower freezing levels of generally 1,000 to 5,000 feet, reaching a minimum of 500 feet on February 24th. The final cold low in late February also benefited from strong 700 mb winds along the western Sierra slopes out of the SW/WSW at 30-50 kt. Freezing levels increased for the March systems due to access to tropical moisture averaging 7,000 to 11,000 feet when the moisture was overhead, then dropping down to 2,000 to 6,000 feet behind the moisture and during cooler systems.
The table below contains links to snow level plots from vertically-pointed radars, used to determine the bright-band location (where precipitation transitions from frozen to liquid). Snow level radar loops are provided during each storm period for February/March. During the colder February systems, snow levels were about 1,000 to 5,000 feet. These storms dropped feet of snow across the mountains in only a couple of days, with nearly 12 feet of snow reported in the last week of the month at the Central Sierra Snow Lab. The mid-March storms were warmer ARs with snow levels of 7,000 to 12,000 feet, dropping down to 2,000 to 6,000 feet behind the moisture plumes. The bomb cyclones at the end of March saw snow levels roughly 2,000 to 6,500 feet. All of these resulted in additional snow accumulations on an already above-normal snowpack which ended the winter season 221% of average.
The table below provides links to 6-hourly NCEP/NCAR Reanalysis data composites at different levels of the atmosphere during the February and March storm events. This also includes departure-from-normal imagery.
The table below links to infrared and precipitable water imagery at 1-hour intervals during the storm events of February/March. The infrared satellite imagery shows the colder cloud tops during periods of heavy precipitation. The precipitable water imagery shows the origins of the tropical moisture plumes that were funneled into the region as well as the evolution of the moisture as it drew nearer. In many cases, low-pressure systems picked up tropical moisture on their way to the west coast.
The links below lead to loops of National Weather Service (NWS) radar data covering the California-Nevada River Forecast Center (CNRFC) service area during each storm event in February and March. Each image contains a radar mosaic made from individual radars across the region at the top of the hour.
Overview The greatest hydrological impacts from the storms described above centered again in central California in the form of an increased threat of flooding. The following hydrology discussion covers the flooding across the Pajaro River and Salinas River along coastal California, and Tulare basin across the southern Sierra. One particular long-term impact from the heavy precipitation was the near-record snowpack across the southern Sierra, which resulted in spring and early summer reservoir releases that brought the reemergence of Tulare Lake, now usually a dry lake due to diverions of water for agriculture and municipal use. Salinas River Summary Storms in early March brought additional major impacts across the Salinas basin. Observed precipitation on March 9-10 exceeded the forecast, leading to river stages exceeding flood stage. Below is the March 9 morning forecast for the Salinas River at Paso Robles. The San Luis Obispo station received over 3" on March 10, about half as much as in January. The river crested above flood stage, but a slight bit lower than the January event. Click on the image below to enlarge and open in a new tab. 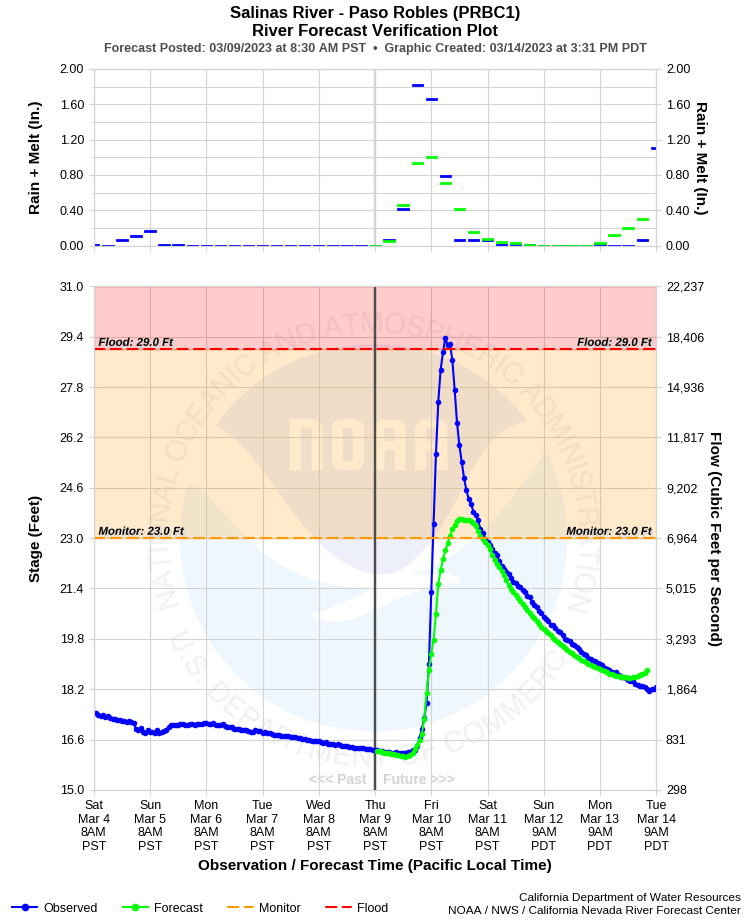 The channel losses due to dry soils and a low groundwater table were not as significant compared to what was observed in January. Lower peaks at Chualar likely resulted from a levee breach, which allowed water to escape the river's main channel before re-entering upstream of the gauge at Sprekels. The economic impact (primarily agriculture) from the January and March flooding along the Salinas was significant. Local officials estimated the damage to be roughly $1 billion. The Monterey County Farm Bureau estimated that the area damaged by the floods was around 15,000 acres. Pajaro River Summary The March event on the Pajaro system was larger than what was observed in January. The substantial volume losses observed in January did not happen in March. The forecast and observed peak stage/flow at Chittenden matched well. Below is a graphic showing the morning forecast on March 9th and the observed river stages (blue line). Click on the image below to enlarge and open in a new tab. 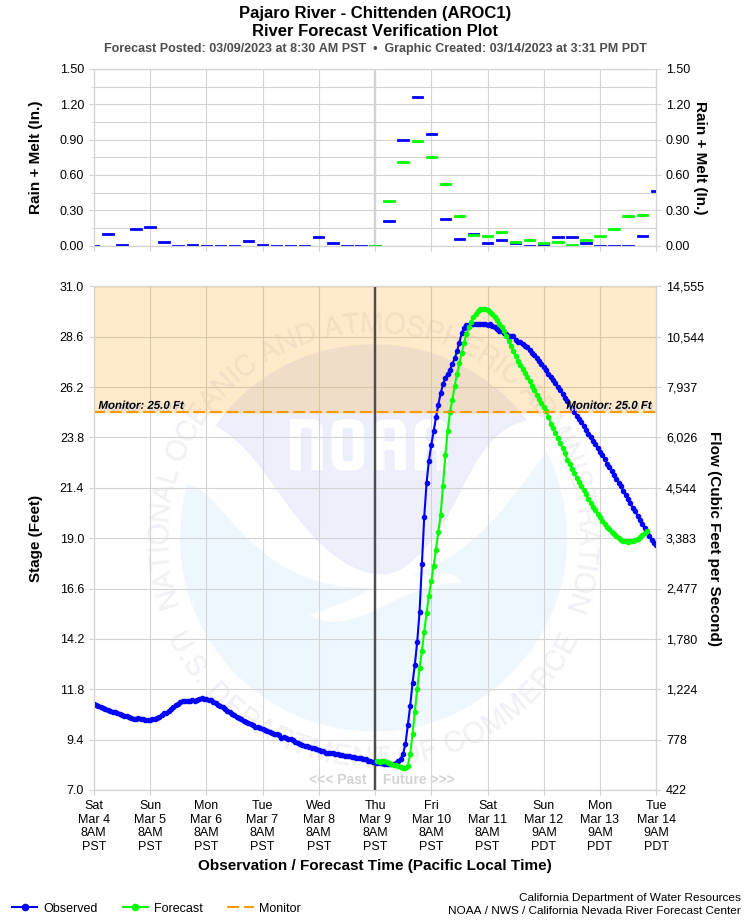 The March event saw higher stages at Chittenden. The larger amount of water being pushed through the system unfortunately put too much stress on the downstream levee system. A levee breached around midnight on March 10 near the township of Pajaro. While the Salinas flood damage was primarily agriculture related, the Pajaro flooding impacted many structures. Cal Fire determined some level of damage in 400 buildings. Tulare Basin Summary Antecedent Conditions The winters of Water Years 2020-2022 were exceptionally dry in the Tulare basin, with average April 1 SWE only slightly higher than those of WY 2013 and 2014. The California Department of Water Resources’ 6-Station Index in the Tulare recorded 22% of average precipitation in WY 2022, the second-driest year on record. In addition, numerous wildland fires combined to burn nearly 13% of the Tulare basin, almost entirely in the Kaweah, Tule, and Kern basins, from WY 2020-2022. March 1 snow course measurements were approximately 200% of average across the basin. Snow depth at the lowest-elevation course (Giant Forest, 6400’) was the lowest value recorded, yet still 61” with 23” measured snow water content. Visual assessment in areas slightly removed from the official measurement site reported localized snow 12-15’ deep. Basin-wide, only two other courses reported less than 100” of snow, though many points in the Tulare were inaccessible for the March measurement. In addition, precipitation had fallen across at least part of the Tulare on 10 of the 14 days preceding March 10. Forecast CNRFC forecast precipitation consistently increased leading up to the storm on the evening of March 9. Near or greater than 1” of precipitation was predicted at most locations for 4 consecutive 6-hour periods, beginning at 00Z on March 10. The heaviest amounts were expected between March 10 at 06Z and March 11 at 00Z and skewed away from the Kern River basin. Above the Kaweah at Three Rivers (KTRC1), the 24-hour forecast was 8.5”, 1.5” more than any other point. The March 10 06Z forecast indicated over 60,000 cfs peak inflow at Pine Flat and Terminus reservoirs, and over 40,000 at Success and Isabella. These would have ranked as the 4th- and 2nd-largest peak inflows ever recorded at the former and latter pairs respectively, with each reservoir already encroached on conservation space. Total volume over the course of the storm suggested the potential for spill at Terminus and Success despite each reporting approximately 30% capacity on March 9. Fresno, Tulare, and Kern counties, as well as the National Park Service (NPS) in Sequoia National Park, issued evacuation warnings in the days leading up to the storm. Kern County would upgrade to evacuation orders for low-lying areas in the community of Kernville. In the Lodgepole area of Sequoia National Park, crews abandoned plowing roads in favor of protecting structures. Impacts The largest of the storm’s impacts were felt in the 3 southern basins due in part to the storm’s centering and the largely unpopulated upper portions of the Kings River basin. CNRFC estimated 48-hr, basin-averaged precipitation totalled 6.5” to 6.75” across the 3 northern basins, and just over 4” in the Kern. In the higher elevations, these values were as much as 3” less than forecast. Peak inflows were accordingly much lower, yet still ranked as described in the table below.
Sequoia and Kings Canyon national parks closed to public visitation several days in advance of the storms and would remain so until April 7 (Kings Canyon) and 14 (Sequoia). The Generals Highway in Sequoia sustained damage severe enough that large portions remained closed until July 1, while major parts of California Highway 180 and Mineral King Road remained closed for the remainder of 2023. Several wilderness foot bridges in Kings Canyon were also destroyed. Above Terminus in Three Rivers, several roads and bridges washed out. Terminus and Success would both spill in the days shortly after the storm. Road damages across Tulare County are estimated to total more than $45M. Above Isabella, Kernville saw extensive flooding, and in the days after the storm, another evacuation order was issued just downstream in Wofford Heights, this time in anticipation of landslides. Above Terminus Dam, the Kaweah is an undammed wilderness river with a drainage basin in elevation from over 12,000 feet in the Sierra to 560 feet at the dam. It has been suggested to be the steepest river in the United States, dropping over 11,000 feet in 33 miles, with an average gradient of about 340 feet/mile. Only in the lower reaches in the town of Three Rivers is there any true floodplain along the mainstem Kaweah River. Upstream, the river channel is deeply entrenched and flows are largely unable to escape or attenuate. In addition, nearly one third of the basin burned in the fall of 2021, primarily below 8,000 feet. Of that area which burned, over 38% was classified moderate or severe burn and killed hundreds to thousands of Giant Sequoia trees. A single mature tree will take up approximately 500 gallons of water daily. No major precipitation fell on the burn scar until the storms of January 2023. The exceptional snowpack above 5,000 feet had been assumed charged for rain-induced melt. The 3 factors combined could have combined for much higher flows. Instead, the snowpack, even in the lower elevations, seemed to have absorbed a large amount of rain and prevented large-scale runoff atop most of the burn scar. However, flow data and physical observations along the Kaweah still raise questions. Low-elevation rain around Three Rivers resulted in flood waters overtopping roads by 7:30 AM PST on March 10 in areas which never flooded during the January storms. The U.S. Army Corps of Engineers (USACE) gage on the mainstem Kaweah at Three Rivers (KTRC1) reported a peak flow of 26,662 cfs at 8:00 AM while 42,660 cfs was recorded at Terminus Dam two hours later, five hours earlier than the peak at either Pine Flat to the north or Success to the south. All of the Kaweah’s major tributaries except the second smallest, the South Fork Kaweah, join the mainstem above KTRC1. A now-inactive USGS gage on the South Fork recorded a maximum inflow of 11,600 on December 6, 1966. Terminus saw a peak inflow of 105,000 cfs on the same day. Given the behavior of the rest of the basin, it seems unlikely that the South Fork would have reached the flow of record. USACE contractors investigated after the storm and found that the gauges underreported, but it is difficult to say what the actual peak flow may have been. The images below show immediate and lingering effects of the 2023 WY. Clockwise from top left, flooding at Kernville's Riverside Park (image courtesy Kern River Conservancy), undercutting along the Generals Highway (image courtesy NPS/M. Shaffer), flooding in Three Rivers on March 11, 2023 (image courtesy M. Messa), and snow at Timberline Lake on July 1, 2023 (image courtesy NPS/C. Gooch). 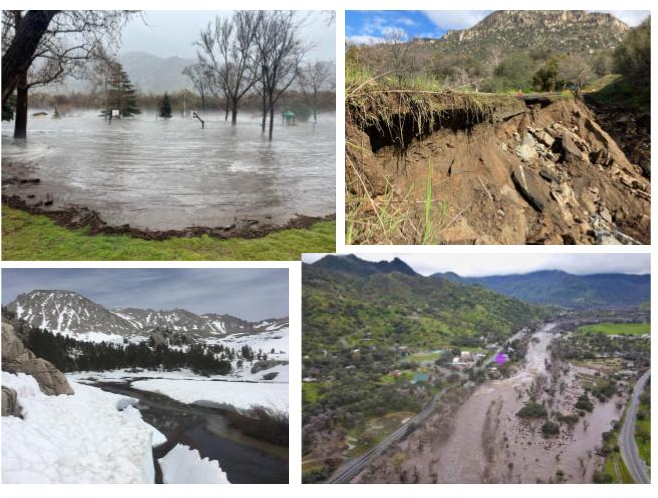 Long-Term Impacts No impact of the March storms has been more publicized than the resurgence of Tulare Lake. While not solely attributable to this event, the March 10 storm made the Lake’s return a near certainty. Inundation began only weeks later. Snow water content in the southern Sierra rose another approximately 25% to nearly 250% of normal. As late as July 4, wilderness staff at Sequoia National Park observed near 100% snow cover above 11,000 feet. At the same time, snow sensors in the Kings basin reported 20” - 50” across 6 sites over 9,500 feet, with each site reporting > 50% snow density. A manual survey conducted by the Kings River Water Association at Bench Lake produced similar results. Isabella and Pine Flat peaked at 97% and 98% capacity on July 24 and 25, respectively. Winter 2022-2023 QPF Verification Summary CNRFC meteorologists create gridded QPF out to 6 days with a temporal resolution of 6 hours. The CNRFC domain is divided into 17 river forecast groups (see image below showing the boundaries of each forecast group), with QPF and river forecasts issued at least once daily in the morning (12Z issuance) and also in the afternoon (18Z issuance) on weekdays during the winter operations season (November 1 through April 15) with additional forecasts issued on an as-needed basis. CNRFC hydrologists generate a gridded quantitative precipitation estimate (QPE) grid every morning by quality controlling observed precipitation data at just over 1,000 gauges located across the CNRFC domain. CNRFC QPE was compared to the CNRFC QPF, NBM (National Blend of Models), GFS (Global Forecast System), and WPC (Weather Prediction Center) for verification of the river forecast groups and individual stations for the period from December 1, 2022, through March 31, 2023. Verification statistics were created for the Mean Absolute Error (MAE), Root Mean Squared Error (RMSE), and Percent Bias (PBIAS) where the QPE was greater than 0.00". Heidke Skill Score (HSS) was also used to evaluate precipitation amounts. If QPE was greater than 0.00", and the QPF was within the thresholds of 0.10" for 6 hours, 0.25" for 24 hours, or 0.50" for 72 hours, then the event was considered successful and true. If the QPF and QPE difference was outside the thresholds, then it was a miss and would count negatively. The focus for the verification this winter will be on CNRFC river forecast groups for Days 1-3 QPF, Days 4-6 QPF, and comparing the morning (12Z issuance) vs afternoon (18Z issuance) CNRFC QPF, and looking at newly-deliniated River Forecast Groups for the 2023 WY. Click on the image below for a larger version. 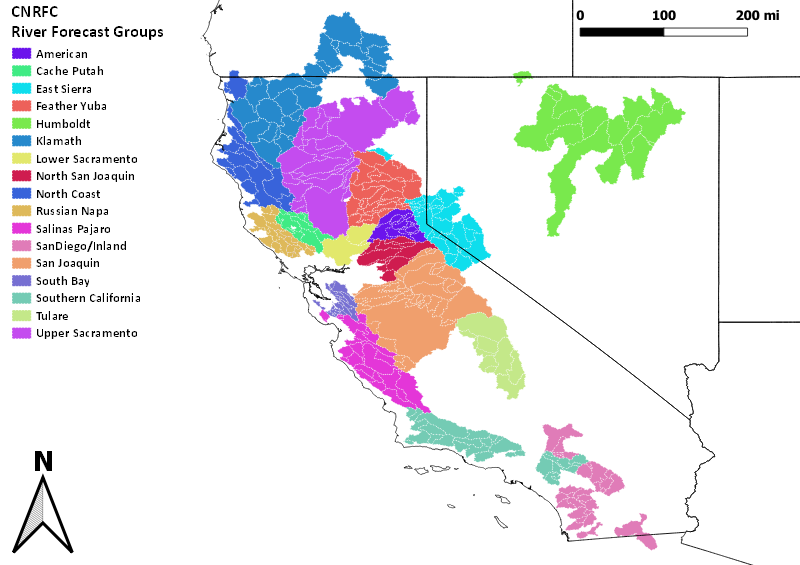 CNRFC River Forecast Groups: Days 1-3 Totals With three-day QPF totals useful to water resource managers, we will first look at the verification of the days 1-3 QPF. For all 17 river forecast groups, the NBM showed the most skill, using the HSS, compared to the CNRFC, WPC, and the GFS. The Humboldt forecast group showed the most skill for all sources with the GFS the least reliable. The Lower Sacramento forecast group came in second for the most skill, with the NBM and GFS showing more skill than the CNRFC and WPC. The GFS had the lowest MAE and overestimated the least in PBIAS. The Feather/Yuba river forecast group had the least skill and lowest HSS, with the NBM higher than the other sources, while also having the highest MAE. CNRFC and WPC overestimated QPF for all 17 river forecast groups, with the exception of a small under bias for the Southern California forecast group as seen in the PBIAS plot. The NBM and GFS showed underestimates in a few river forecast groups. These included Southern California for both the NBM and GFS. The Salinas/Pajaro showed an underestimate for the GFS. Also, small under bias was observed for the Russian/Napa, North Coast, and Tulare forecast groups in both the NBM and GFS, as well as the Salinas/Pajaro for the NBM, and South Bay for the GFS. In the East Sierra, all models highly overestimated in PBIAS. The NBM did the best in MAE and RMSE, but all sources were considered high. The Humboldt forecast group had the lowest MAE and RMSE (near 0) for all sources, while also slightly overestimating the QPF for PBIAS. The Feather/Yuba group had fairly high MAE and RMSE for all sources, but especially for the RFC and WPC. For the North Coast group, all sources had fairly high MAE and a little better RMSE, but the GFS performed the worst, while the CNRFC and NBM had little bias. The NBM and GFS showed a slight underestimate. The image below displays the 17 CNRFC river forecast groups' Mean Absolute Error (MAE) of QPF for four sources (12Z morning CNRFC, 12Z GFS, NBM, and WPC) versus the CNRFC QPE from December 1, 2022, through March 31, 2023. Click on the image below to enlarge and open in a new tab. 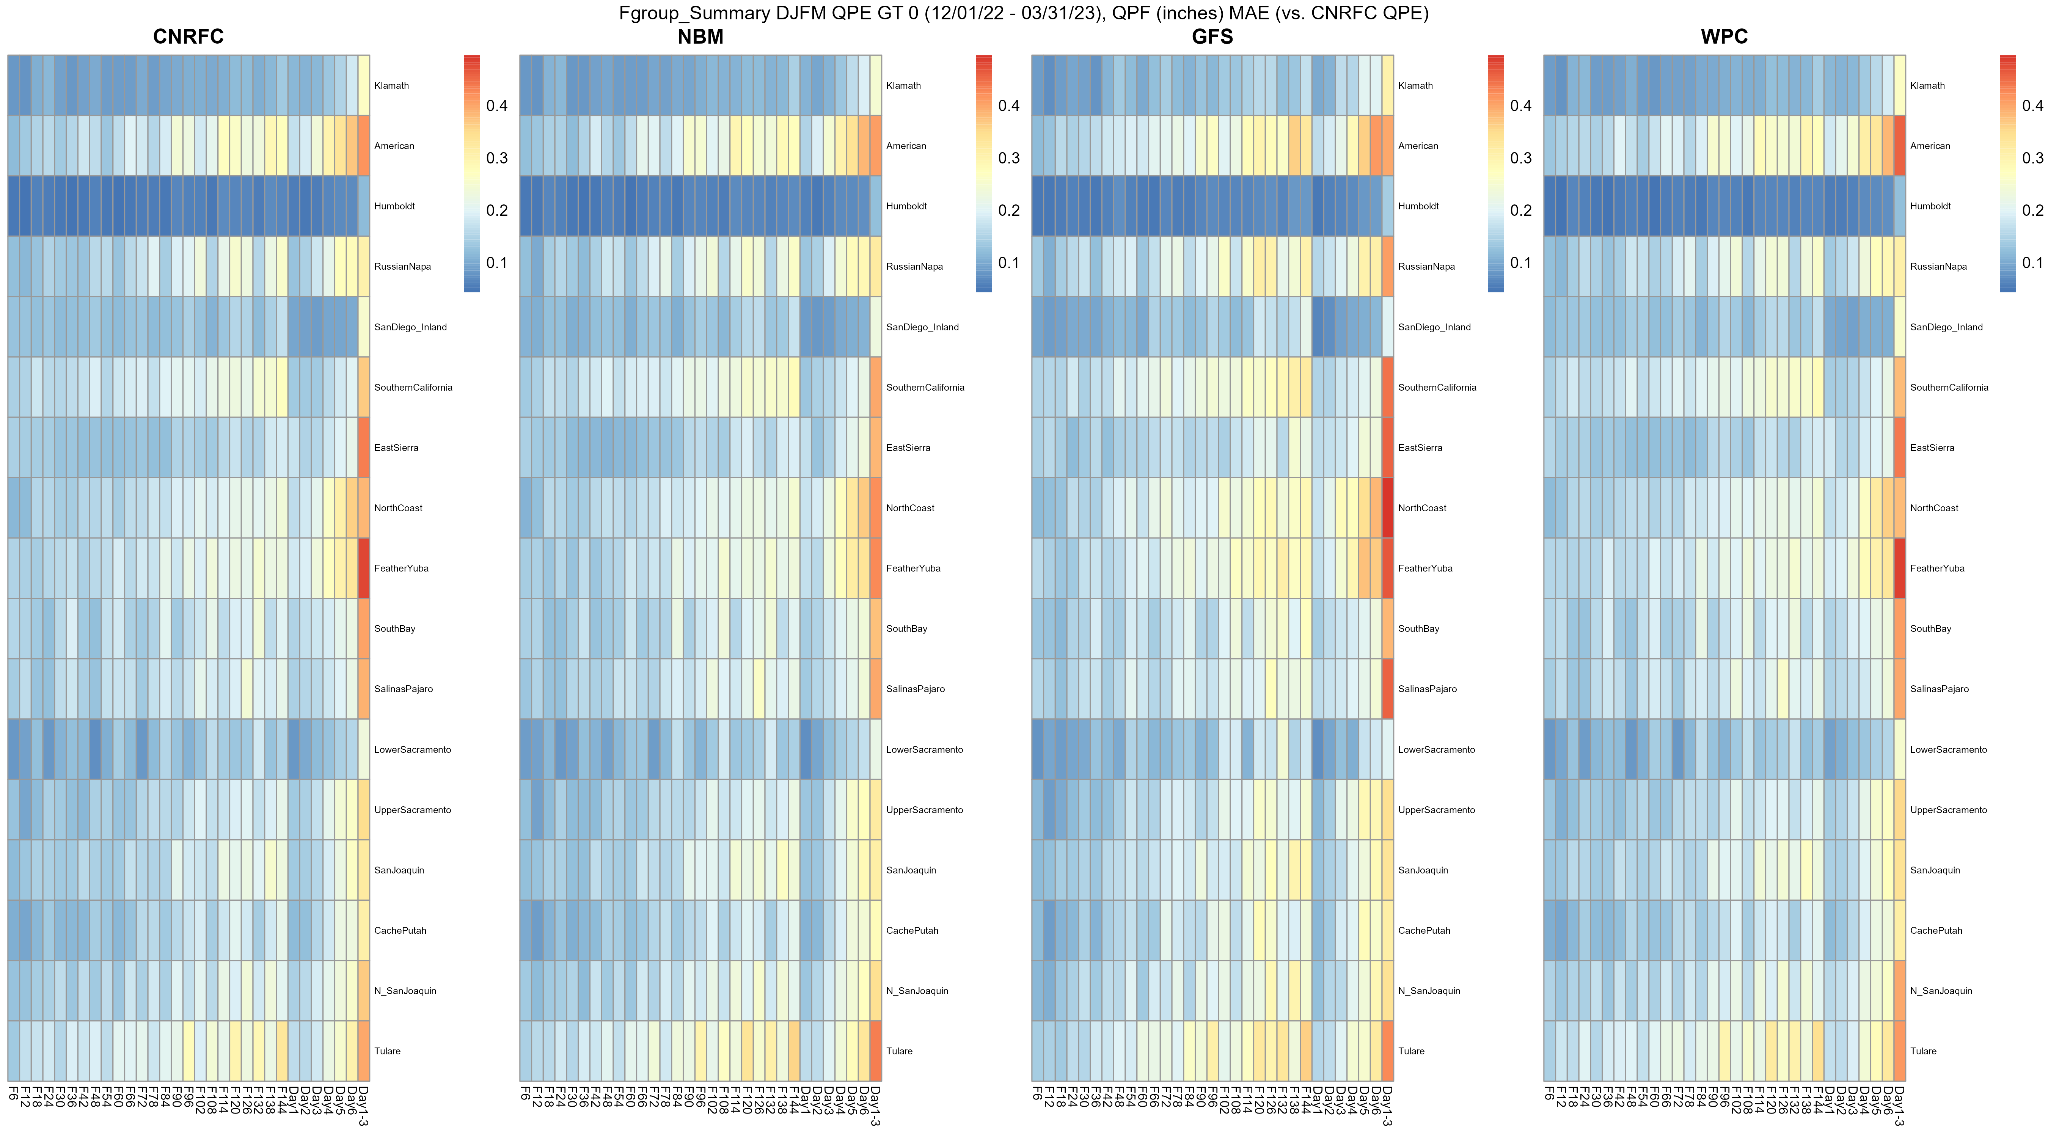 The image below displays the 17 CNRFC river forecast groups' Root Mean Squared Error (RMSE) of QPF for four sources (12Z morning CNRFC, 12Z GFS, NBM, and WPC) versus the CNRFC QPE from December 1, 2022, through March 31, 2023. Click on the image below to enlarge and open in a new tab. 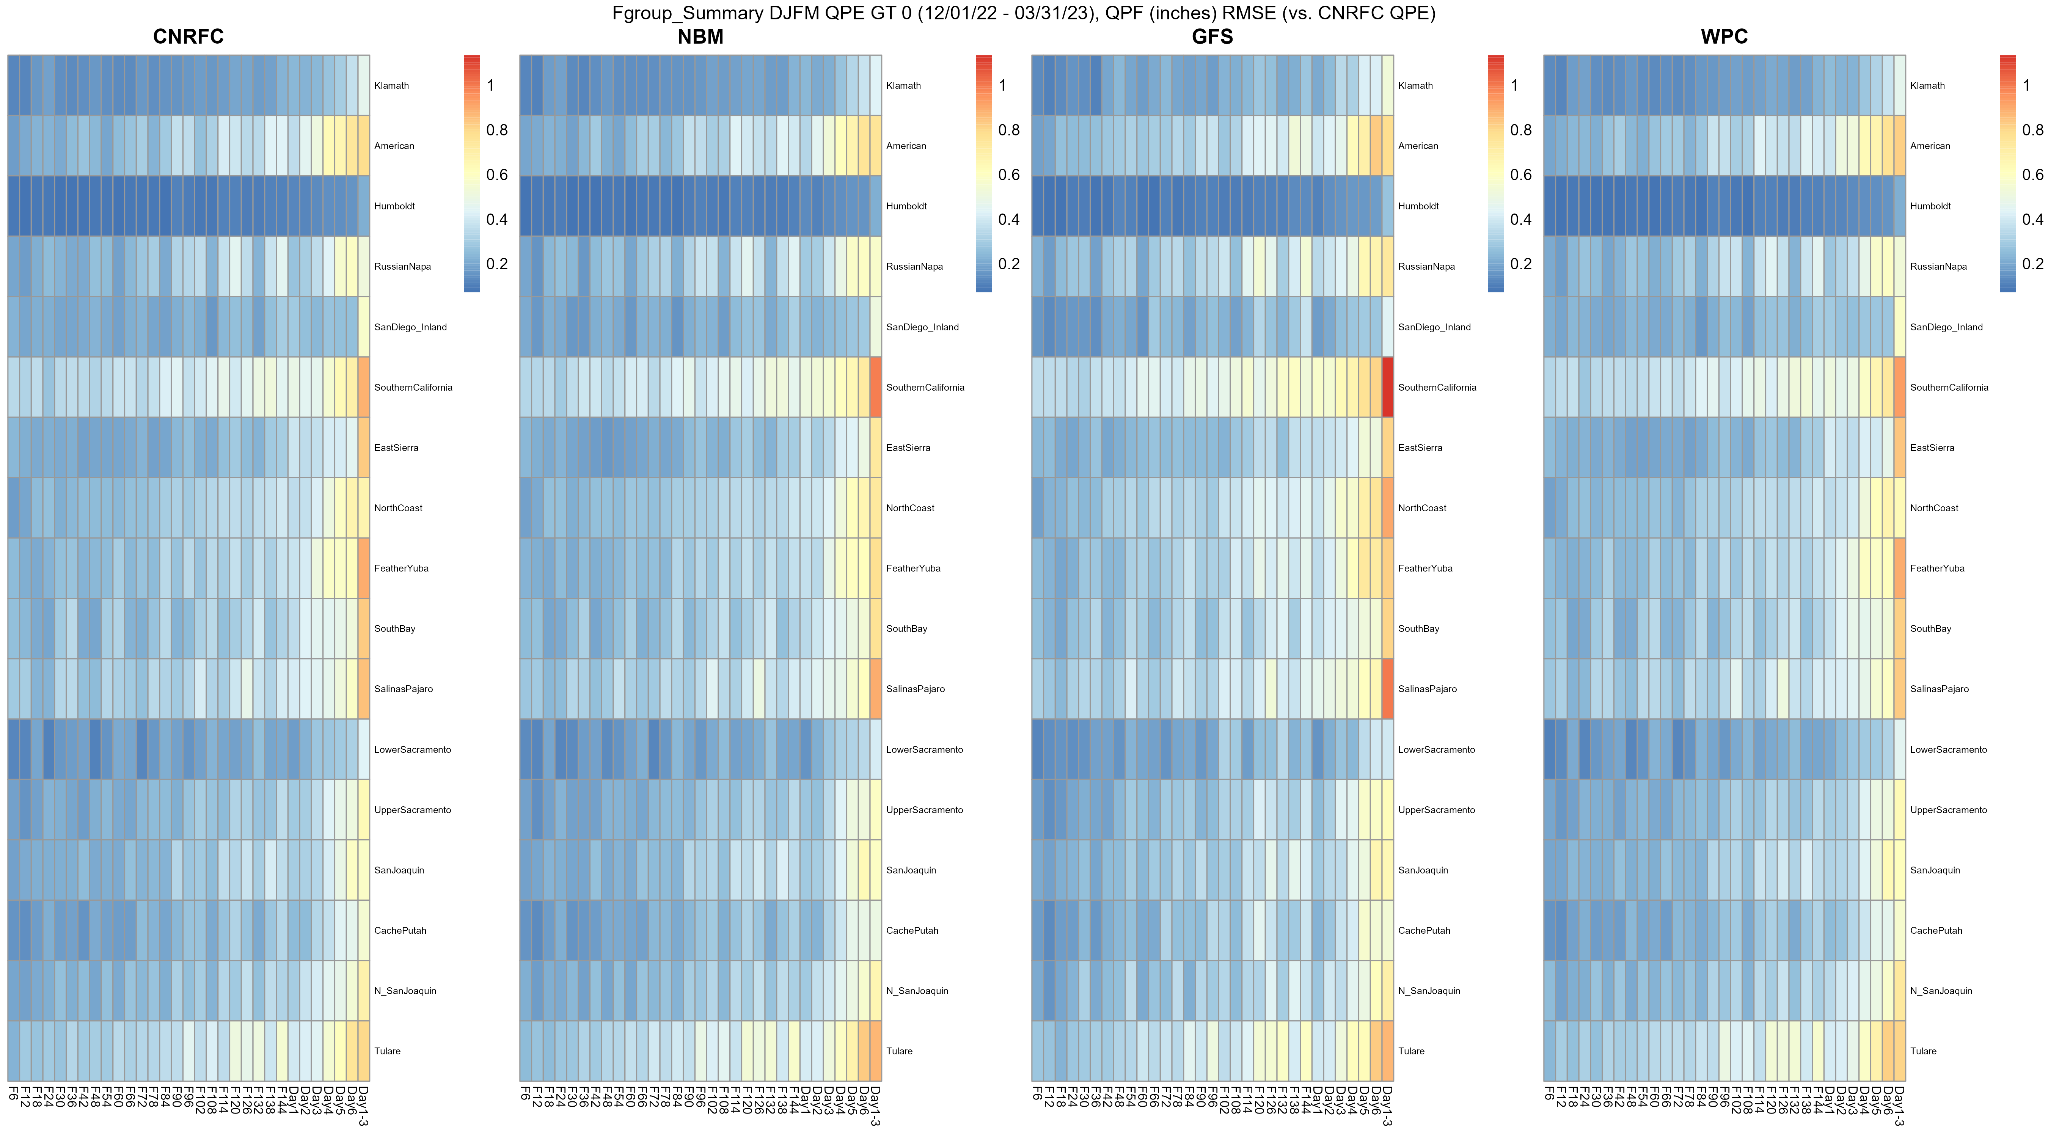 The image below displays the 17 CNRFC river forecast groups' Percent Bias (PBIAS) of QPF for four sources (12Z morning CNRFC, 12Z GFS, NBM, and WPC) versus the CNRFC QPE from December 1, 2022, through March 31, 2023. Click on the image below to enlarge and open in a new tab. 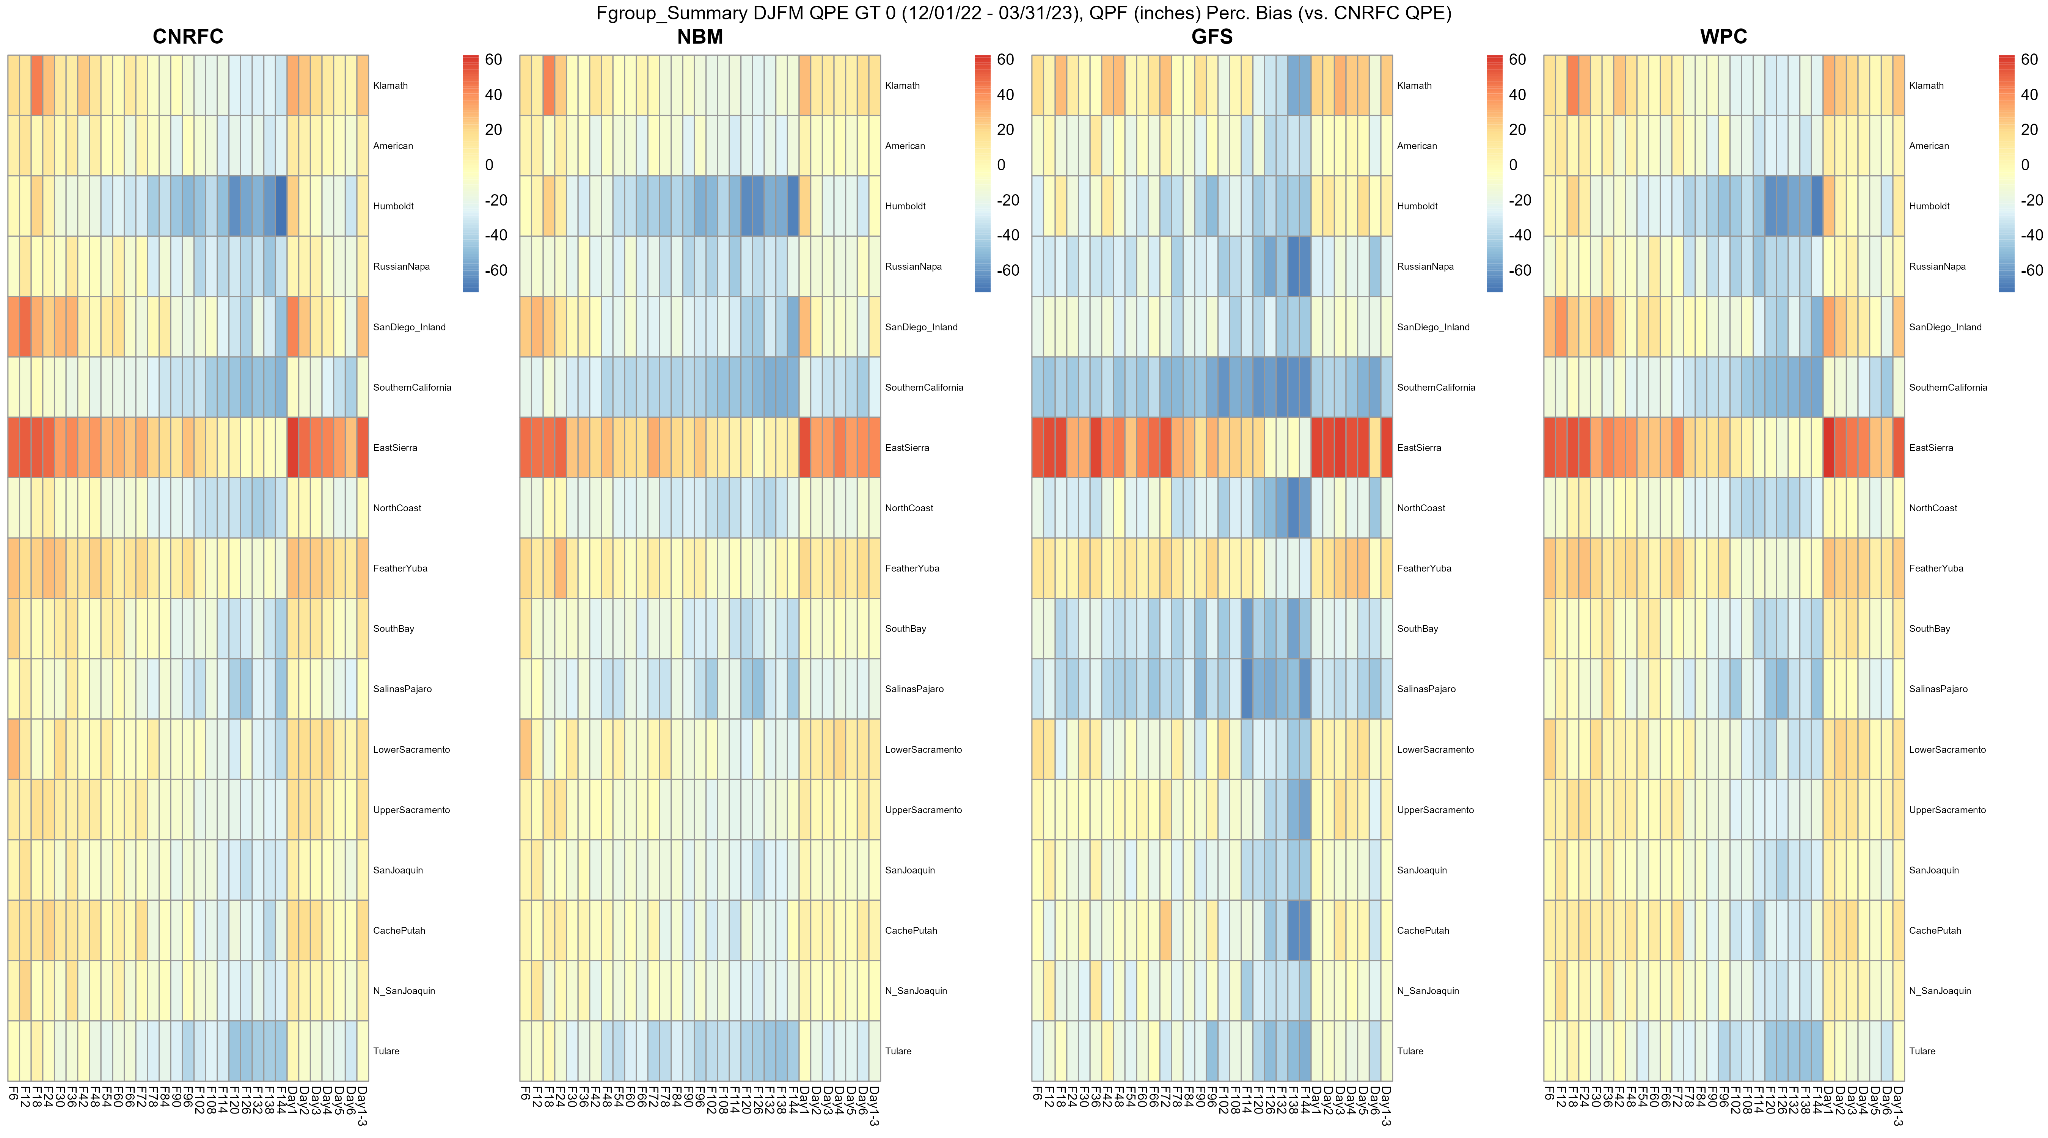 The image below displays the 17 CNRFC river forecast groups' Heidke Skill Score (HSS) of QPF for four sources (12Z morning CNRFC, 12Z GFS, NBM, and WPC) versus the CNRFC QPE from December 1, 2022, through March 31, 2023. Click on the image below to enlarge and open in a new tab. 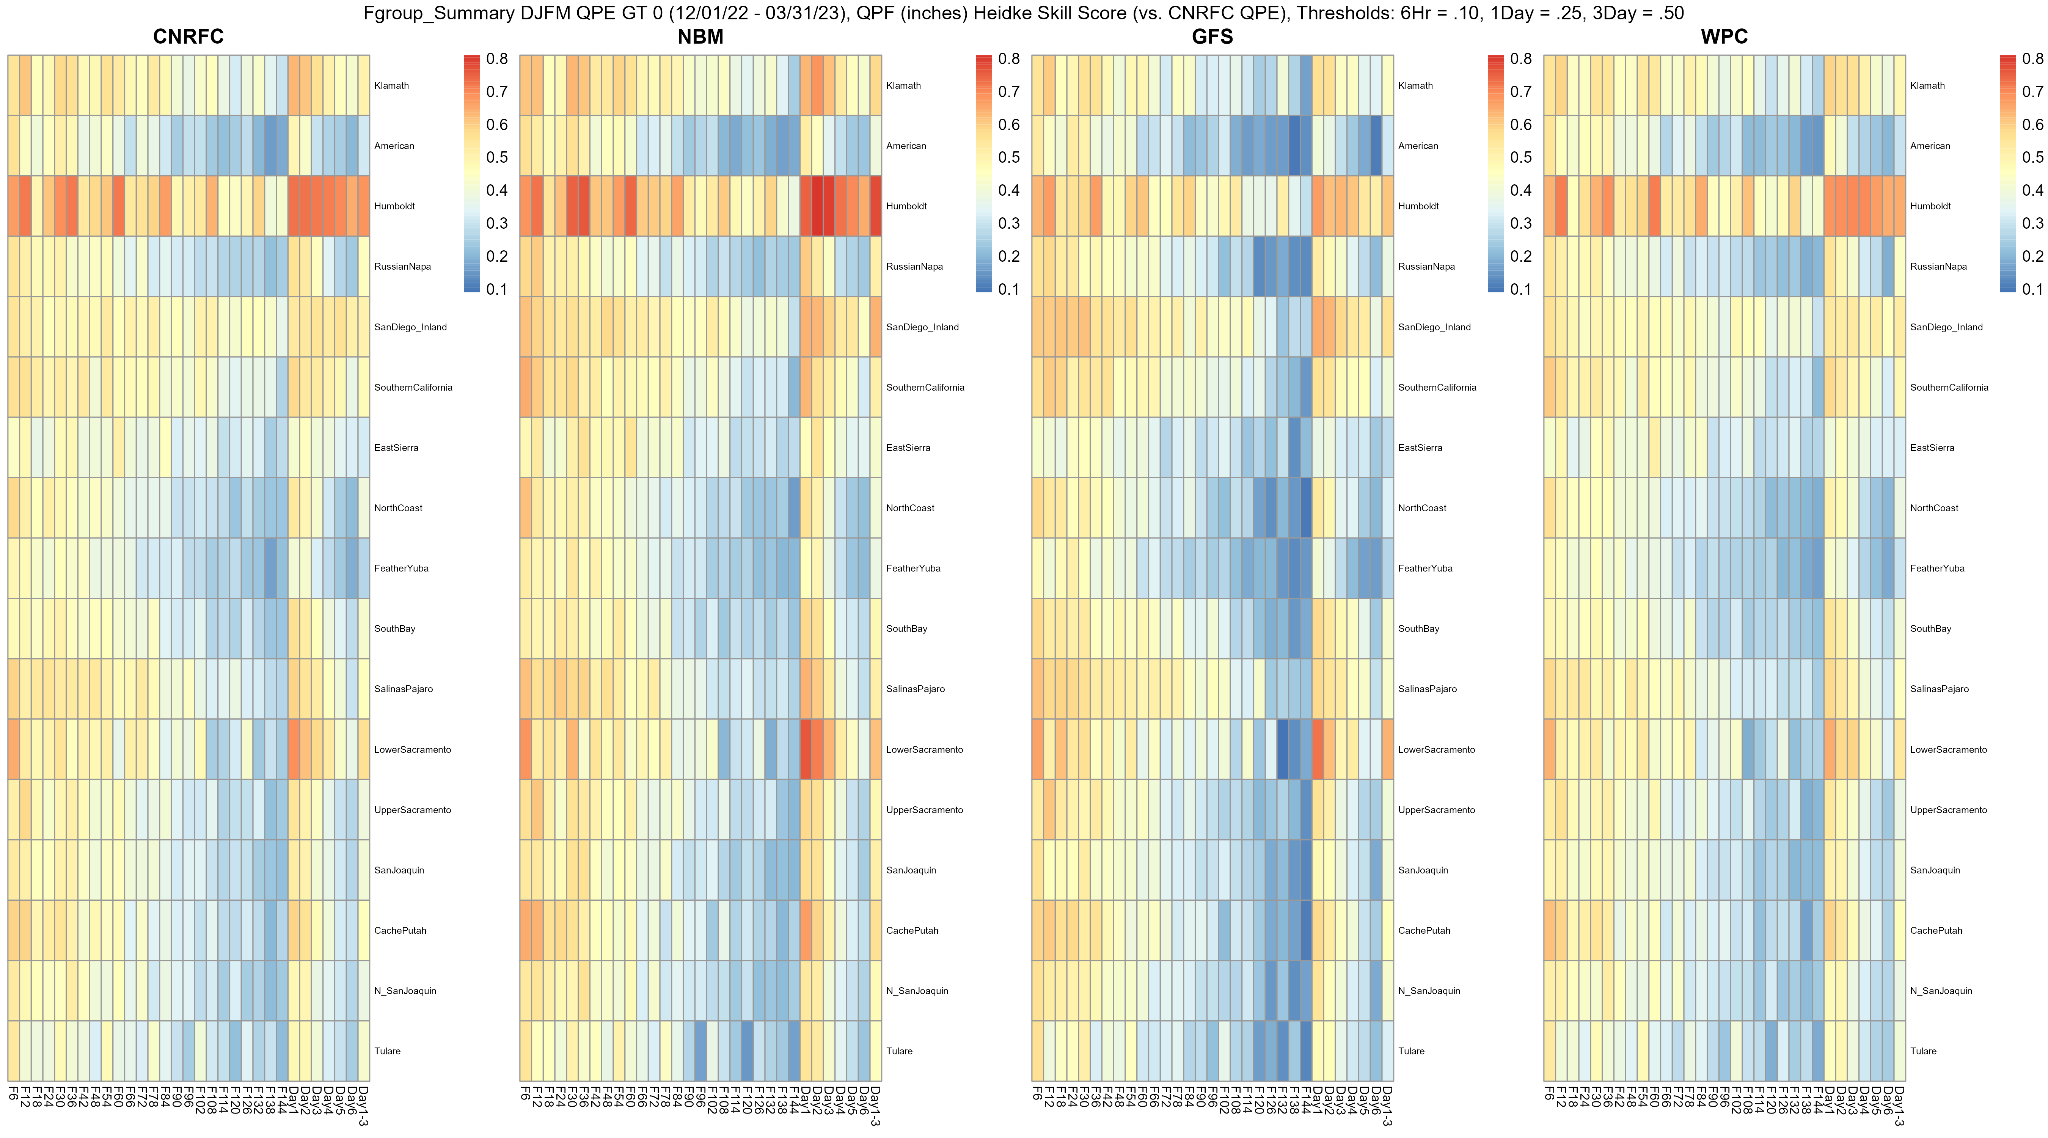 New River Forecast Groups for 2023 WY For the 2023 WY, the Southern California forecast group was divided into the San Diego/Inland and Southern California forecast groups. For Days 1-3, the GFS performed the best compared to the CNRFC, NBM, and WPC for the San Diego/Inland forecast group when looking at MAE, RMSE, and PBIAS. However, the NBM performed better than the GFS when looking at the Heidke Skill Score, similar to the other 16 river forecast groups. For the Southern California forecast group, none of the models performed particularly well, but the GFS performed the worst. Another forecast group divided for the 2023 WY was the Central Coast, with the new forecast groups named the Salinas/Pajaro and South Bay. Looking at the South Bay forecast group for Days 1-3, all the models had a fairly high MAE and RMSE, with the NBM being the best. The MAE and RMSE were slightly higher for the Salinas/Pajaro forecast group, with GFS performing the worst. CNRFC and WPC slightly overestimated, while the GFS slightly underestimated. However, the NBM was near 0 for PBIAS in the South Bay. For the Salinas/Pajaro, the CNRFC and WPC PBIAS were near 0, the NBM showed a slight underestimate, and the GFS showed a large underestimate. RMSE and MAE were fairly high, with the GFS being the worst. The NBM was slightly better in HSS compared to the other sources for the South Bay and Salinas/Pajaro groups. The individual forecast points in the Salinas Pajaro group varied by point and source on how much skill they showed. For the South Bay, the NBM was the best and showed good skill with HSS for all locations except the Los Gatos Creek - Lake Elsman (LESC1) basin. A Closer Look at a Couple River Forecast Groups for Specific Time Periods and Locations The spread of the numerical weather models for the late December 2022 through early January 2023 storms was larger than the late February through March 2023 storms. At some locations during the more impactful storms, the models for the most part underestimated the precipitation. Looking closer at the North San Joaquin forecast group, and in particular the Cosumnes River - Michigan Bar (MHBC1) basin, the QPE was quite a bit higher than the models for the majority of the 6-hour QPF out 3 days, with the exception of at 12 hours lead time, the NBM and GFS were slightly higher on January 1, 2023. In general, for the period from December 1, 2022, through March 31, 2023, the models overestimated the precipitation at Michigan Bar as well as all of the other forecast basins in the Northern San Joaquin group, with the exception of a slight underestimate for all models (greatest in the GFS) at Littlejohns Creek - Farmington Reservoir (FRGC1). In contrast, from December 26, 2022, through January 1, 2023, all the models underestimated the Days 1-3 precipitation in the Northern San Joaquin group. The image below displays 6-hour QPF amounts for the CNRFC, GFS, NBM, and WPC, along with 6-hour QPE amounts out to 72 hours (3 days) for the Cosumnes River - Michigan Bar (MHBC1) basin from December 1, 2022, though March 31, 2023. Click on the image below to enlarge and open in a new tab. 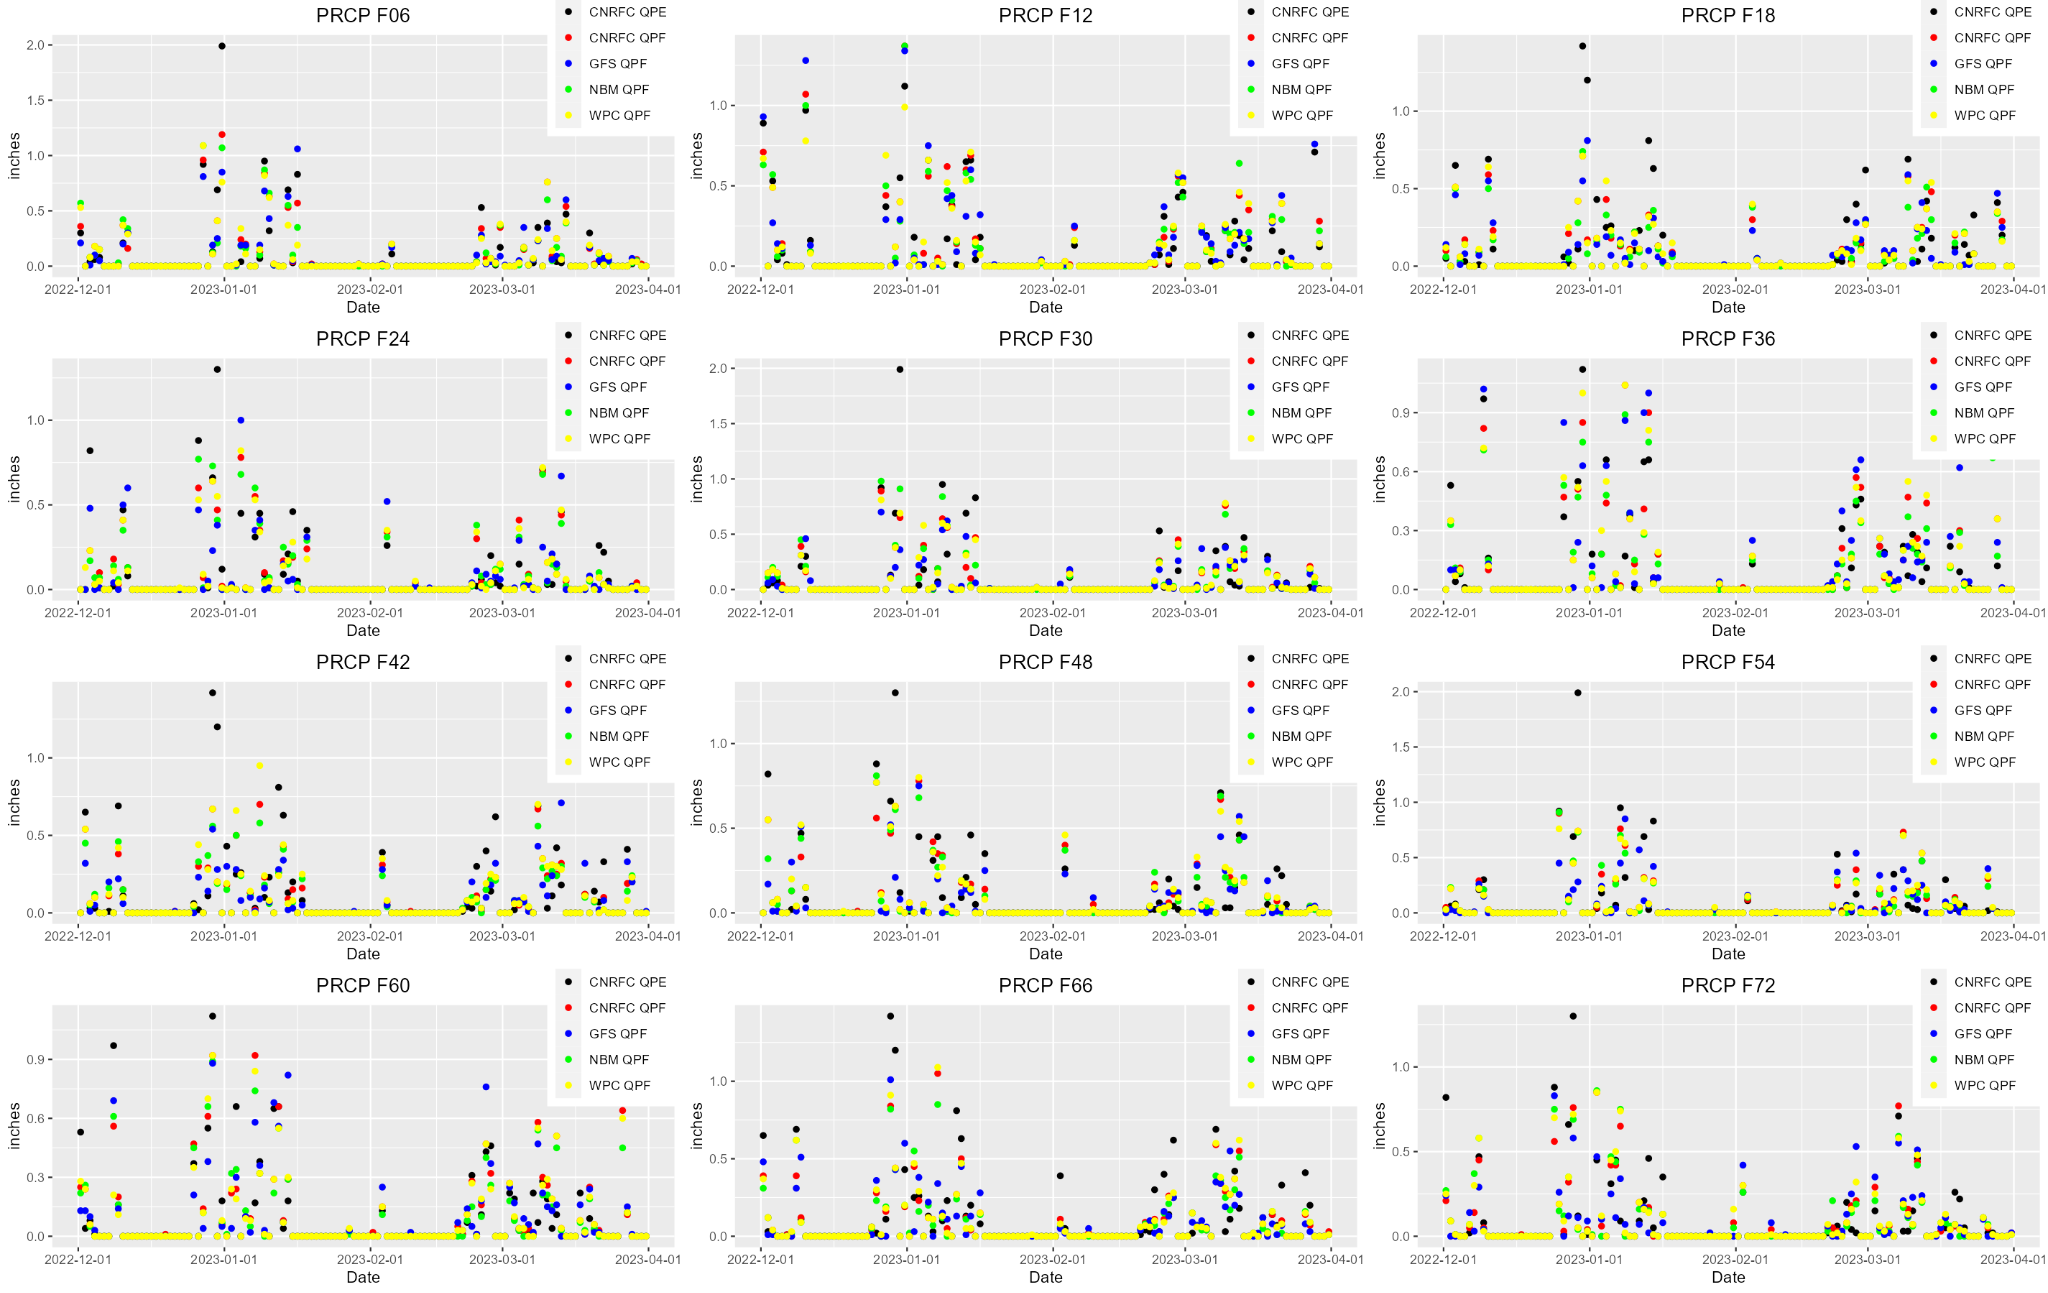 The image below displays 6-hour QPF amounts for the CNRFC, GFS, NBM, and WPC, along with 6-hour QPE amounts out to 72 hours (3 days) for the Cosumnes River - Michigan Bar (MHBC1) basin from December 26, 2022, though January 1, 2023. Click on the image below to enlarge and open in a new tab. 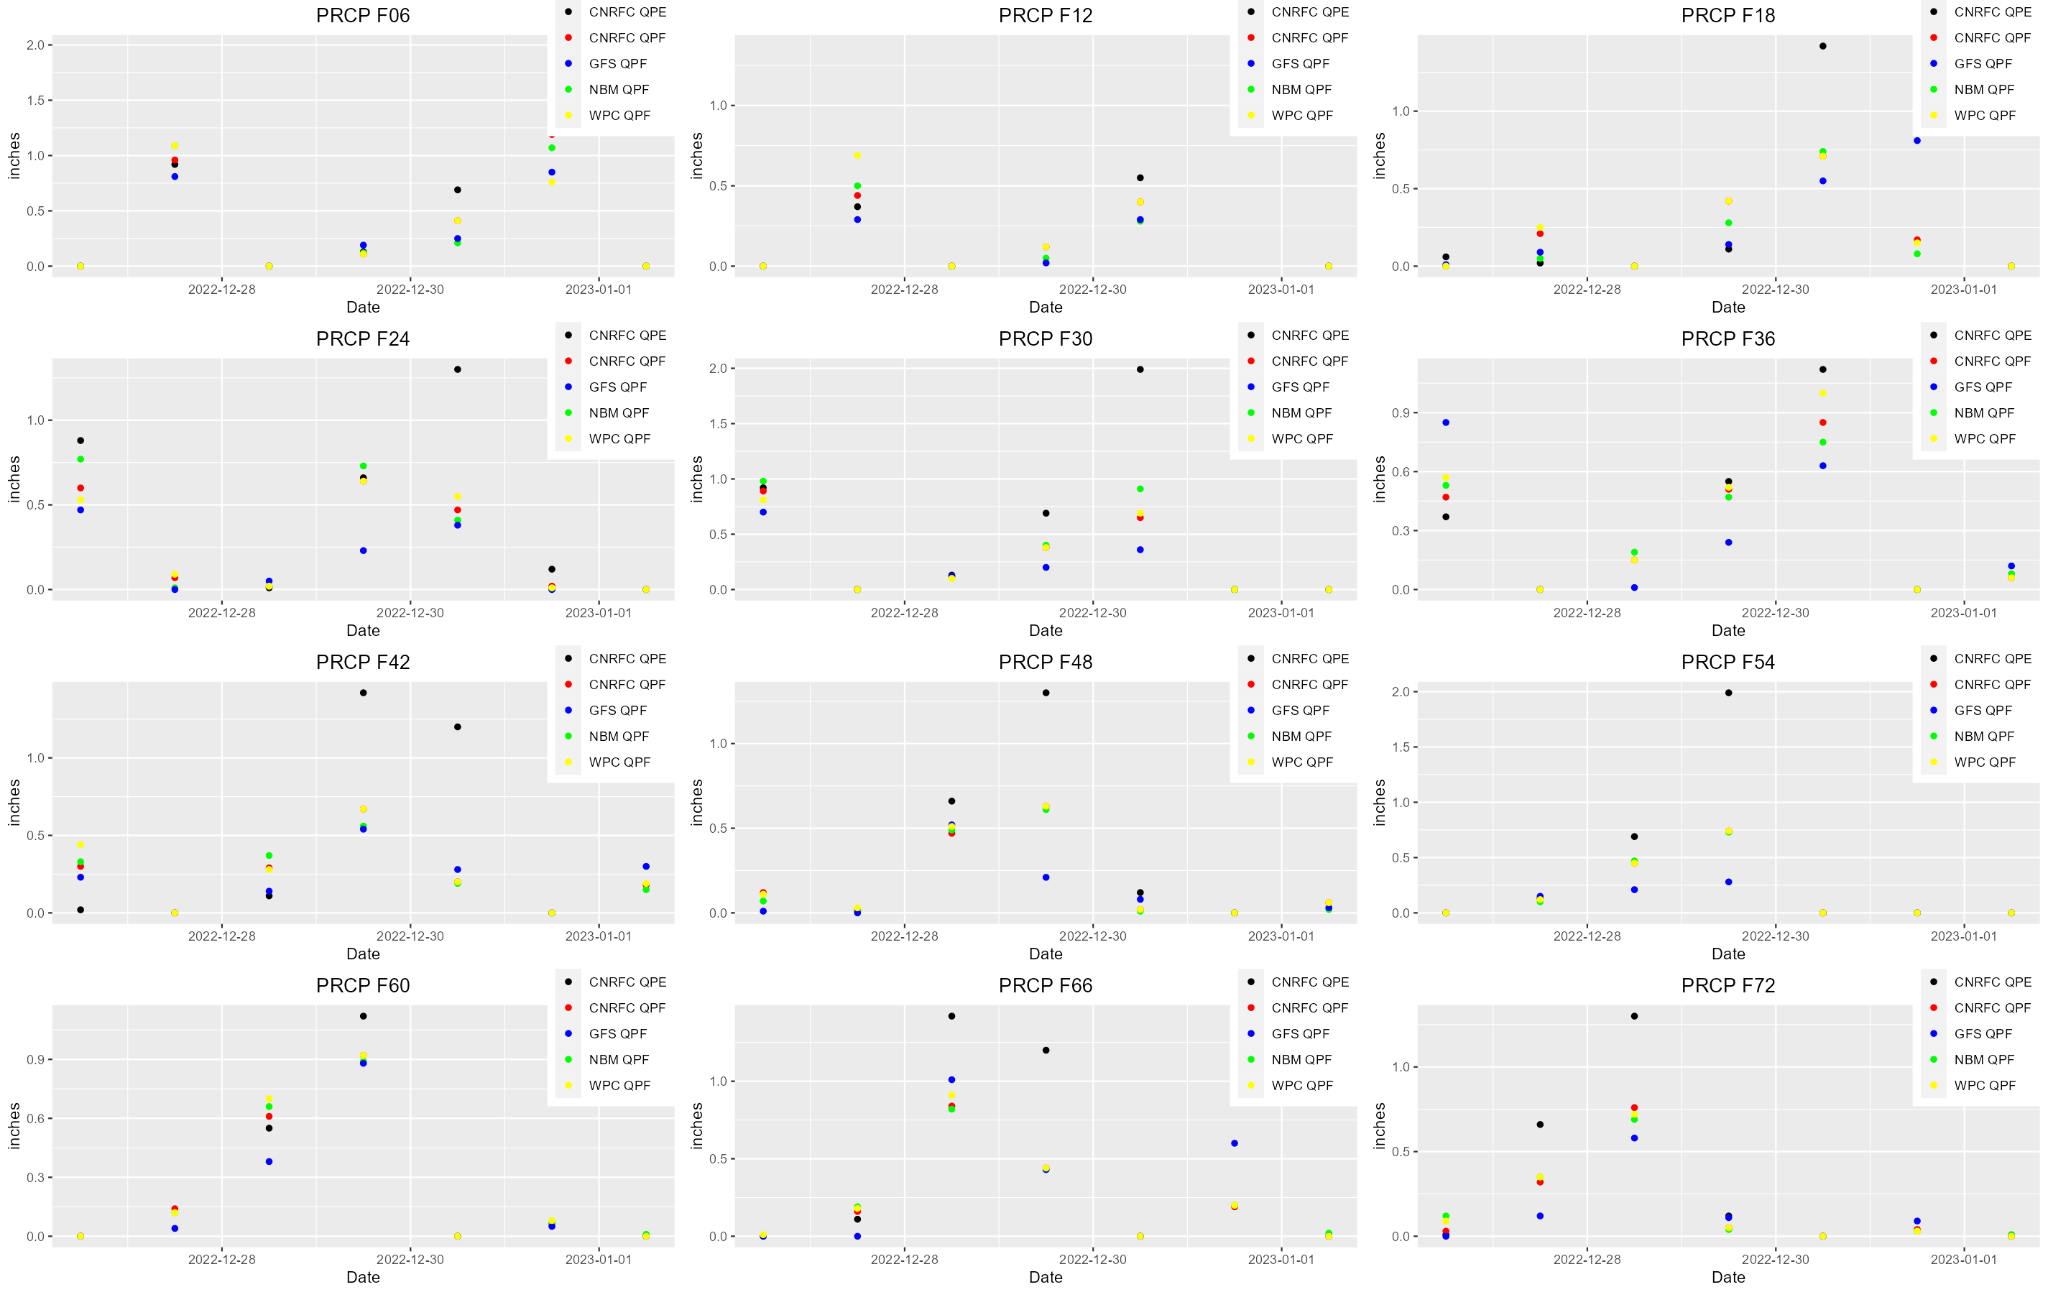 The image below displays the North San Joaquin forecast groups' Percent Bias (PBIAS) of QPF for four sources (12Z morning CNRFC, 12Z GFS, NBM, and WPC) versus the CNRFC QPE from December 1, 2022, through March 31, 2023. Click on the image below to enlarge and open in a new tab. 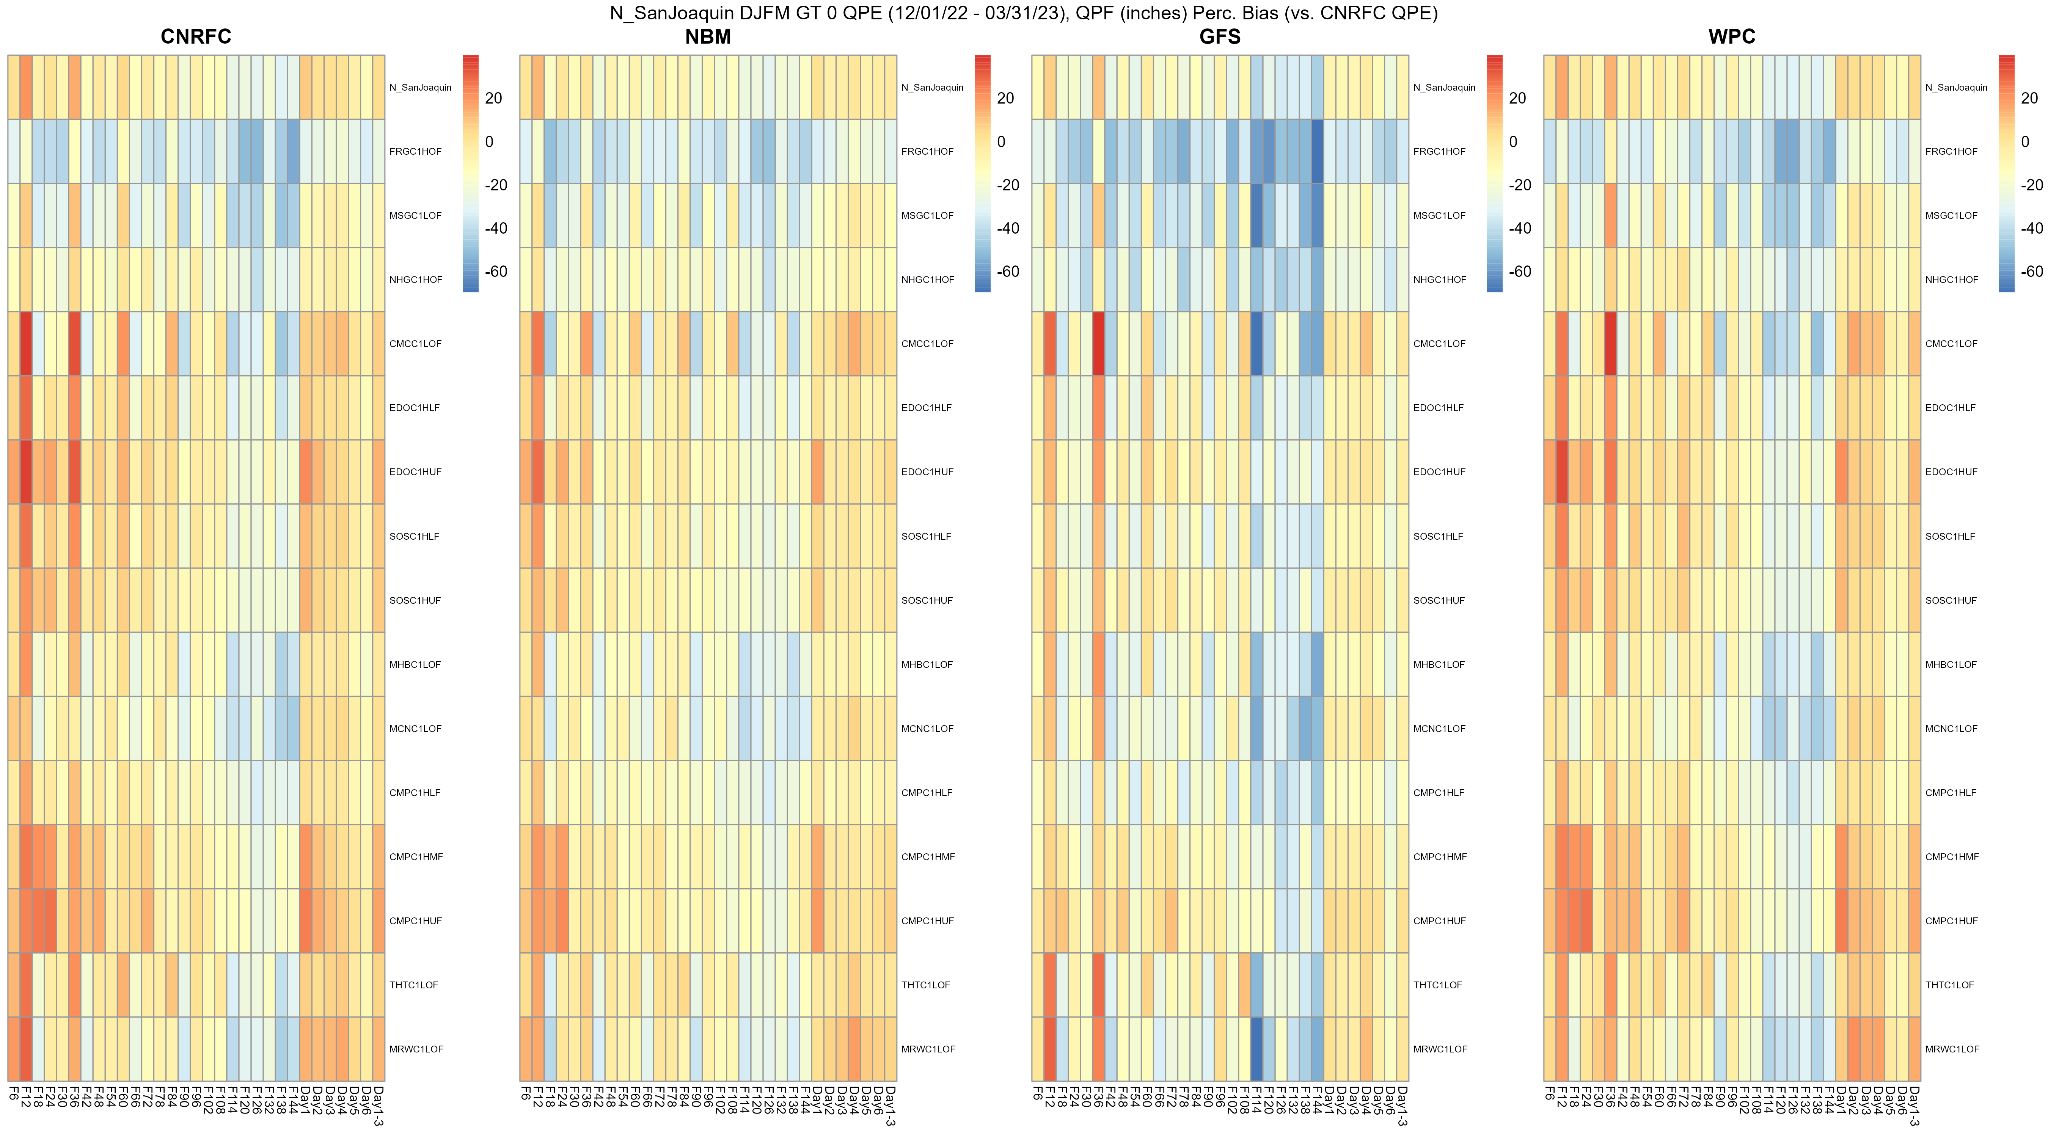 The image below displays the North San Joaquin forecast groups' Percent Bias (PBIAS) of QPF for four sources (12Z morning CNRFC, 12Z GFS, NBM, and WPC) versus the CNRFC QPE from December 26, 2022, through January 1, 2023. Click on the image below to enlarge and open in a new tab. 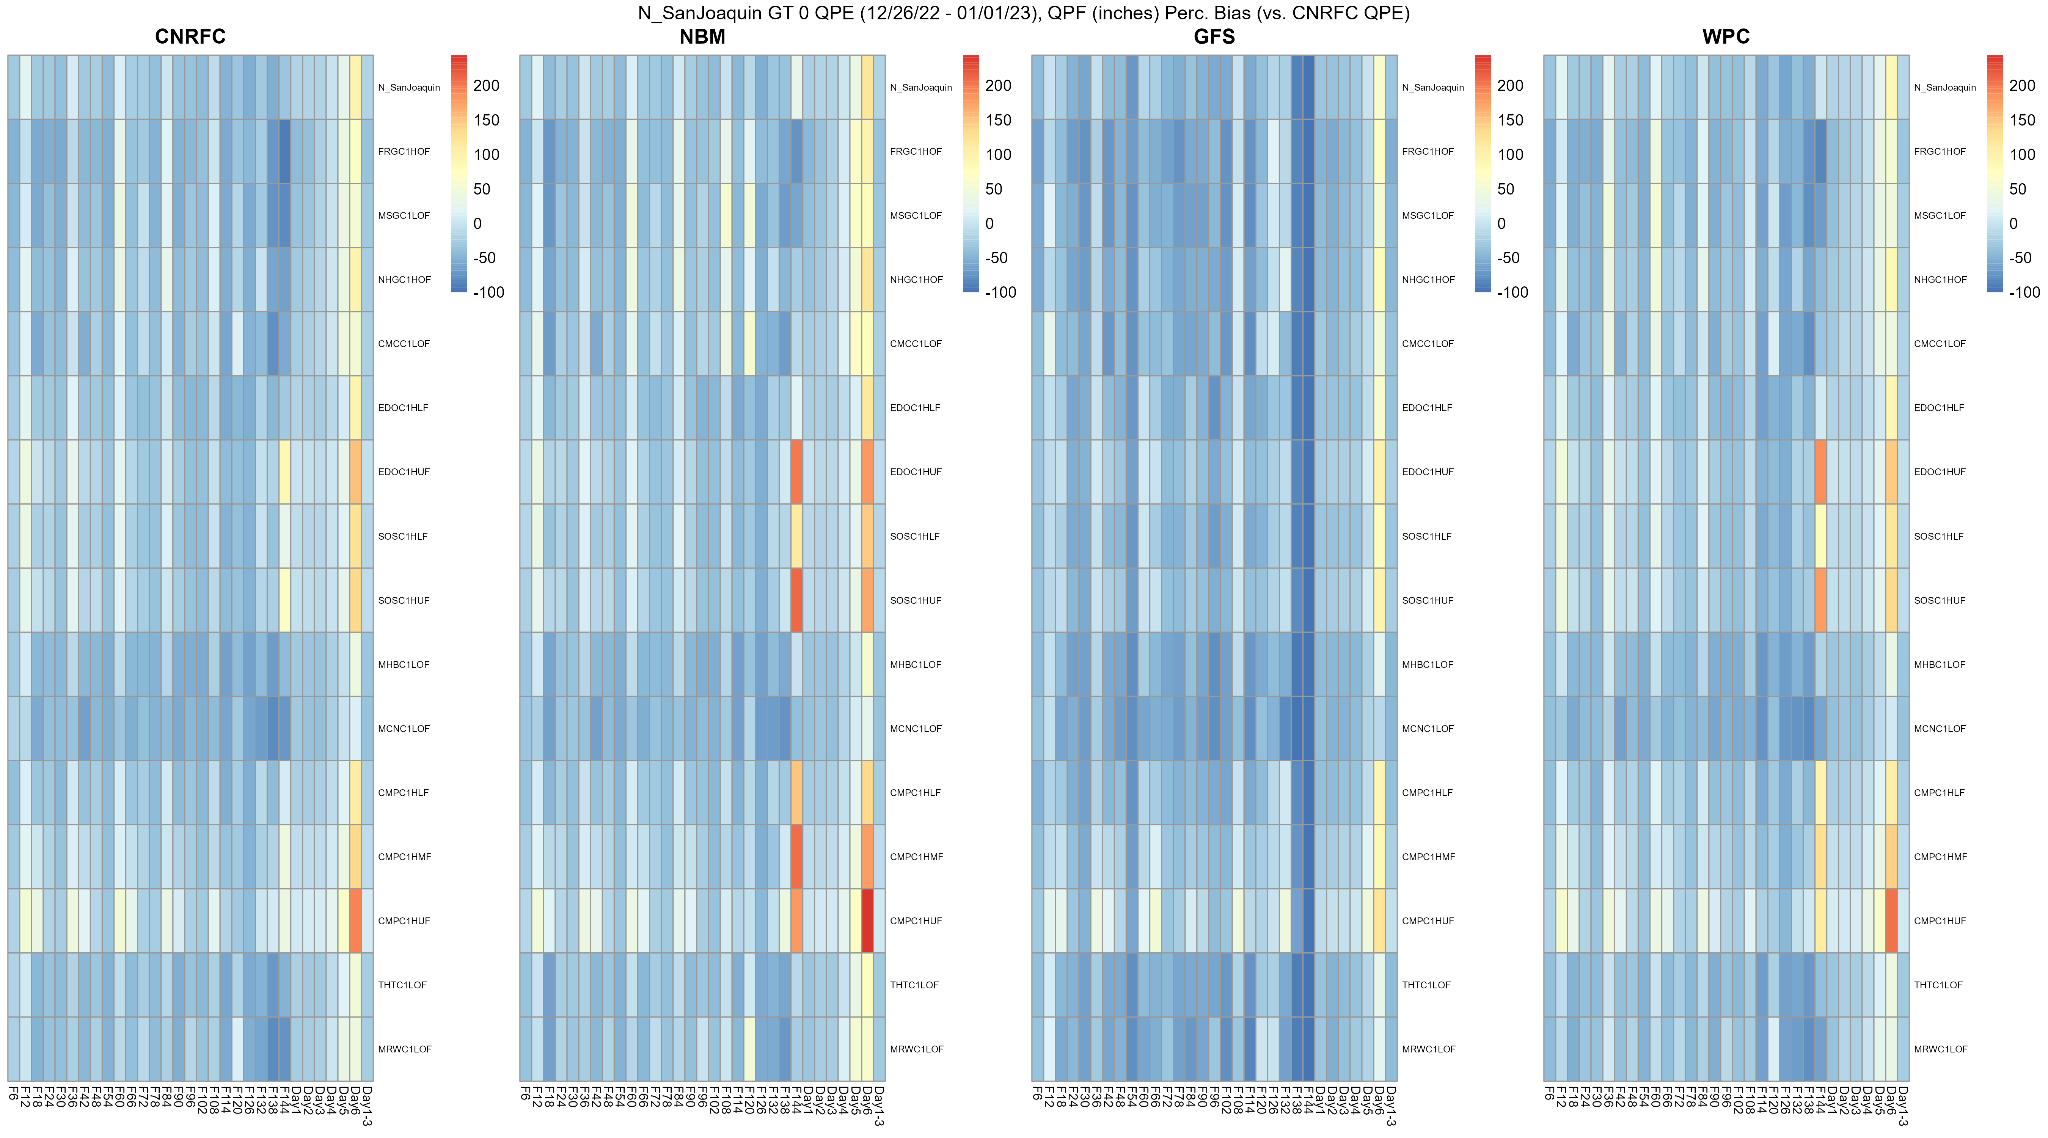 Taking a closer look at the Salinas/Pajaro forecast group in January, the Salinas River - Paso Robles (PRBC1) basin received historic precipitation from January 9-10. A precipitation gauge at San Luis Obispo recorded 6", which broke its all-time daily record. The QPF was underforecast by the CNRFC, WPC, NBM, and GFS out to 36 hours. For PRBC1, all the models underestimated the precipitation, with the CNRFC and WPC slightly less than the NBM, and even less than the GFS. QPF was underestimated for the Salinas/Pajaro forecast group from January 4, 2023, thorugh January 17, 2023, but for the period of December 1, 2022 through March 31, 2023, the CNRFC and WPC showed little bias, with NBM and GFS underestimating (GFS the most). The image below displays 6-hour QPF amounts for the CNRFC, GFS, NBM, and WPC, along with 6-hour QPE amounts out to 72 hours (3 days) for the Salinas River - Paso Robles (PRBC1) basin from December 1, 2022, though March 31, 2023. Click on the image below to enlarge and open in a new tab. 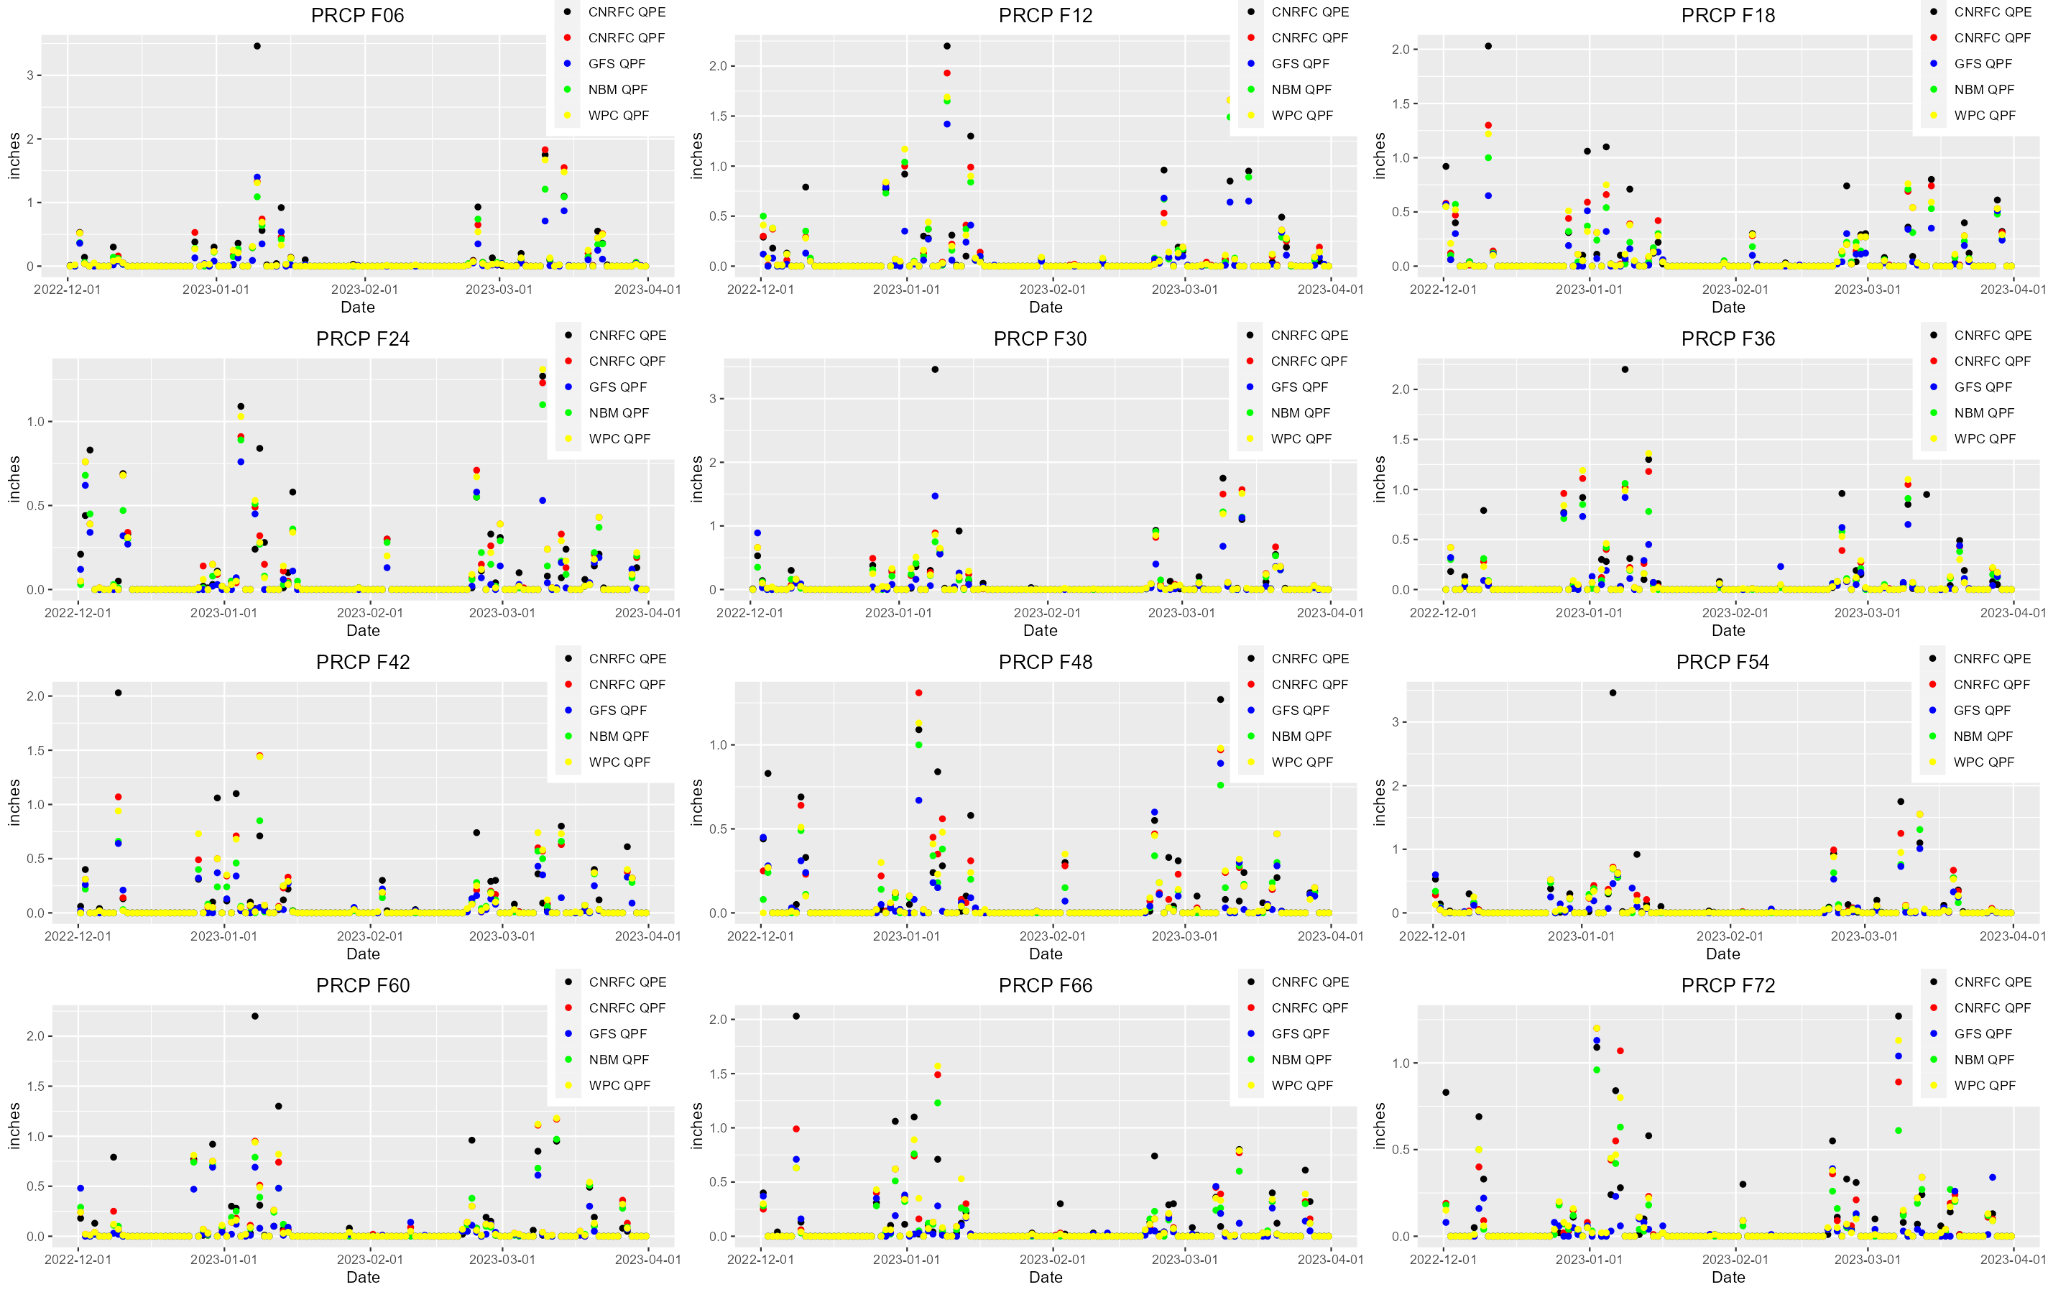 The image below displays 6-hour QPF amounts for the CNRFC, GFS, NBM, and WPC, along with 6-hour QPE amounts out to 72 hours (3 days) for the Salinas River - Paso Robles (PRBC1) basin from January 4, 2023, though January 17, 2023. Click on the image below to enlarge and open in a new tab. 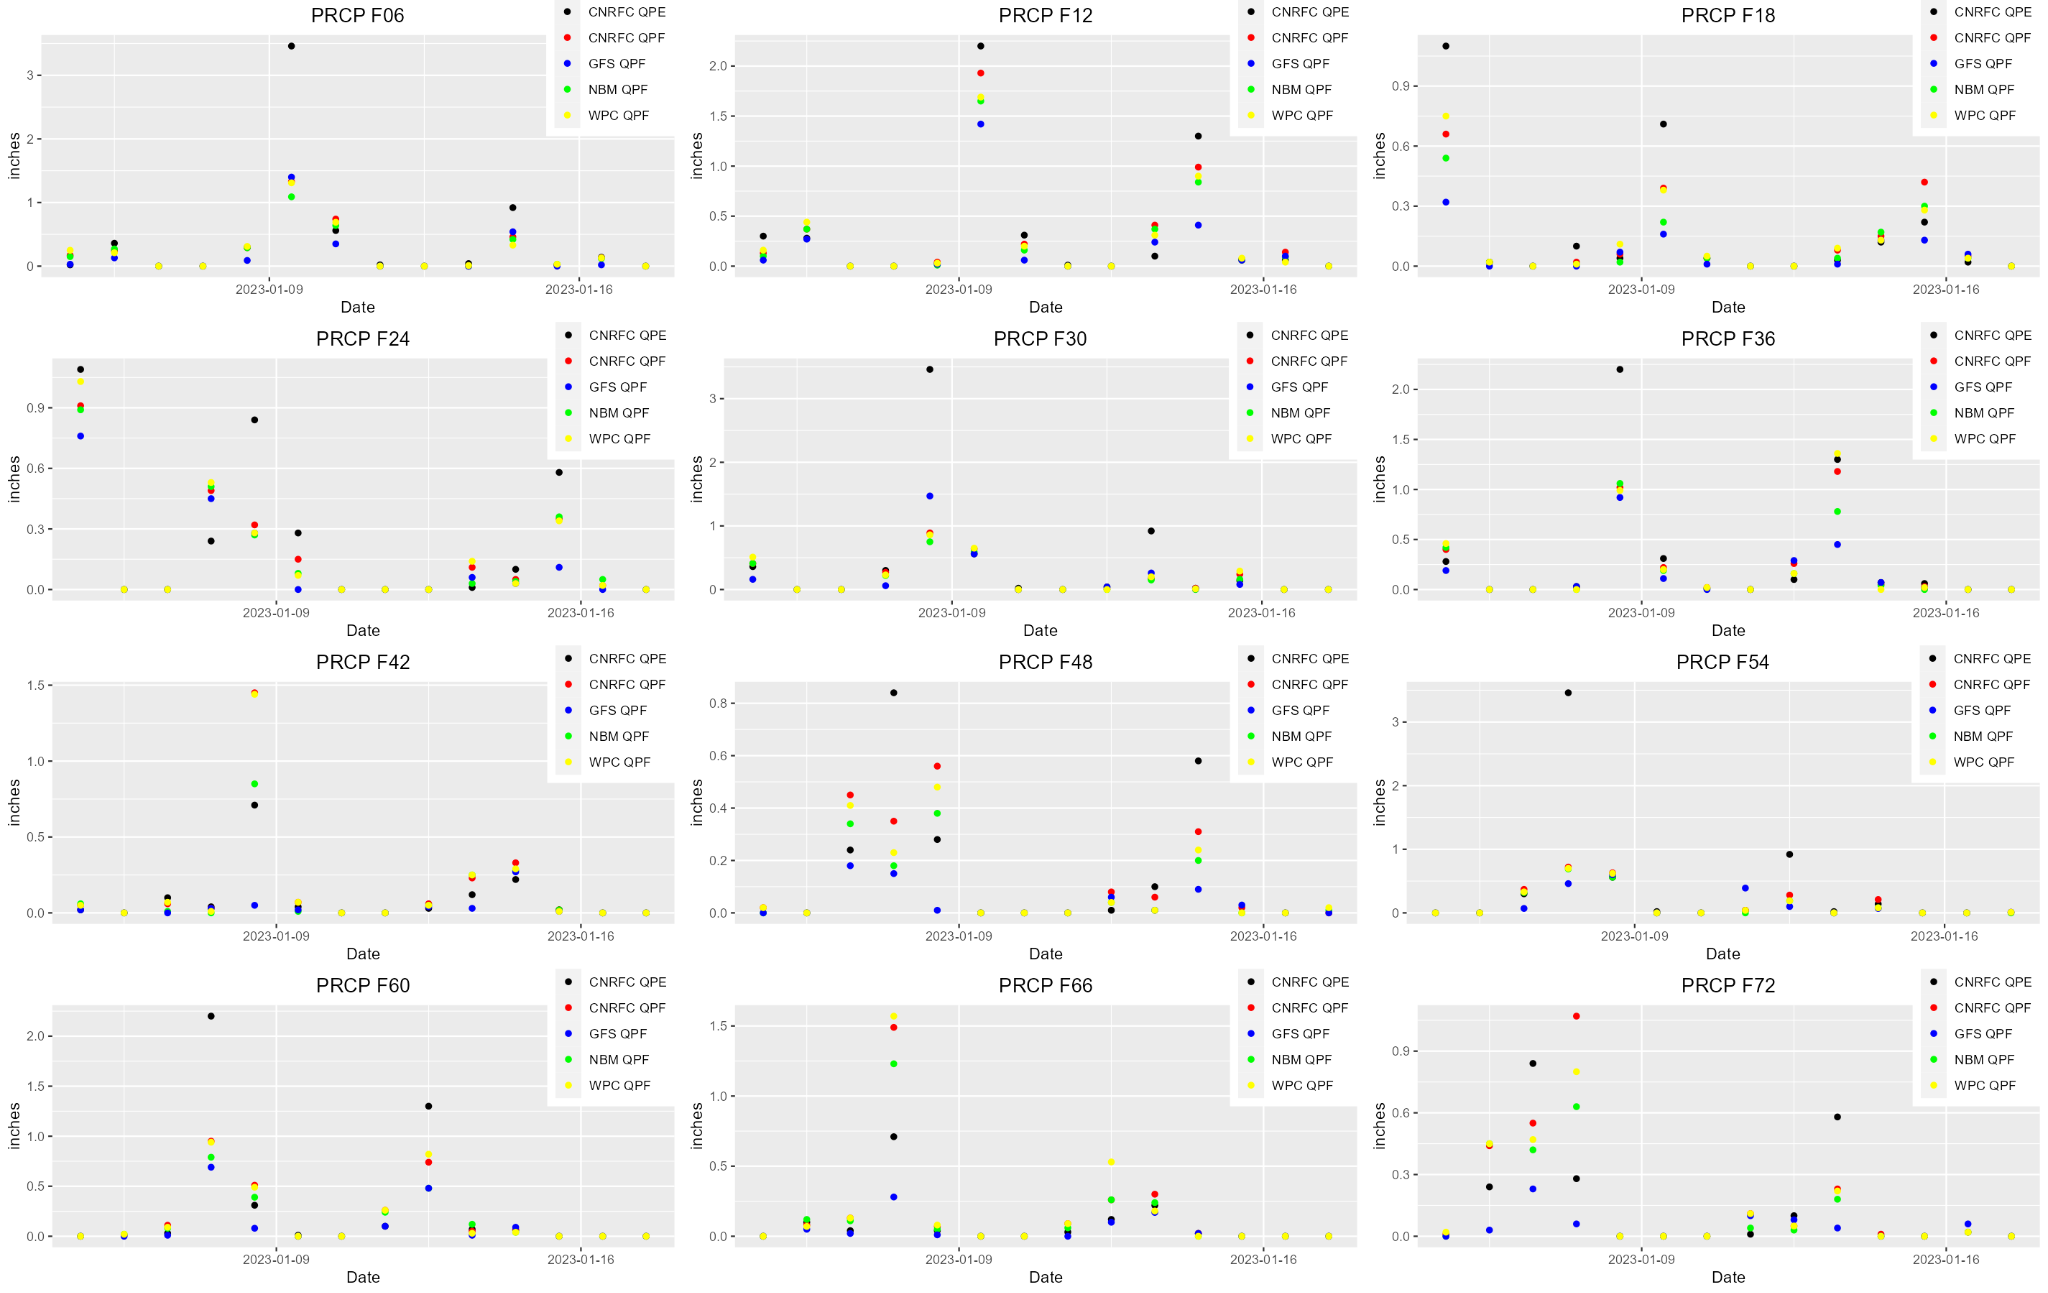 The image below displays the Salinas Pajaro forecast groups' Percent Bias (PBIAS) of QPF for four sources (12Z morning CNRFC, 12Z GFS, NBM, and WPC) versus the CNRFC QPE from December 1, 2022, through March 31, 2023. Click on the image below to enlarge and open in a new tab. 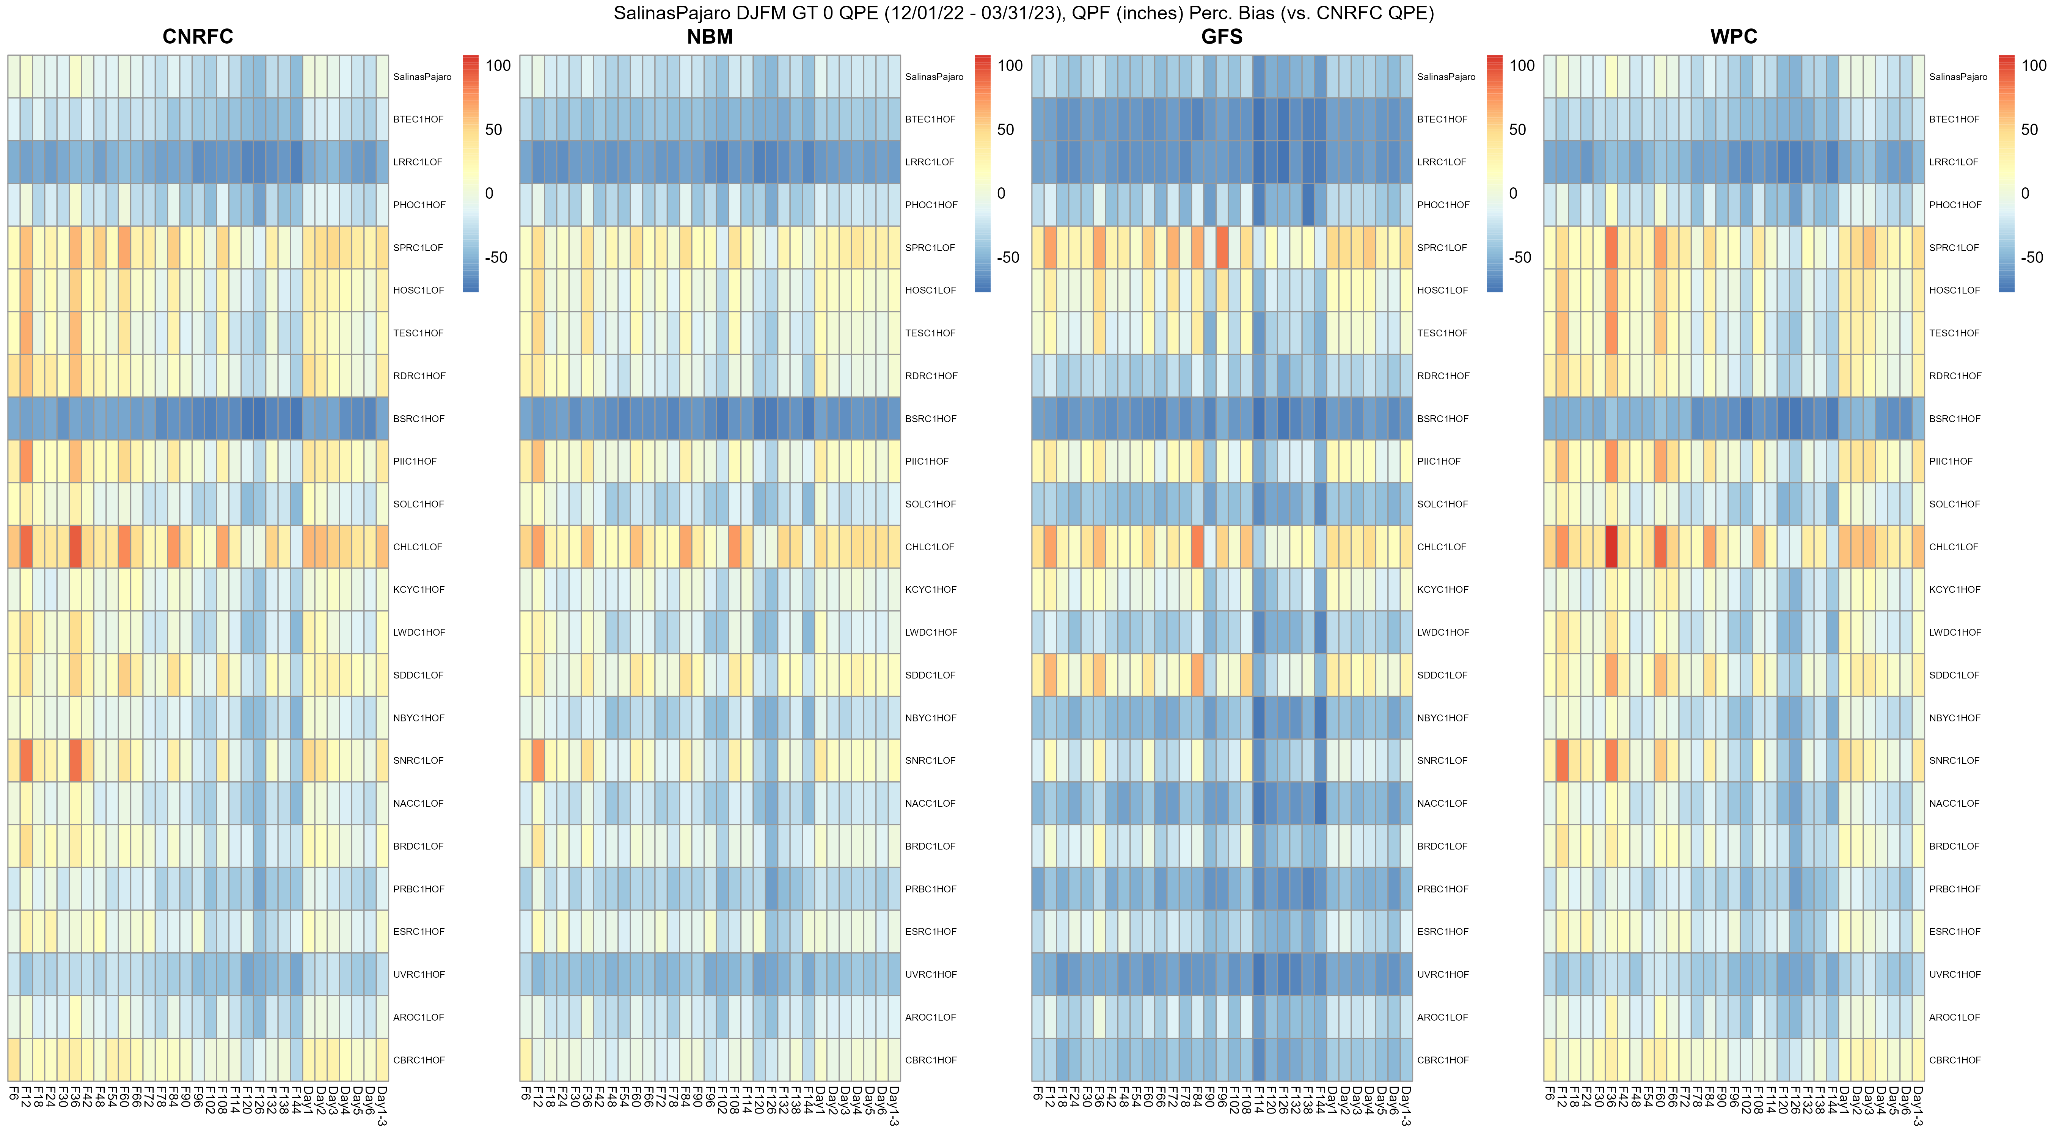 The image below displays the Salinas Pajaro forecast groups' Percent Bias (PBIAS) of QPF for four sources (12Z morning CNRFC, 12Z GFS, NBM, and WPC) versus the CNRFC QPE from January 4, 2023, through January 17, 2023. Click on the image below to enlarge and open in a new tab. 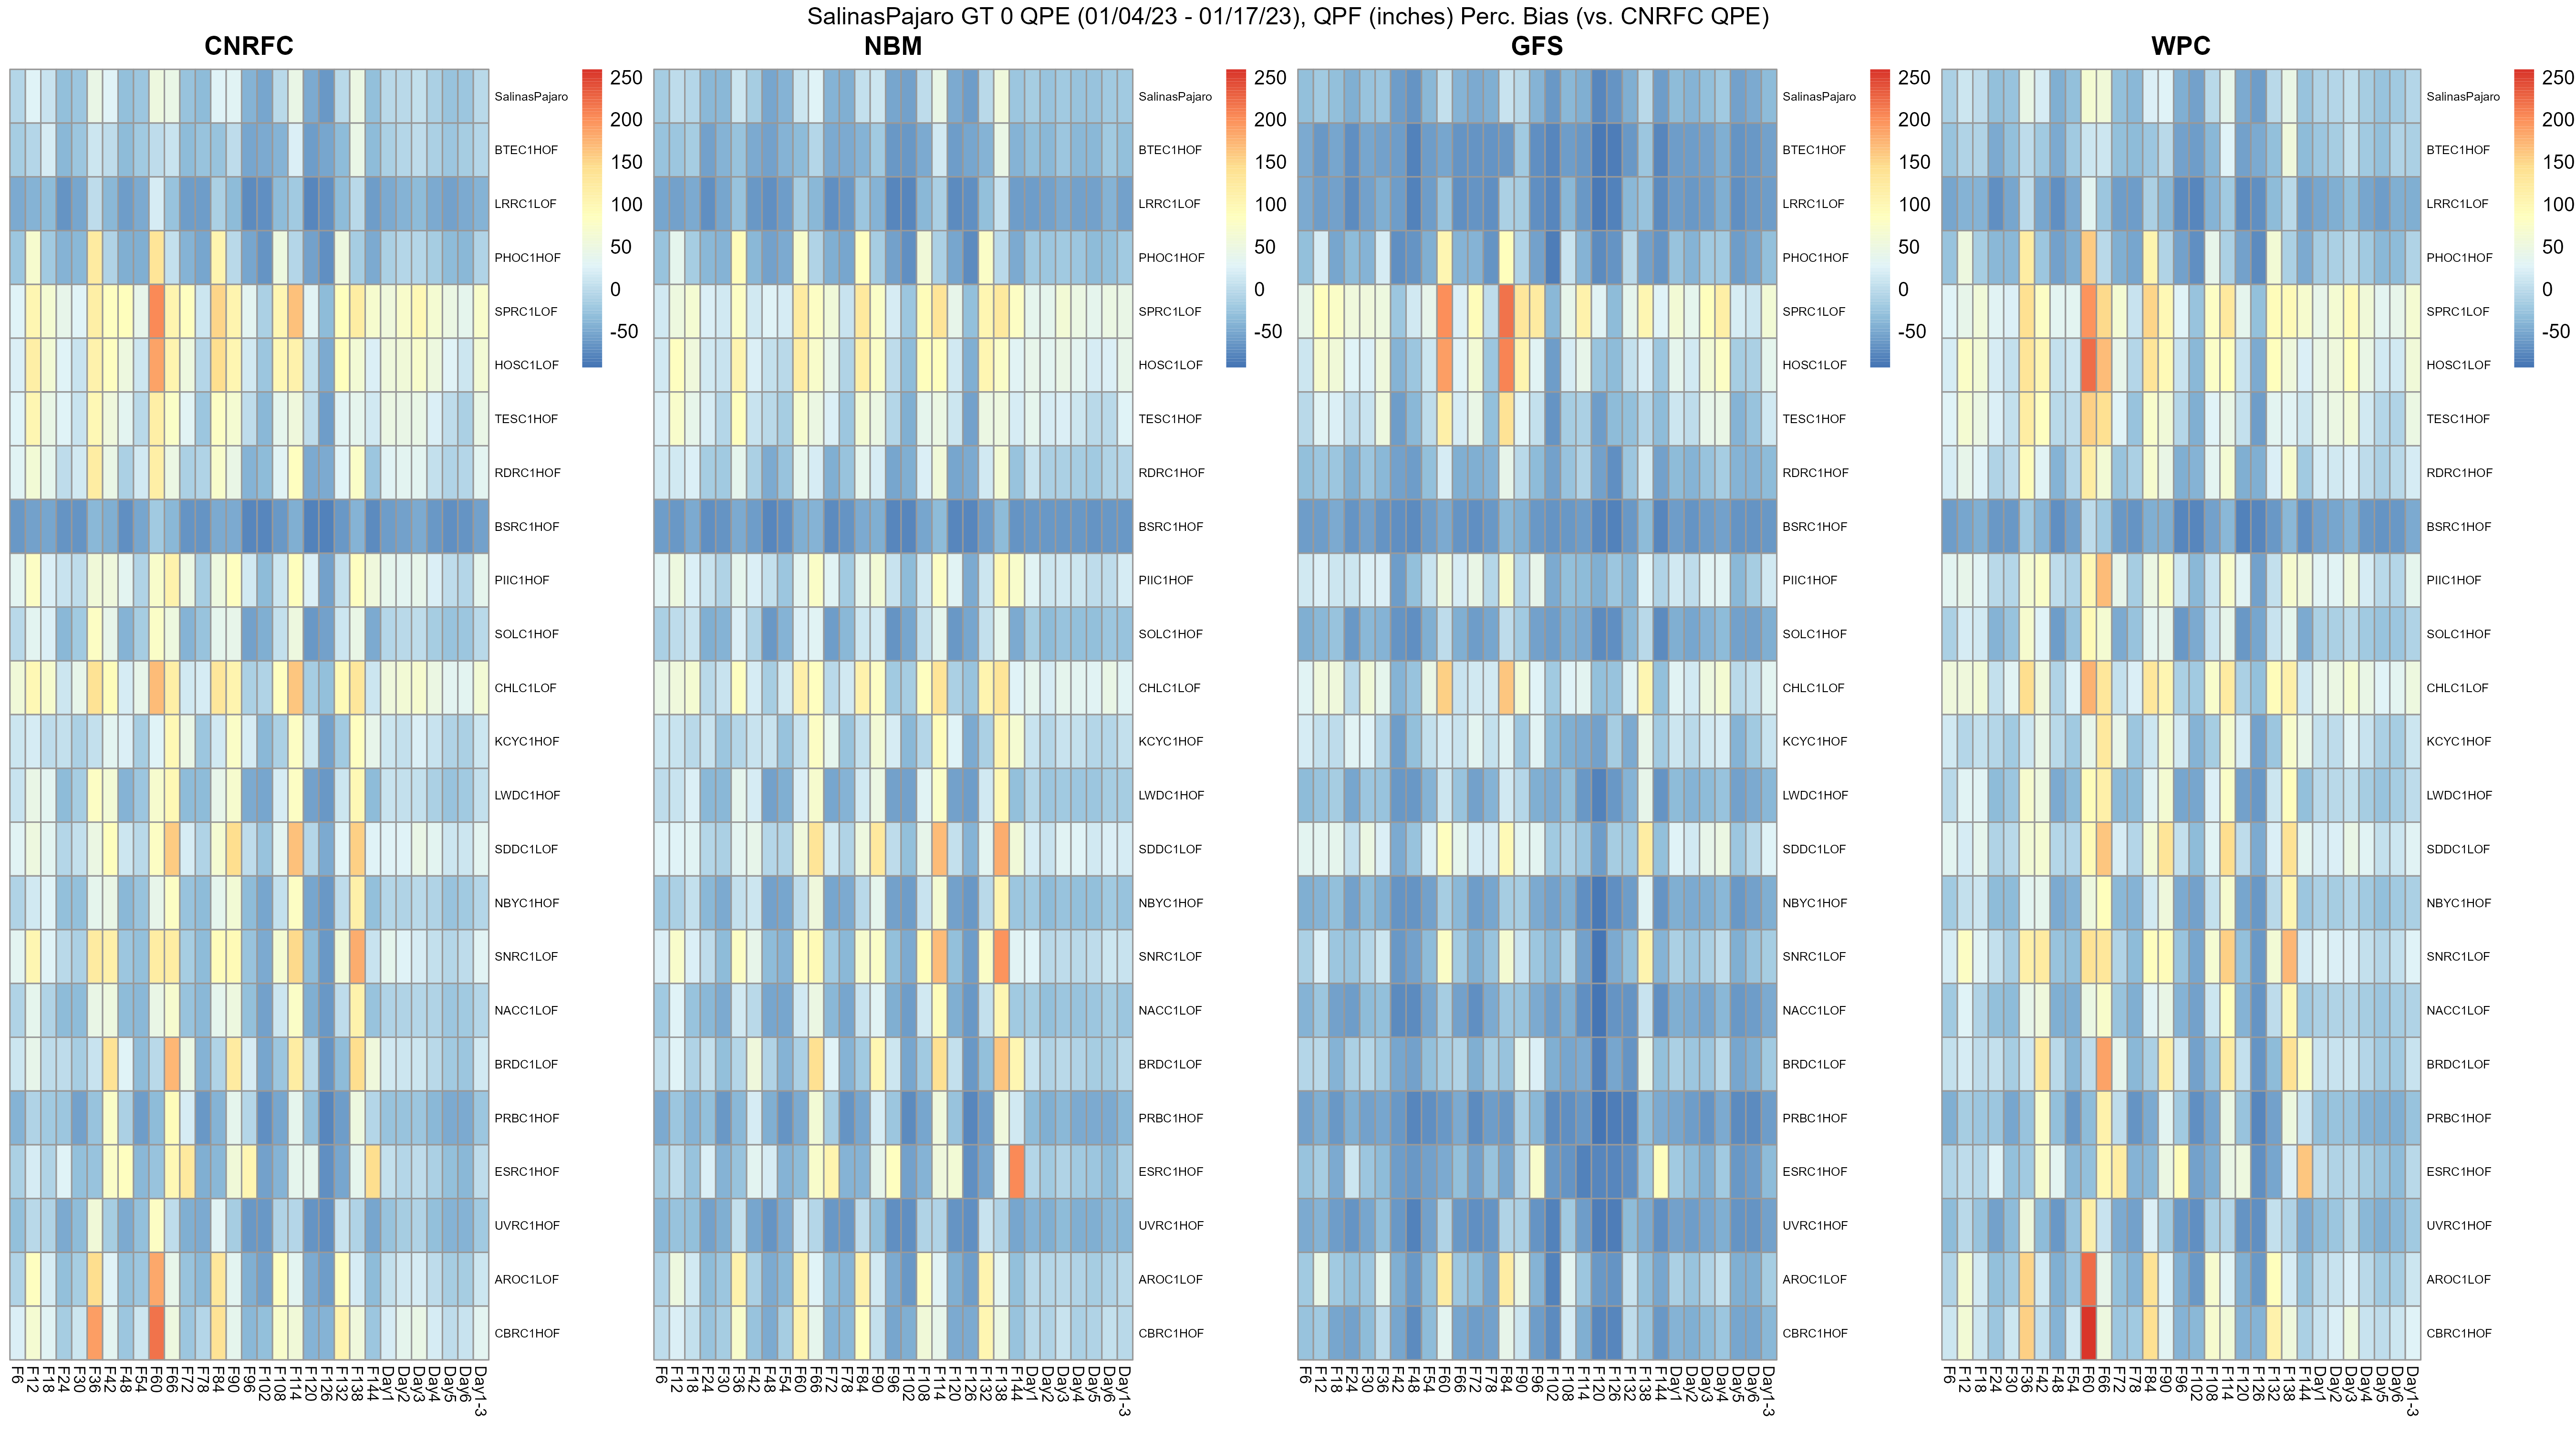 The following takes a closer look at the Tulare forecast group for March 9-16, 2023, when heavy precipitation and flood impacts were observed. Overall, the Tulare forecast group for December 2022 through March 2023 showed little bias for the CNRFC morning QPF forecast, 12Z NBM, WPC, and GFS QPF compared to the CNRFC QPE. Looking closer at individual forecast basins within the Tulare forecast group, there is little bias at many of the points, but others see an overestimate or an underestimate for Days 1-3 total Percent Bias of QPF for the period of December 1, 2022, through March 31, 2023. The biggest overestimate bias for the Kern River at Fairview Dam (KKVC1) basin with an overestimate bias at all elevations in the basin (KKVC1HLF - lower, KKVC1HMF - middle, and KKVC1HUF - upper zones), but with the largest bias at the lowest elevations of the basin (KKVC1HLF, less than 5000 ft) in the CNRFC QPF (33.2%), NBM (18.2%), and WPC (33.1%) QPF. For the GFS, the biggest overestimate (24.3%) was on the South Fork of the Kern River near Onyx (SKRC1) over the upper portion of the basin (SKRC1HUF). The largest underestimates for CNRFC (-40.8%), NBM (-51.2%), WPC (-37.9%) were on the Kern River at Lake Isabella (ISAC1) over the upper portion of the basin (ISAC1LUF). However, there was an underestimate at all elevations. The CNRFC, WPC, NBM, and GFS all underestimated the QPF at Isabella. For the GFS, the biggest underestimate (-38.9%) was on the South Fork Tule River near the Reservation Boundary (TVRC1) at the upper elevations of the basin (TVRC1HUF). There was an underestimate at all elevations for this basin as well. For March 9-16, 2023, bias at all points in the Tulare Basin ranged from near zero to underforecast QPF. Similar to the December through March period, Lake Isabella in the upper portion of the basin (ISAC1LUF) also had the largest bias for the March 9-16, 2023, period: CNRFC QPF (-51.7%), NBM (-60.5%), and WPC (-48.8%). The GFS also had the largest underestimate (-50.8%) at South Fork Tule River near the Reservation Boundary at the upper elevations (TVRC1HUF) for March 9-16, 2023, and for the winter. For the winter at Lake Isabella upper elevations (ISAC1LUF), most of the time periods (forecast hours 6-72 hours) and most of the days, the QPE is quite a bit higher than the model QPF, showing the low QPF forecast by the CNRFC, WPC, NBM, and GFS. For March 9-16, the underestimate of QPF at Lake Isabella was also seen, except at 42 hours (March 9 and 13) and 66 hours (March 12). Overall for the winter, the QPE was sometimes higher and sometimes lower than the CNRFC, NBM, WPC, and GFS for different days and times. For March 9-16, at the Kern River at Fairview Dam lower elevations (KKVC1HLF), the QPE is less than the CNRFC, NBM, and WPC QPF for 6-, 12-, and 18-hr forecasts, but the GFS QPF varies between higher and lower than QPE. The image below displays the Tulare forecast groups' Percent Bias (PBIAS) of QPF for four sources (12Z morning CNRFC, 12Z GFS, NBM, and WPC) versus the CNRFC QPE from December 1, 2022, through March 31, 2023. Click on the image below to enlarge and open in a new tab. 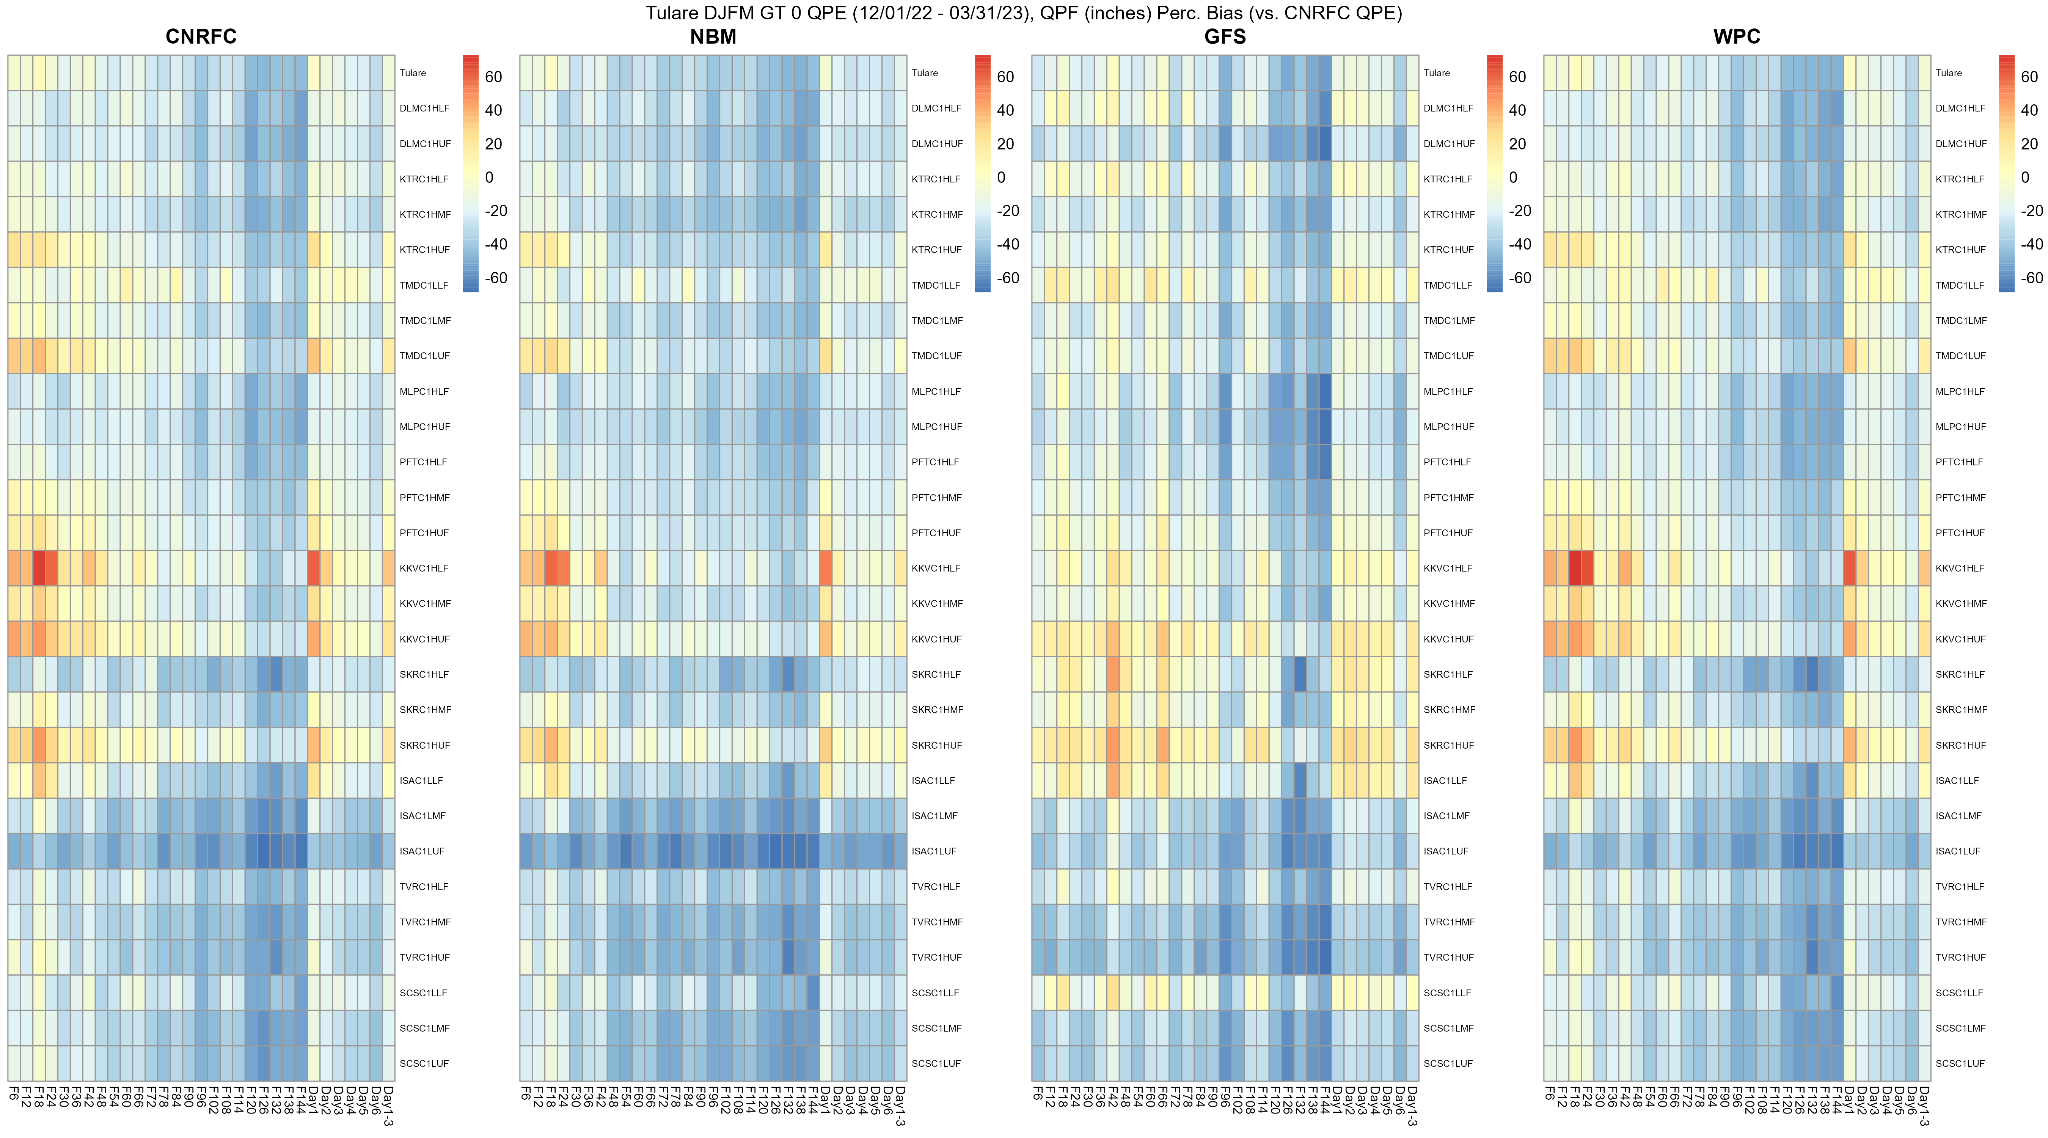 The image below displays the Tulare forecast groups' Percent Bias (PBIAS) of QPF for four sources (12Z morning CNRFC, 12Z GFS, NBM, and WPC) versus the CNRFC QPE from March 9, 2023, through March 16, 2023. Click on the image below to enlarge and open in a new tab.  The image below displays 6-hour QPF amounts for the CNRFC, GFS, NBM, and WPC, along with 6-hour QPE amounts out to 72 hours (3 days) for the Kern River - Lake Isabella (ISAC1) basin (upper elevations of the basin) from December 1, 2022, though March 31, 2023. Click on the image below to enlarge and open in a new tab.  The image below displays 6-hour QPF amounts for the CNRFC, GFS, NBM, and WPC, along with 6-hour QPE amounts out to 72 hours (3 days) for the Kern River - Lake Isabella (ISAC1) basin (upper elevations of the basin) from March 9, 2023, though March 16, 2023. Click on the image below to enlarge and open in a new tab. 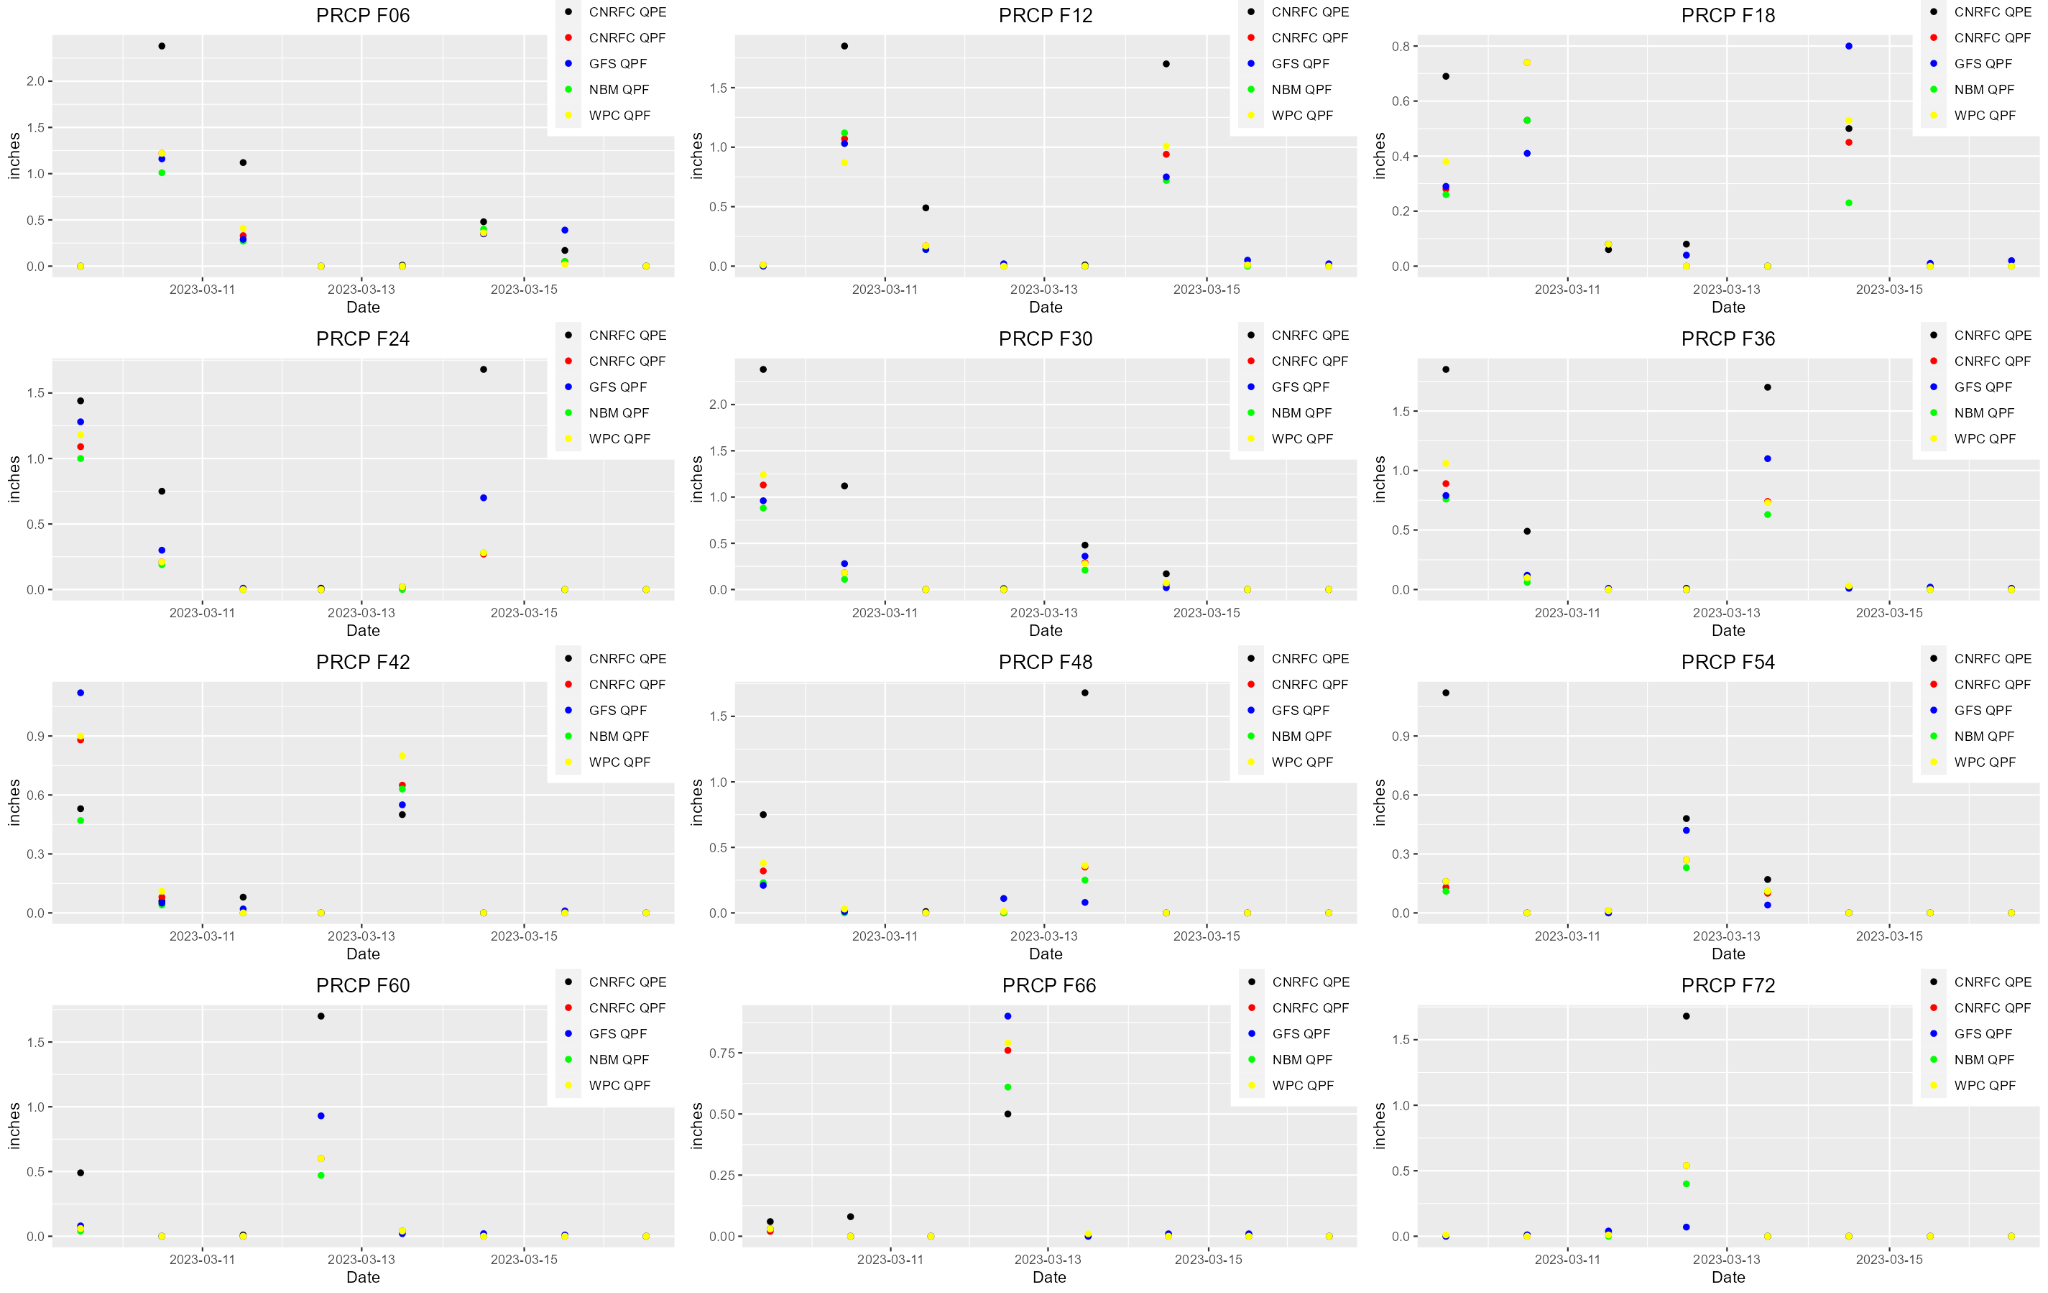 The image below displays 6-hour QPF amounts for the CNRFC, GFS, NBM, and WPC, along with 6-hour QPE amounts out to 72 hours (3 days) for the Kern River - Fairview Dam (KKVC1) basin (lower elevations of the basin) from December 1, 2022, though March 31, 2023. Click on the image below to enlarge and open in a new tab. 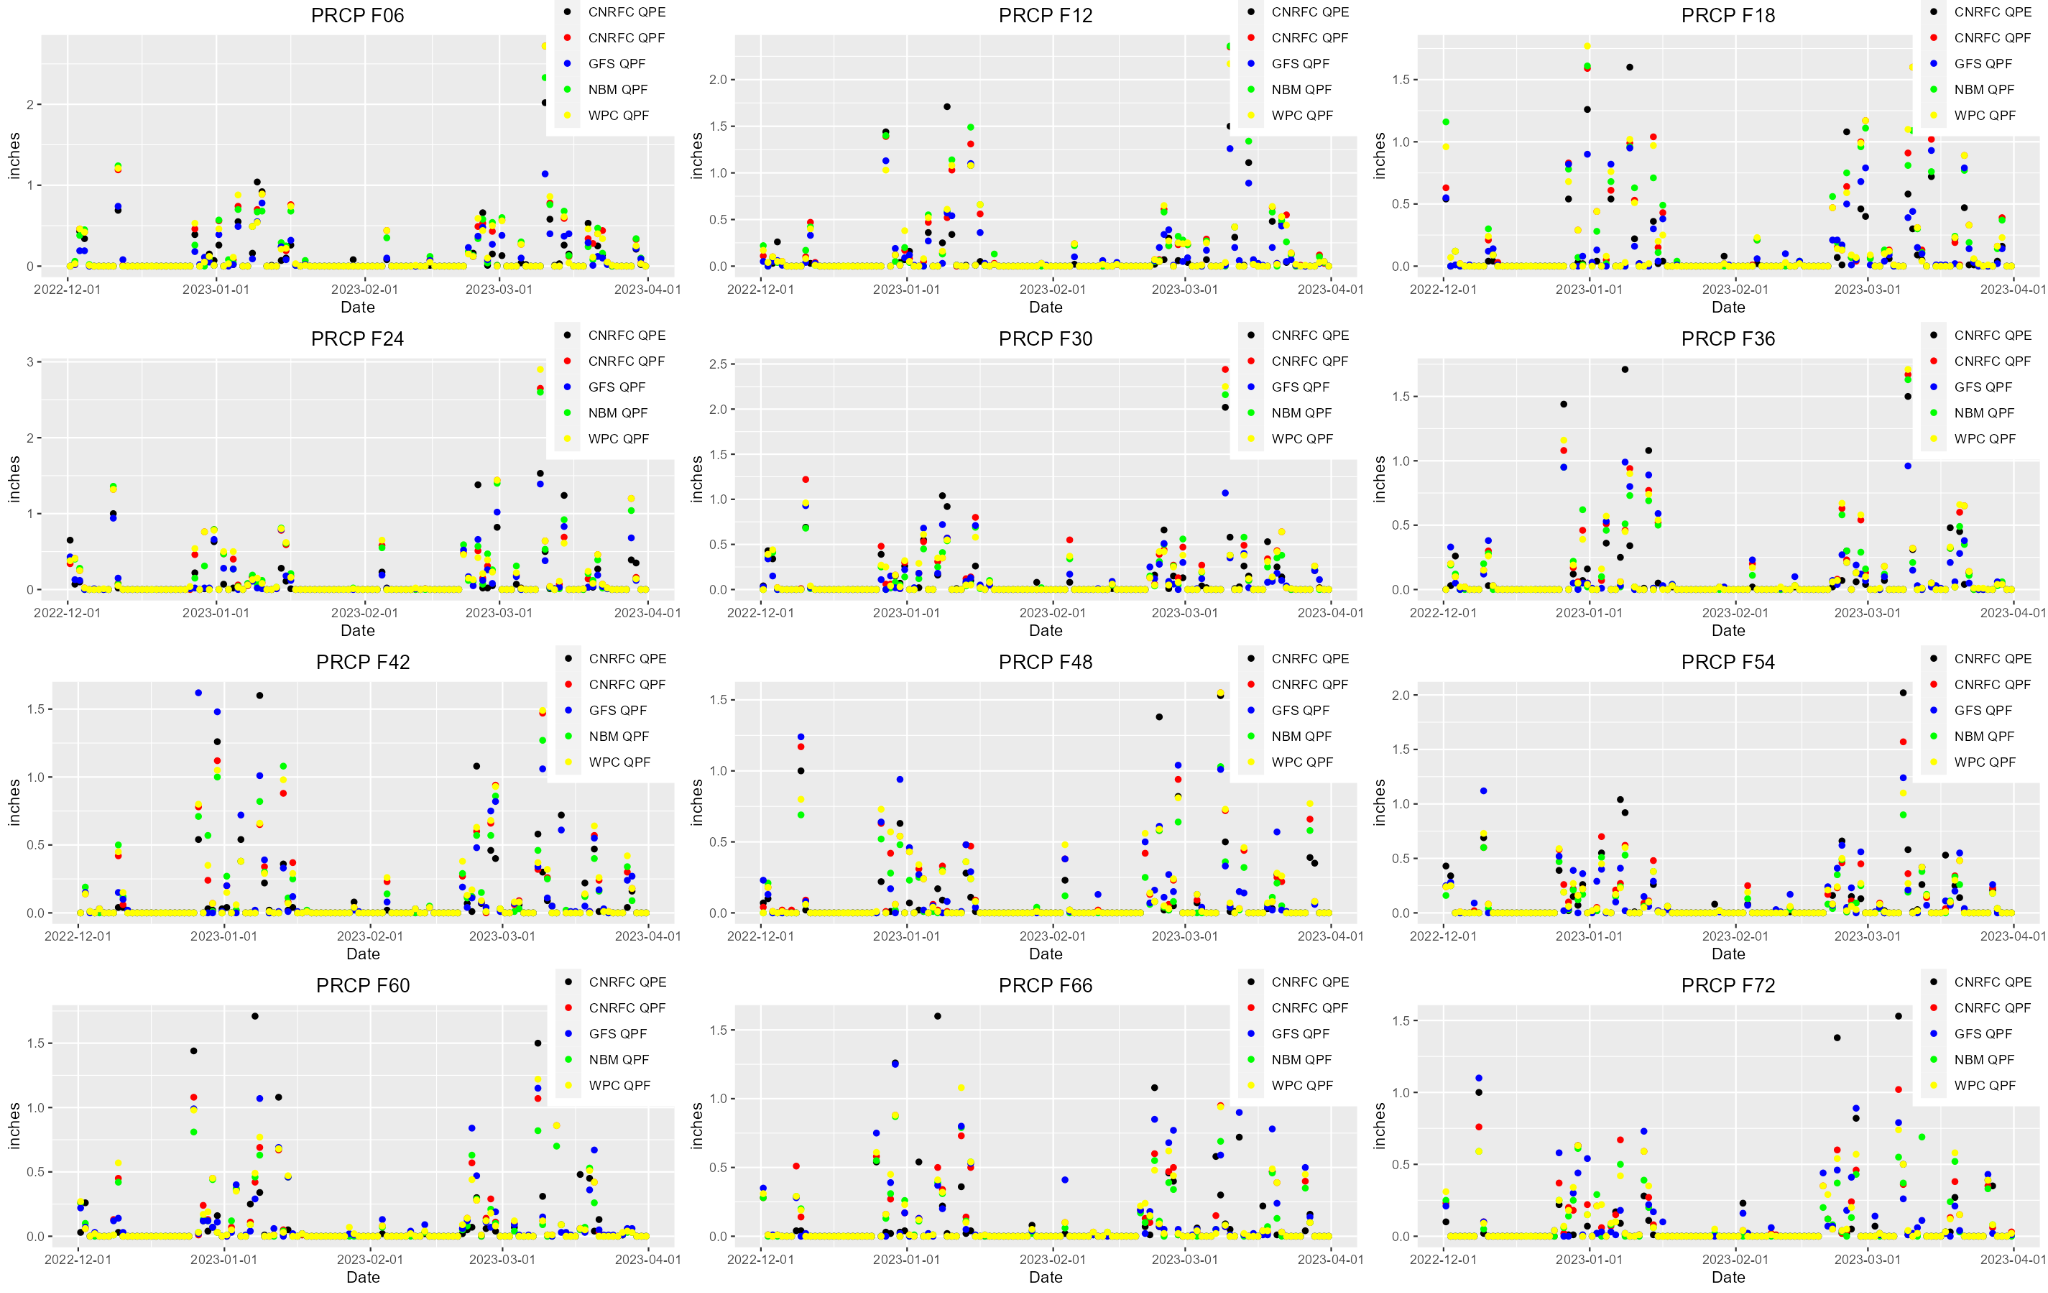 The image below displays 6-hour QPF amounts for the CNRFC, GFS, NBM, and WPC, along with 6-hour QPE amounts out to 72 hours (3 days) for the Kern River - Fairview Dam (KKVC1) basin (lower elevations of the basin) from March 9, 2023, though March 16, 2023. Click on the image below to enlarge and open in a new tab. 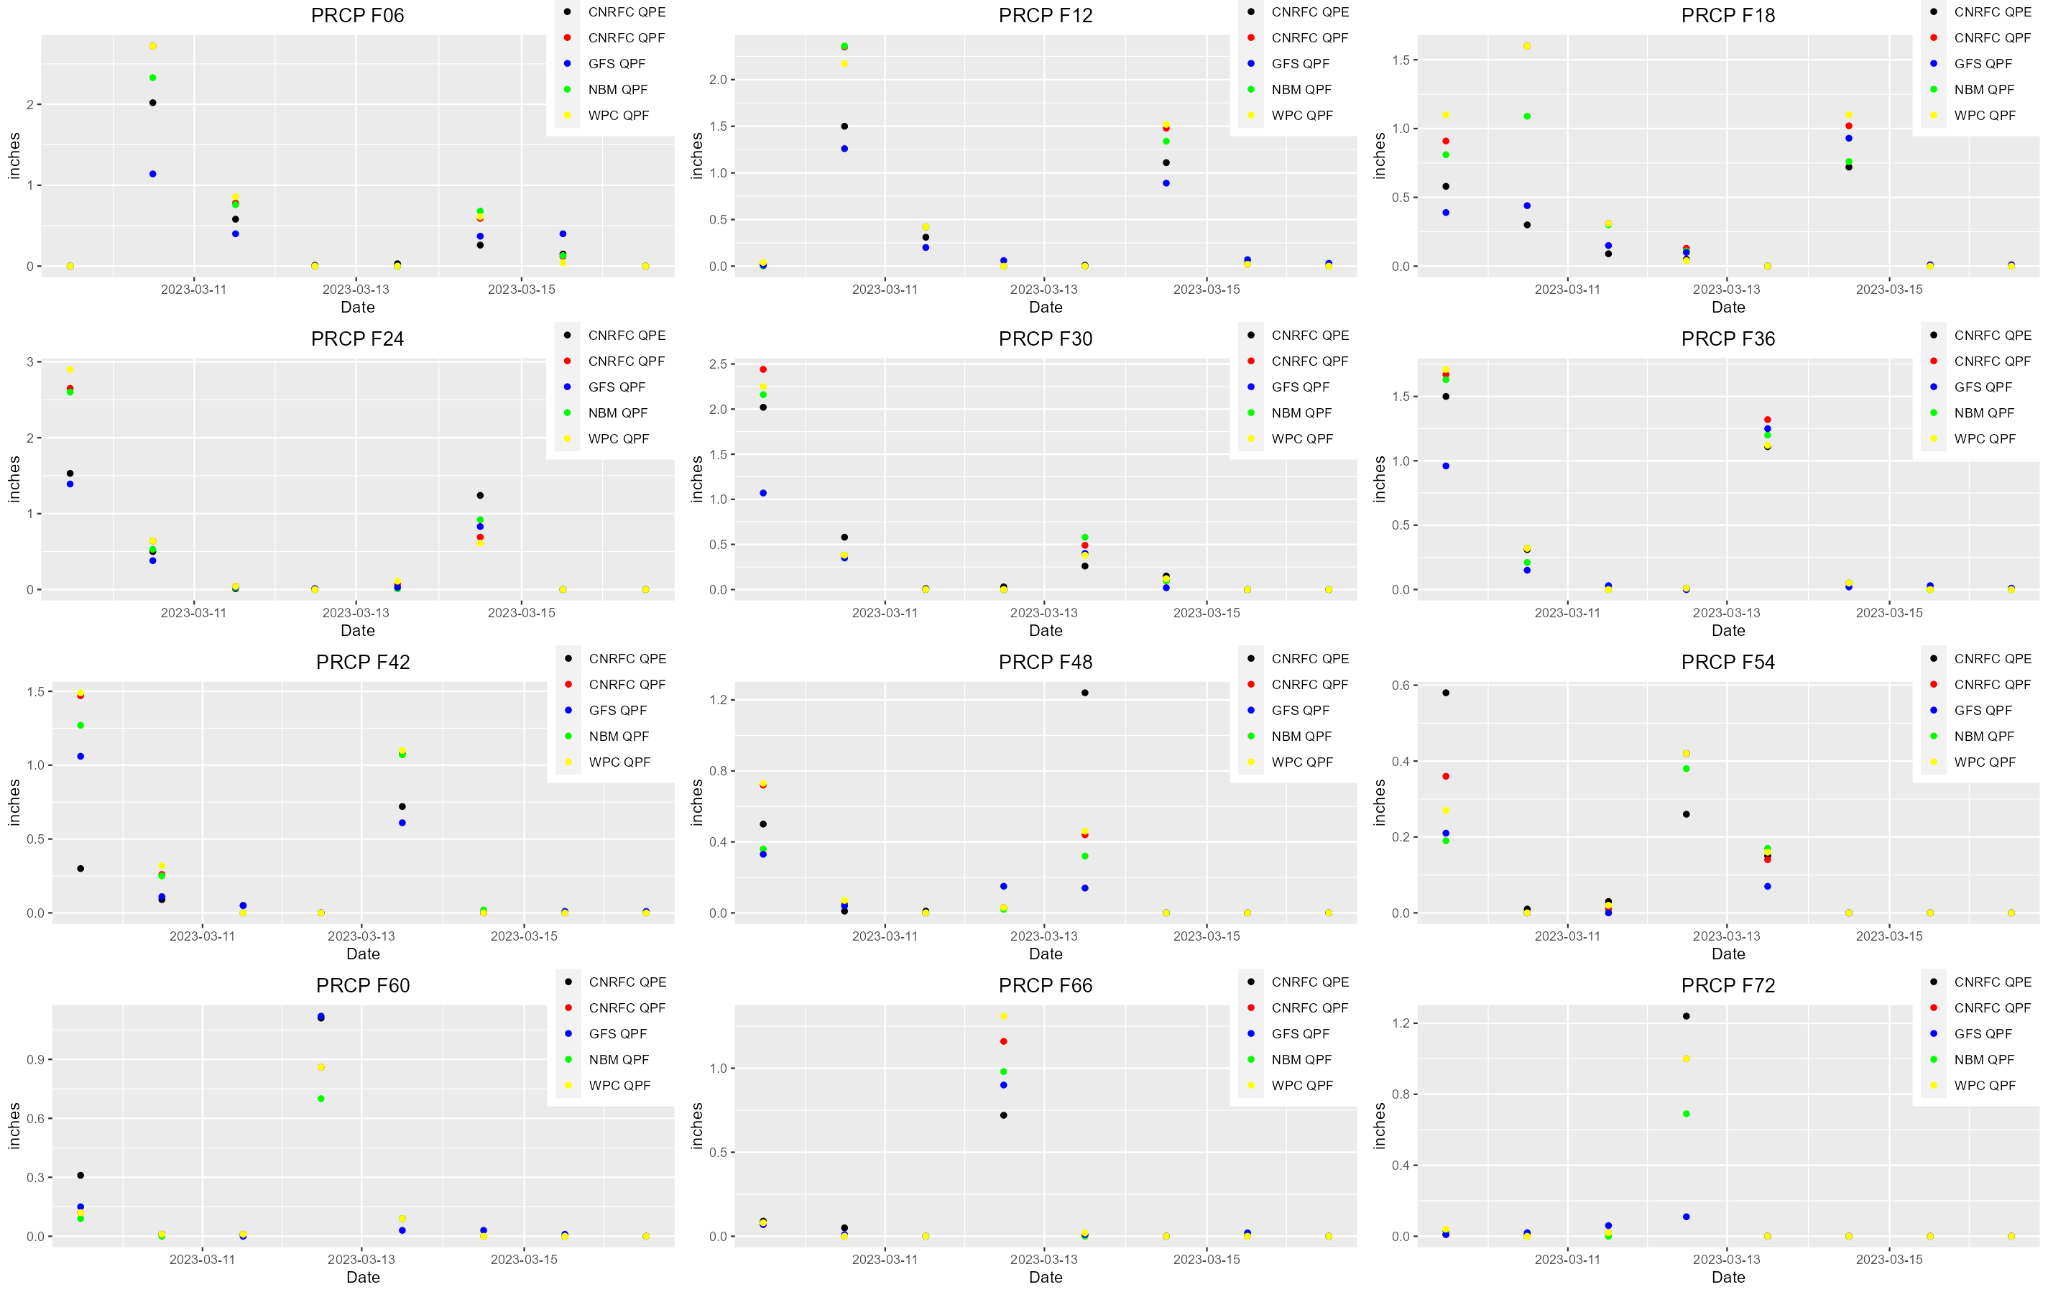 CNRFC River Forecast Groups: Days 4-6 Totals Overall, the CNRFC QPF for the 17 river forecast groups verified the best for days 4-6 when looking at MAE, RMSE, and HSS when compared to the WPC, NBM, and GFS QPF. Looking at the PBIAS, overall the CNRFC has the least bias for Day 4 compared to the WPC, GFS, and NBM QPF. For Day 5, the GFS had the least bias for slightly more forecast groups than the CNRFC. Finally, on Day 6, the NBM had the least bias for more of the forecast groups compared to the CNRFC, GFS, and WPC QPF. CNRFC QPF generally does better for days 4-6, but tends to underestimate more on days 5 and 6, with the exception of an overestimate for the Klamath, East Sierra, Feather/Yuba, and Lower Sacramento forecast groups. Morning Versus Afternoon Forecasts During the winter operations season (November 1 through April 15) on weekdays, the CNRFC typically issues at least two forecasts per day, one in the morning and one in the afternoon. For verification purposes, only the CNRFC and GFS QPF were available for the afternoon forecast (18Z). Looking at most of the forecast groups, the afternoon forecasts had less bias (looking at the PBIAS) than the morning forecasts for Day 1. For Days 2 and 3, the least forecast bias was more equally divided between morning and afternoon forecasts (9 forecast groups for the 12Z issuance, and 8 forecast groups for the 18Z issuance). The morning forecasts generally have less bias than the afternoon forecasts for Days 4-6. The morning forecasts generally have a lower Mean Absolute Error (MAE), except on Day 4 where more forecast groups have lower MAE in the afternoon (9 forecast groups at 18Z issuance and 7 forecast groups at 12Z issuance). The morning forecasts generally had a lower Root Mean Squared Error (RMSE) than the afternoon forecasts, but was more equally divided on Day 4 (9 forecast groups for the 12Z issuance and 7 forecast groups for the 18Z issuance). Overall, the morning forecasts tend to verify better than the afternoon forecasts using the PBIAS, MAE, and RMSE. The images below display the individual river forecast group Mean Absolute Error (MAE) for Days 1-6 for CNRFC morning forecasts (12Z), 12Z GFS, NBM, WPC, CNRFC afternoon forecasts (18Z), and 18Z GFS. Click on the individual images below to enlarge and open in a new tab. 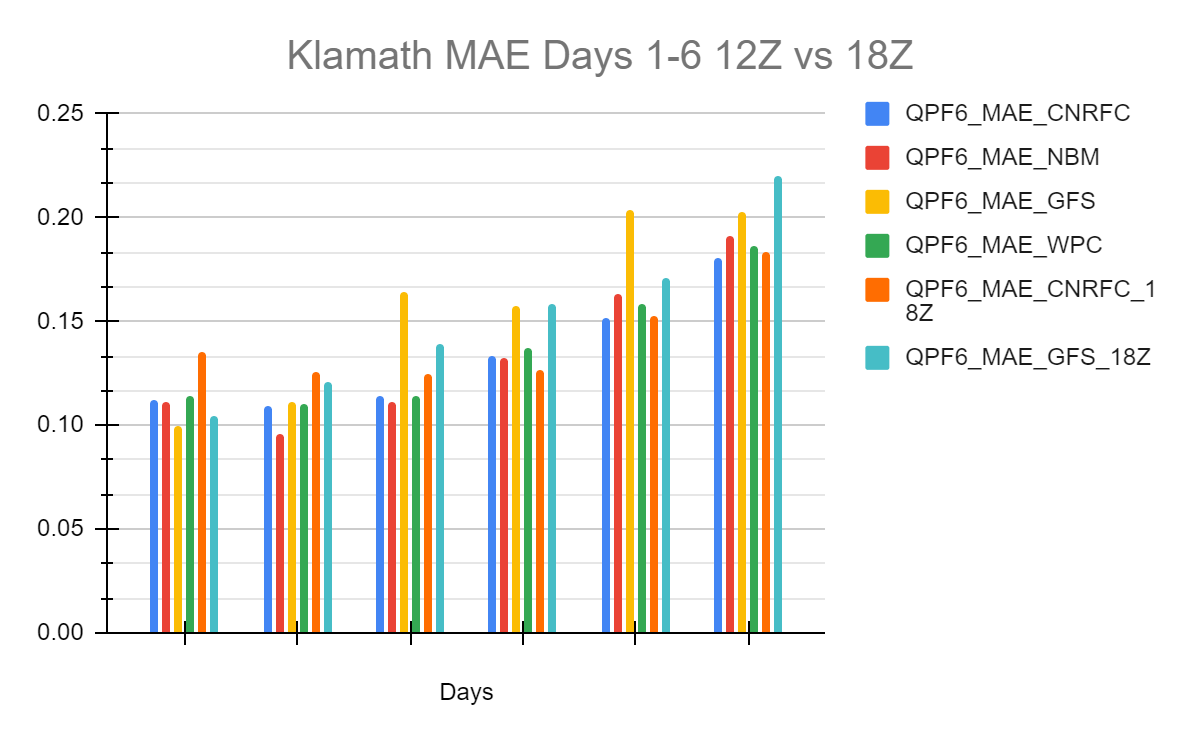 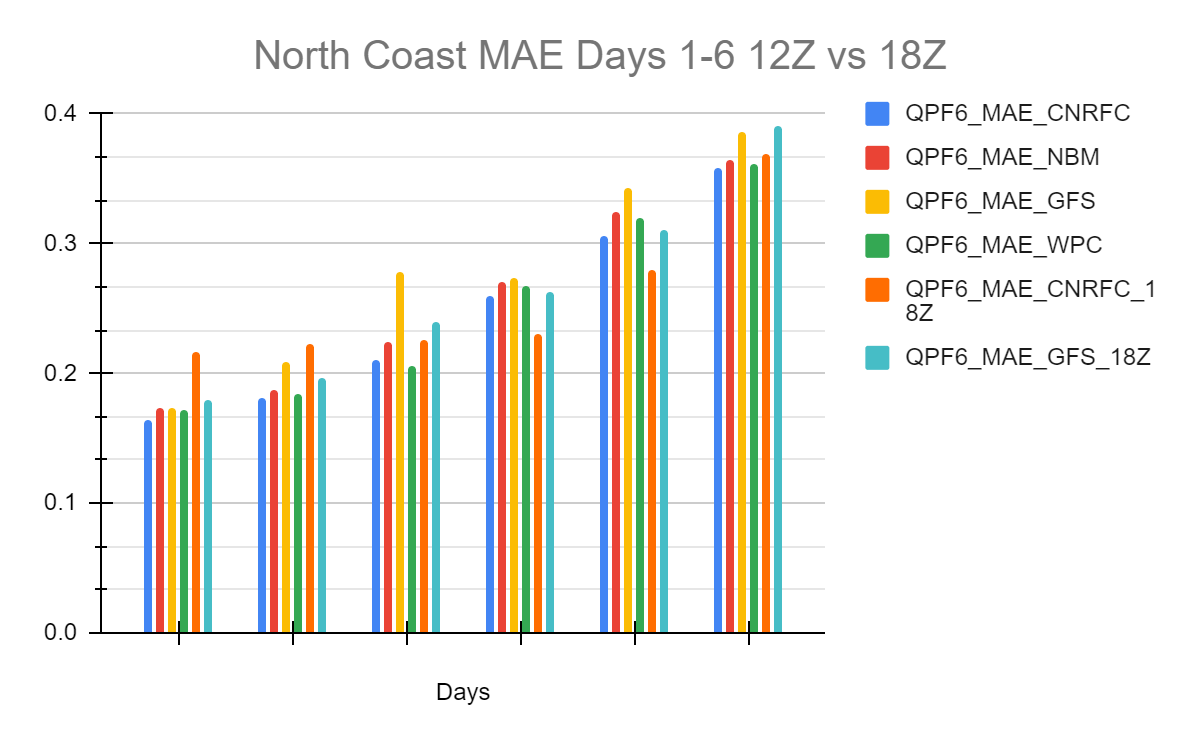 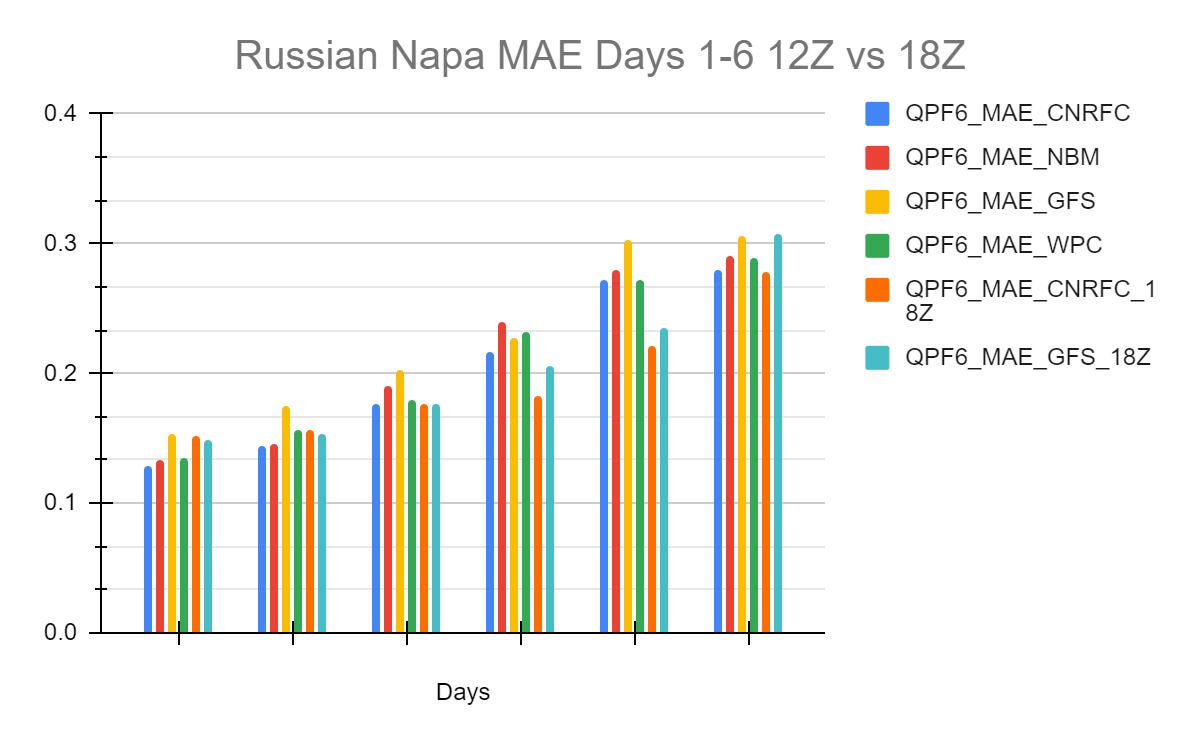 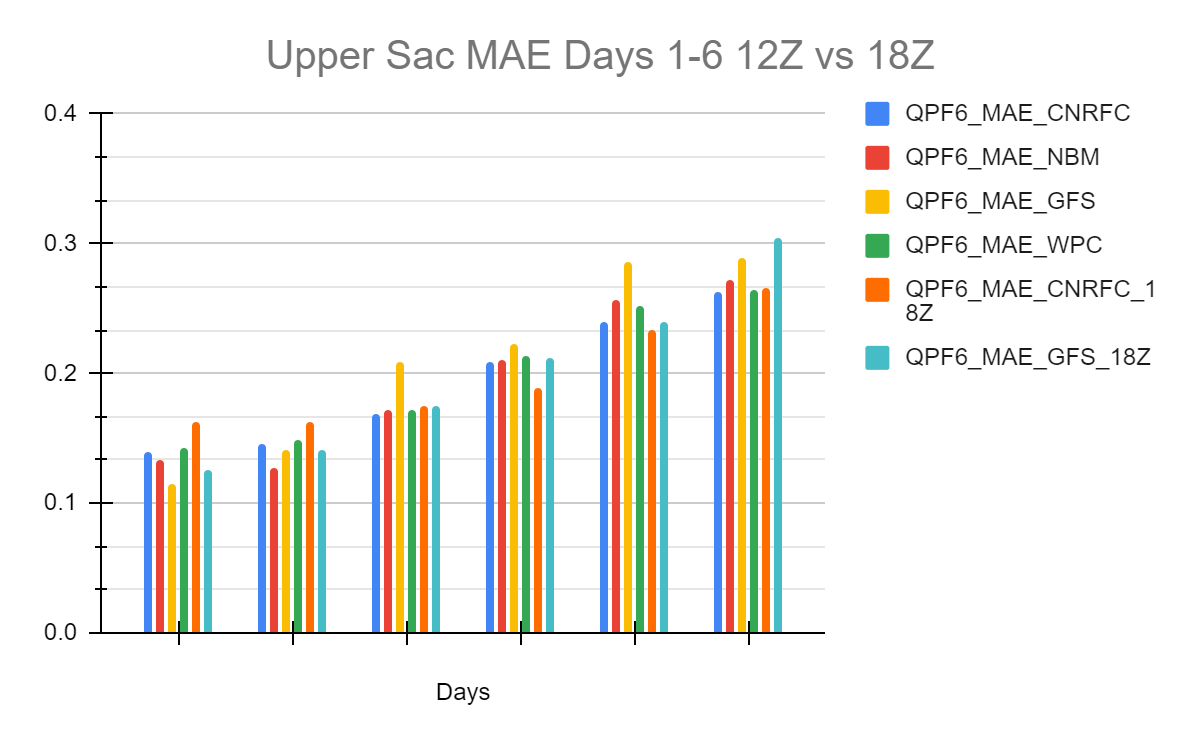 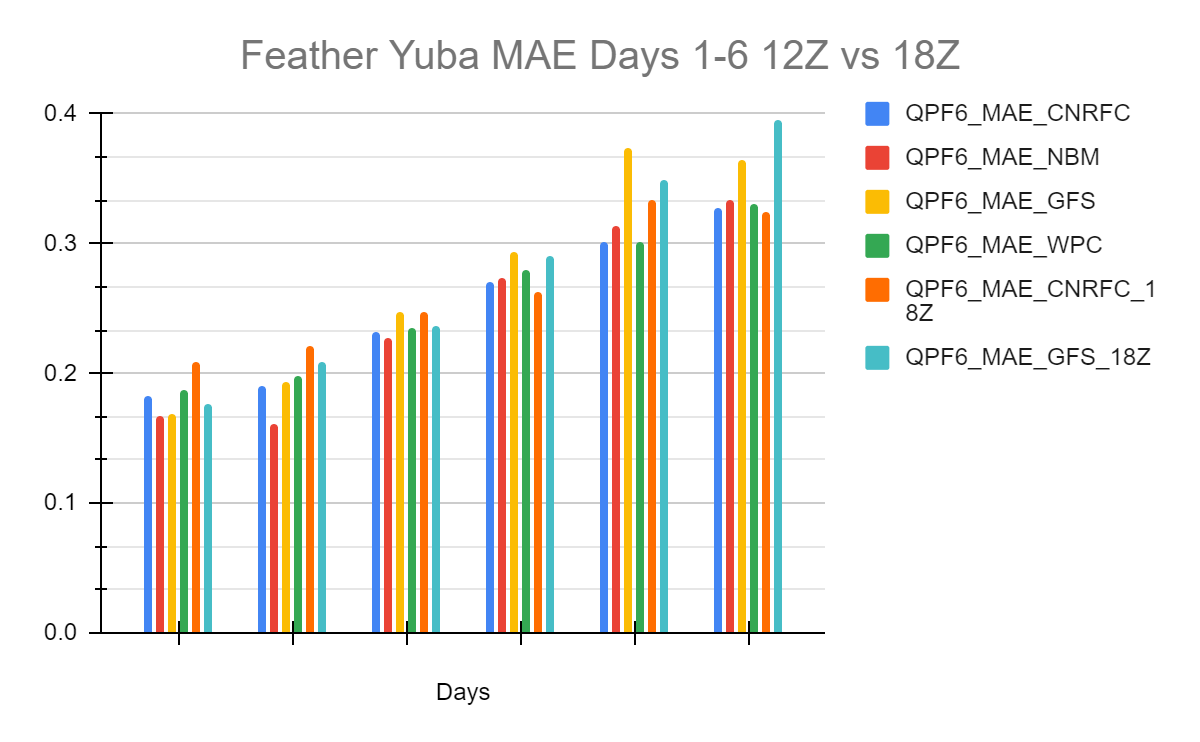 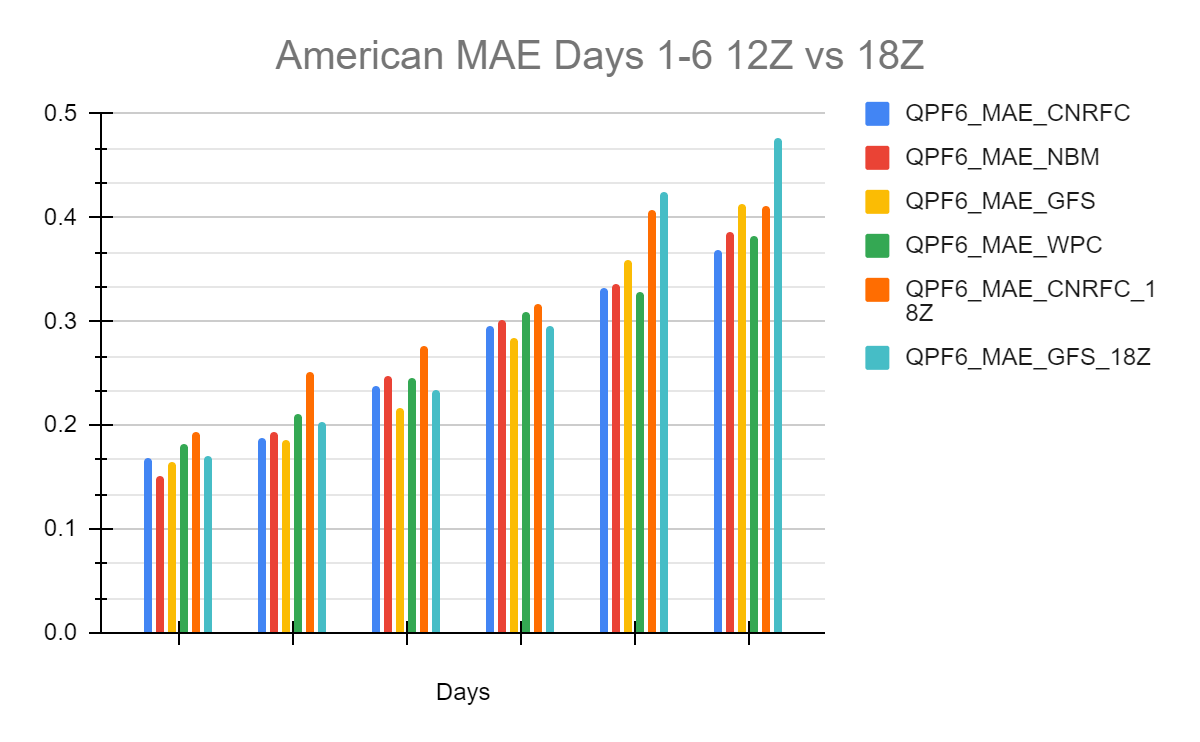 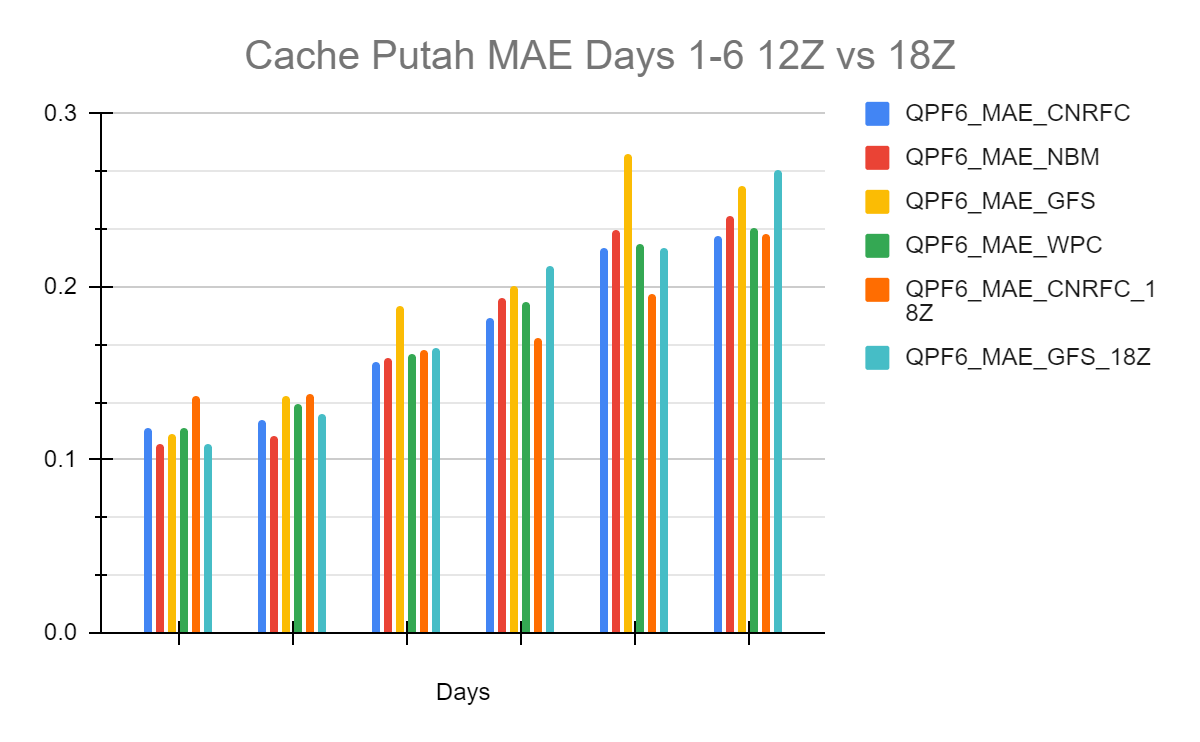 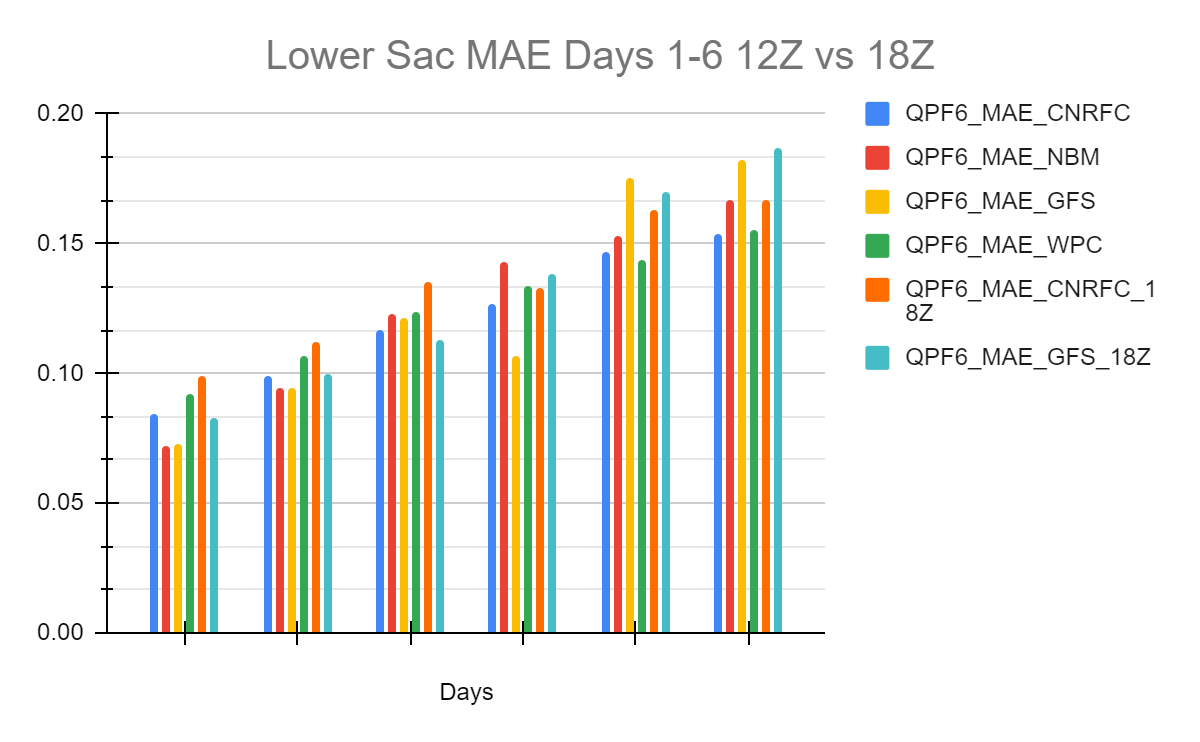  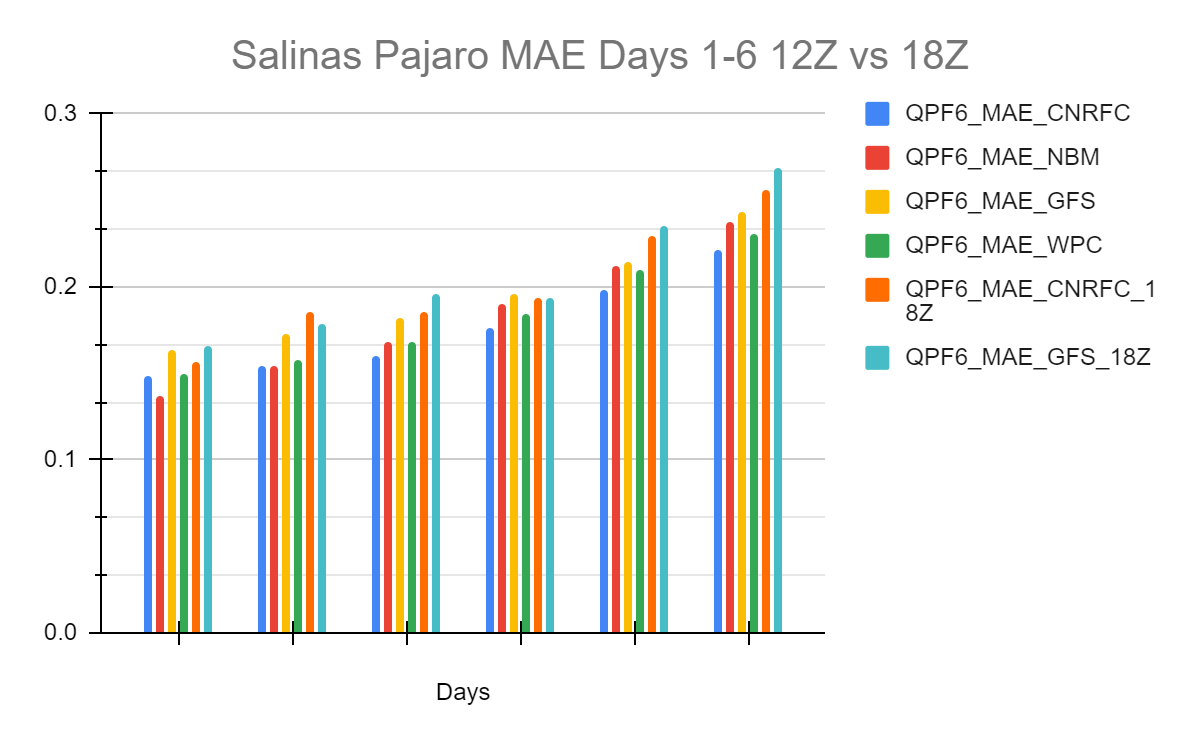 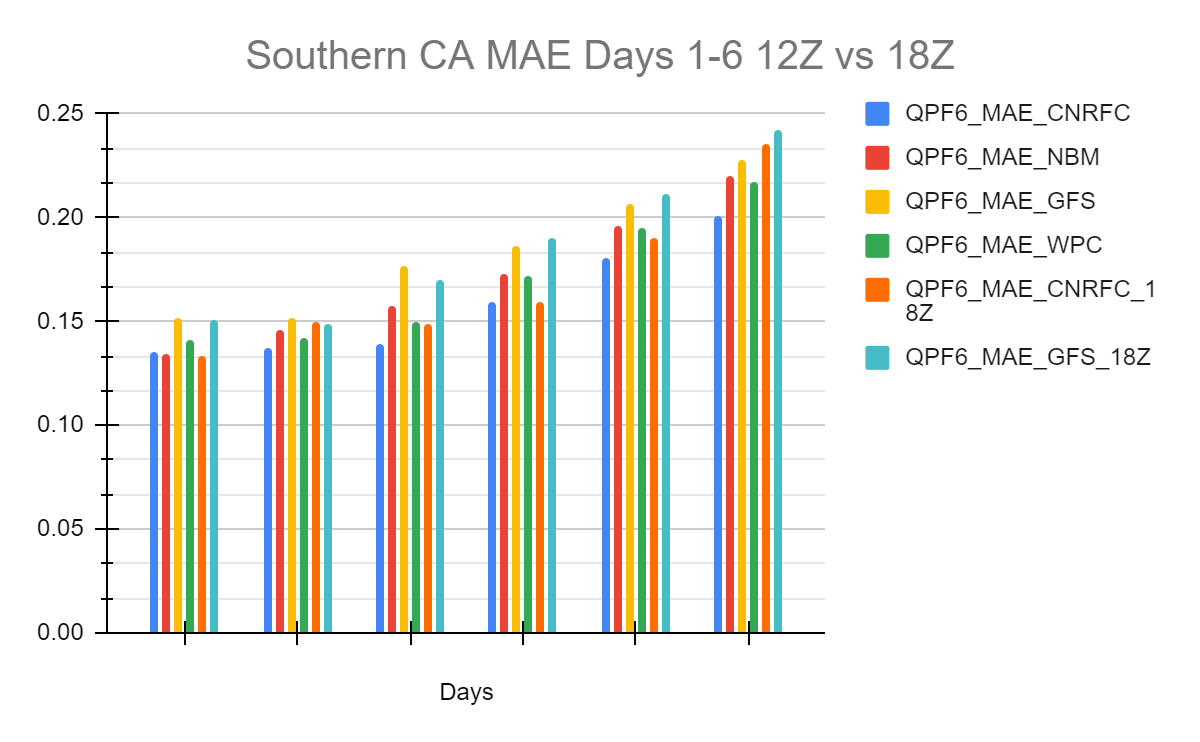 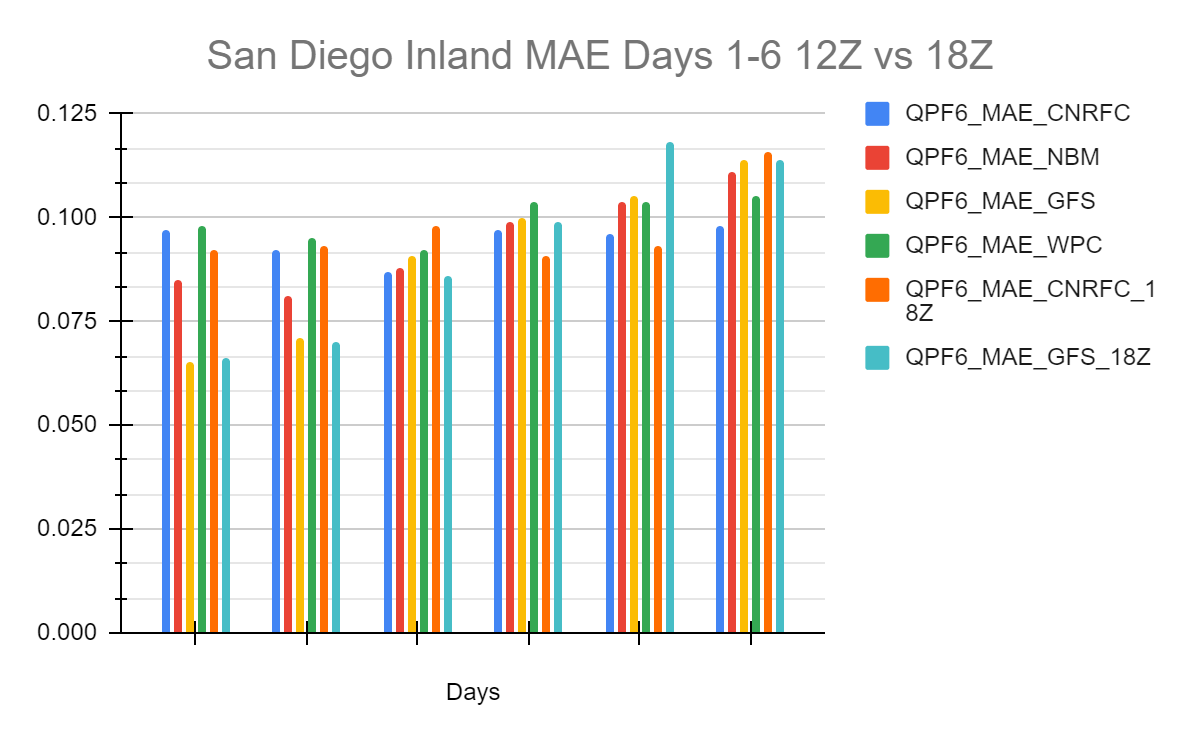 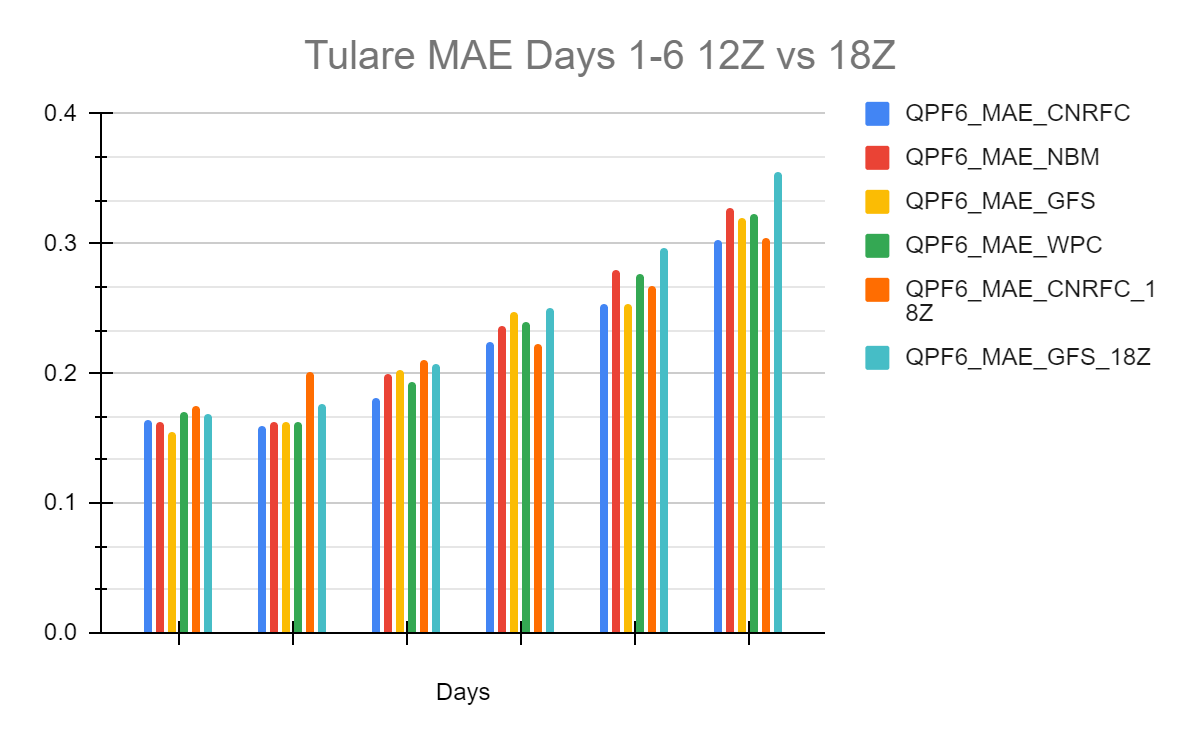 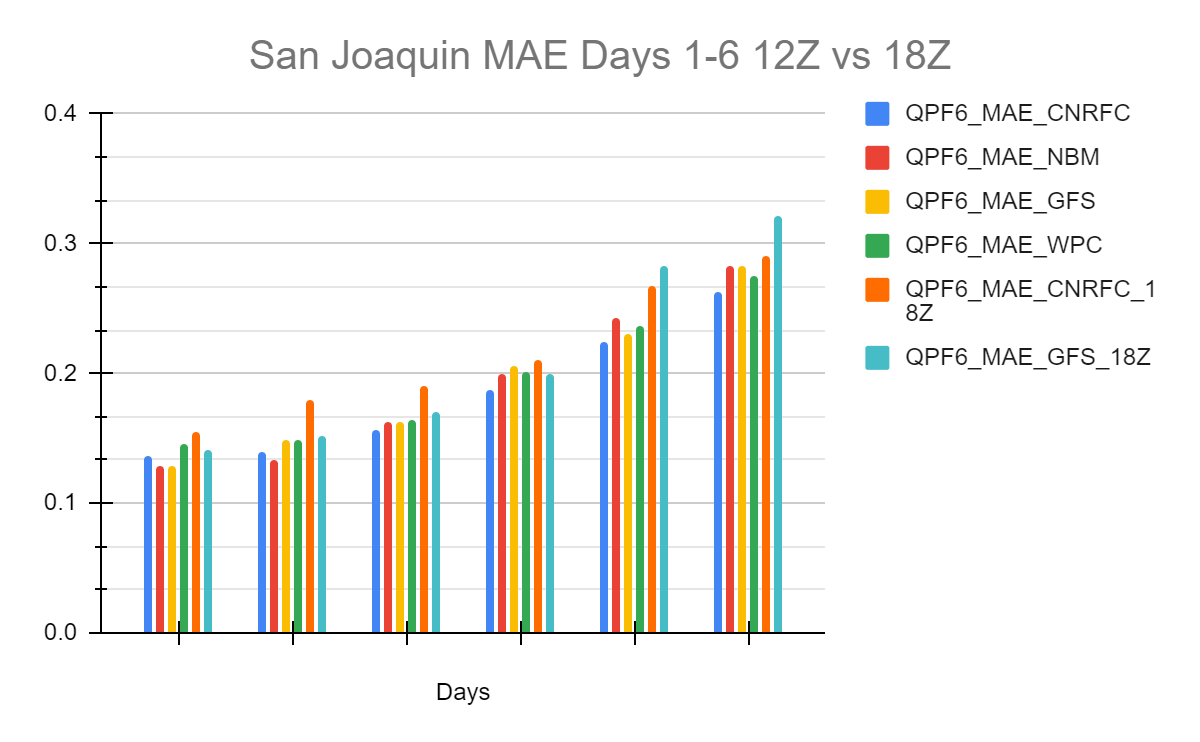 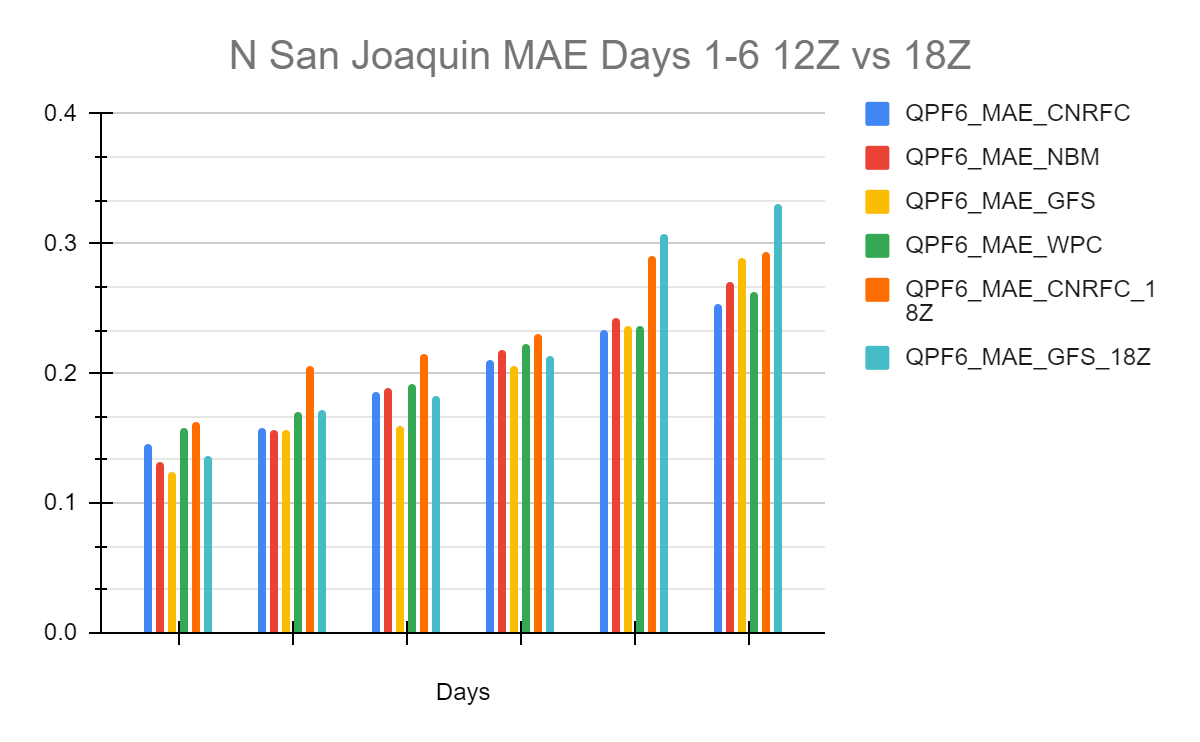 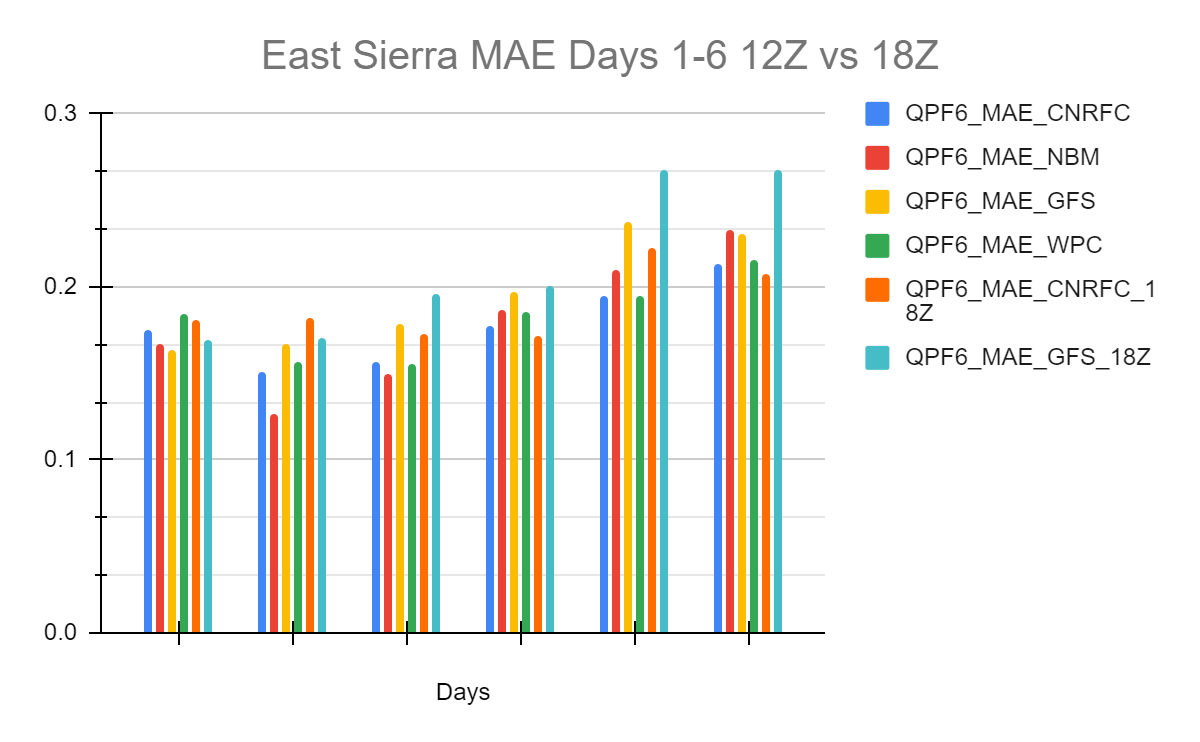 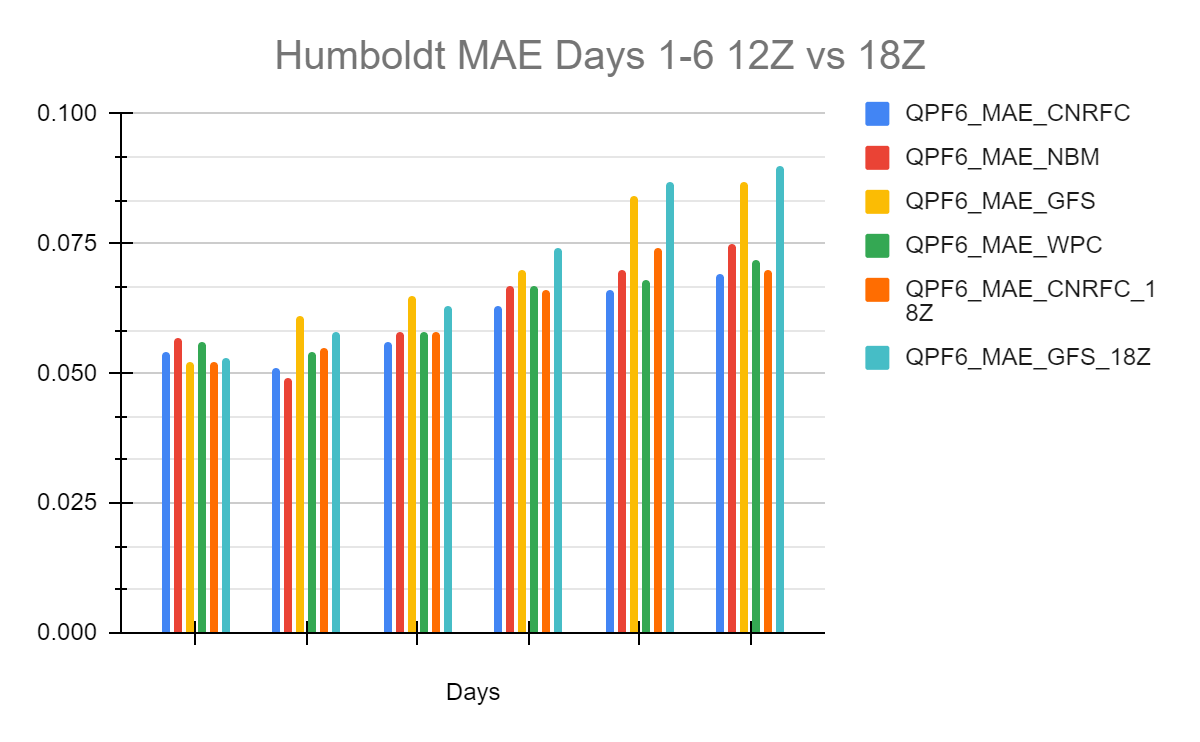 The images below display the individual river forecast group Root Mean Squared Error (RMSE) for Days 1-6 for CNRFC morning forecasts (12Z), 12Z GFS, NBM, WPC, CNRFC afternoon forecasts (18Z), and 18Z GFS. Click on the individual images below to enlarge and open in a new tab. 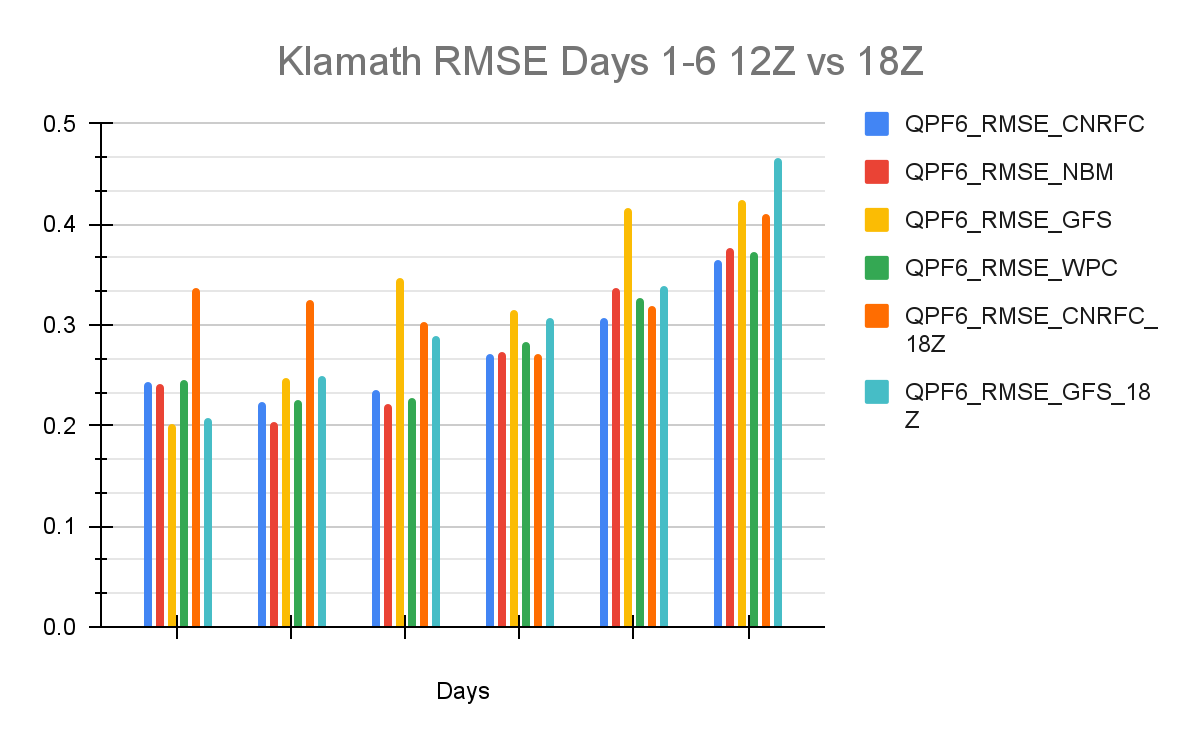  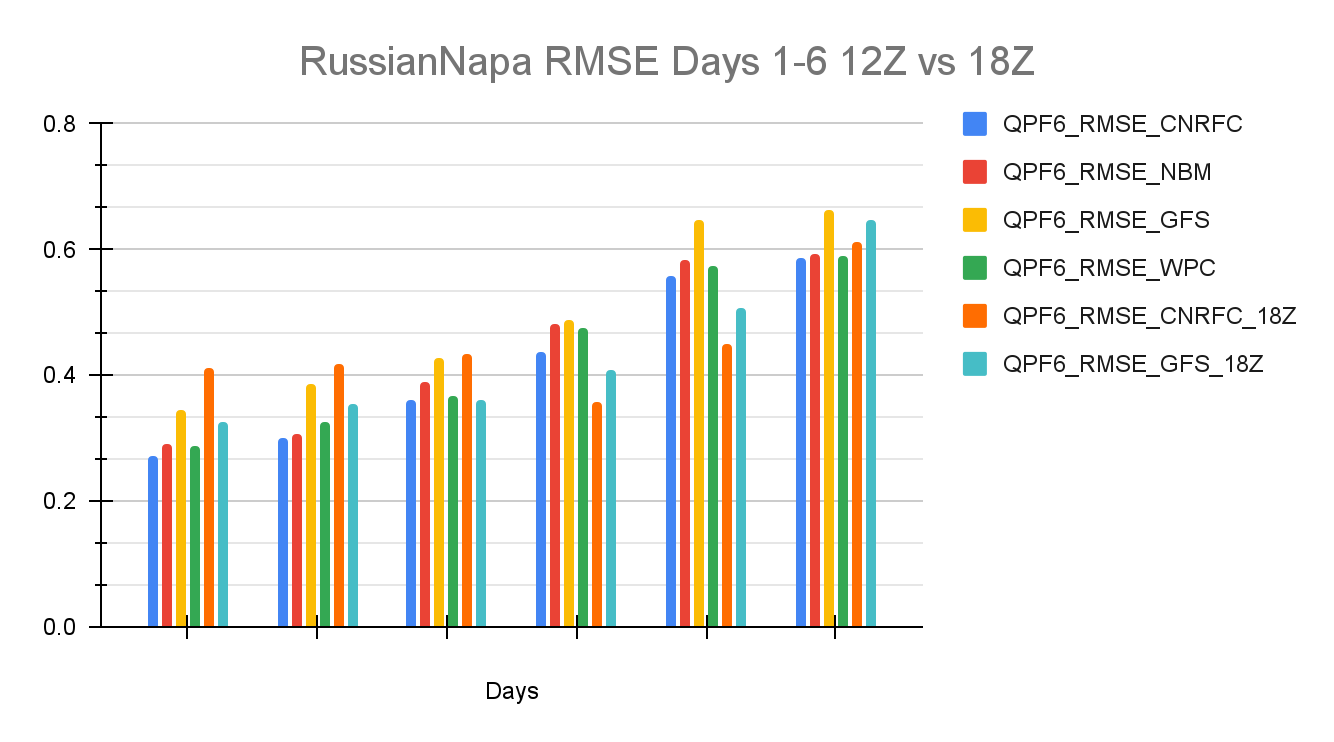 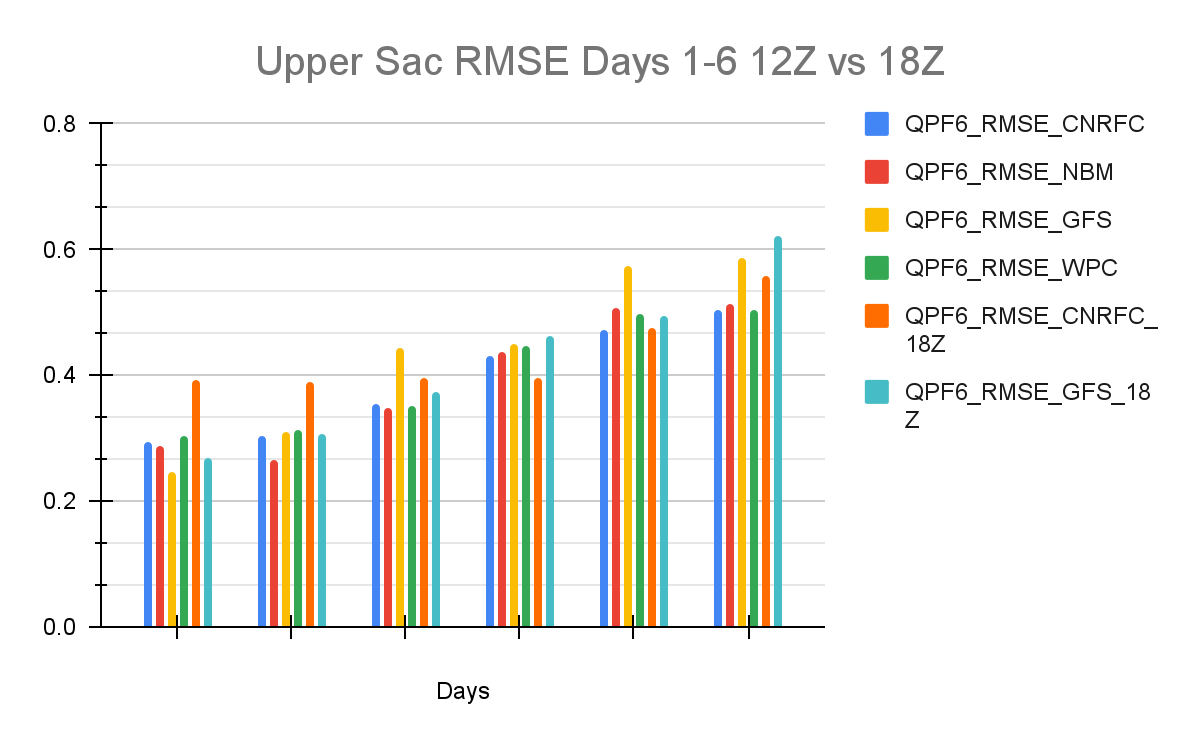 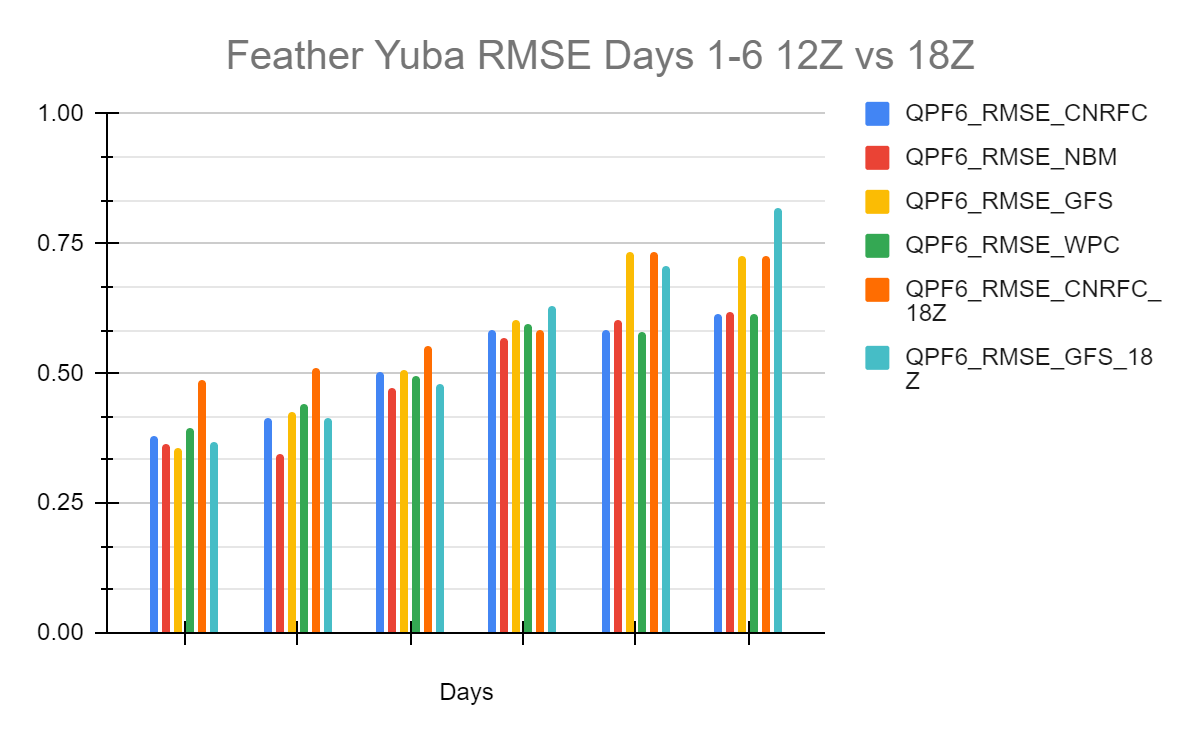 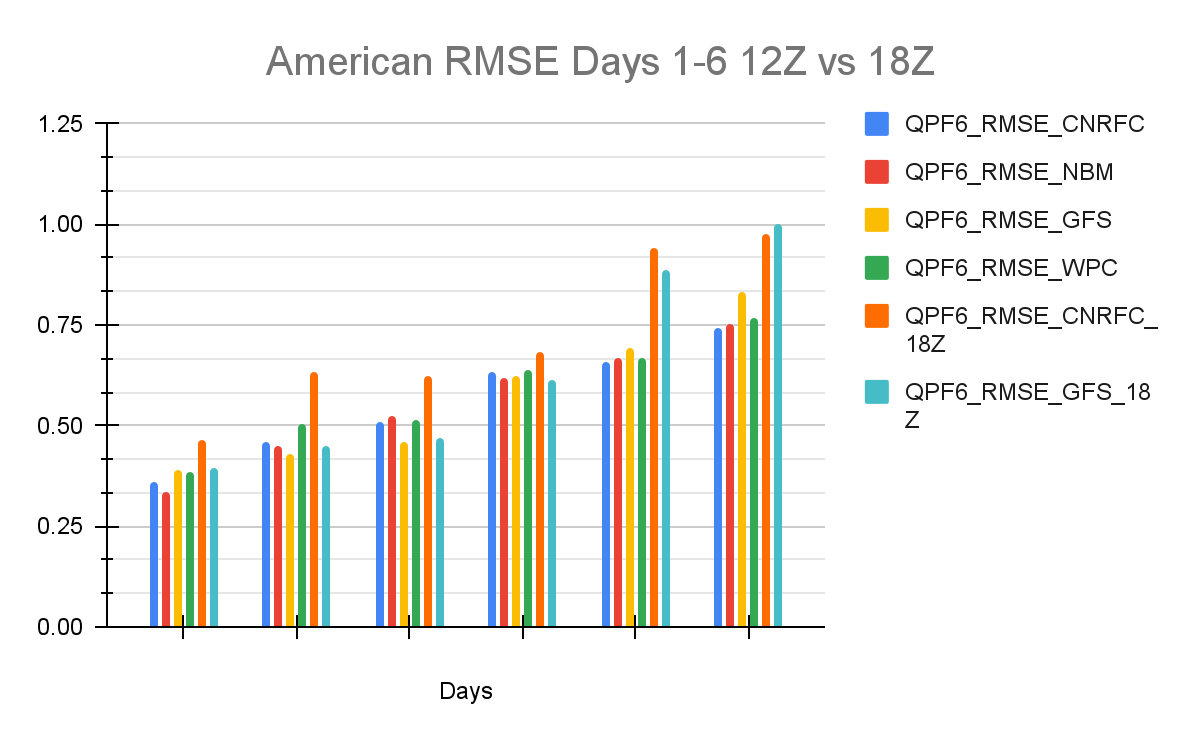 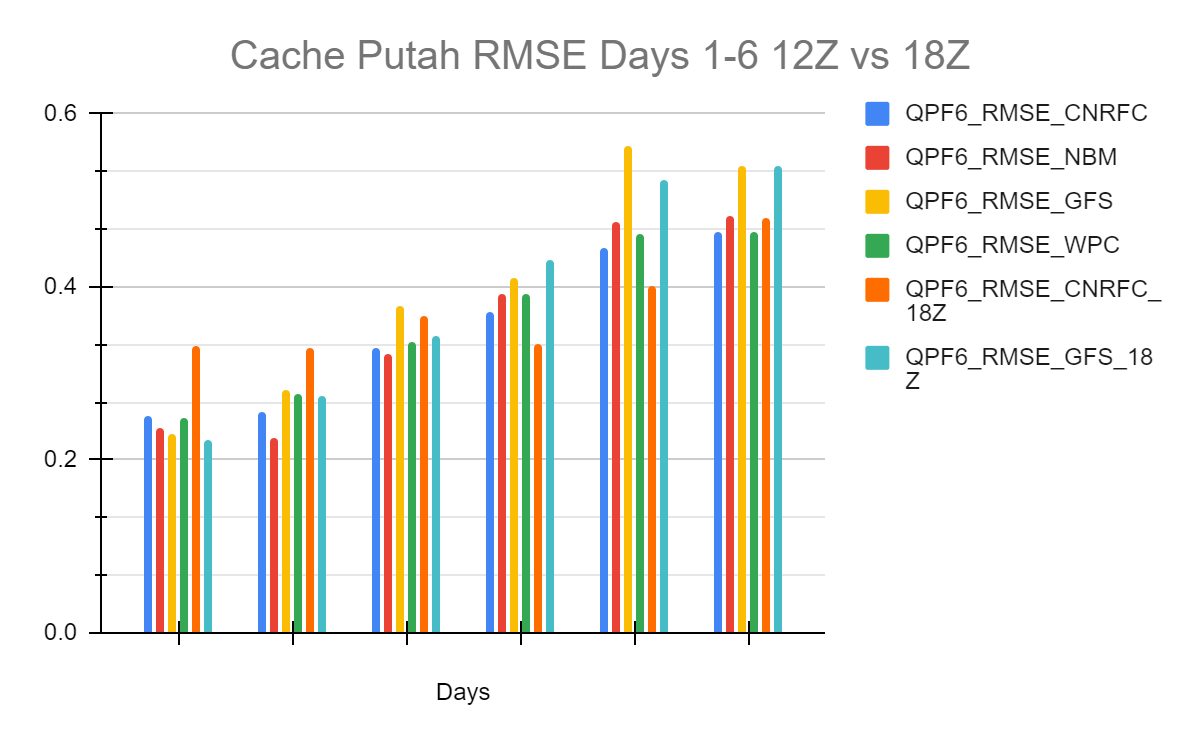 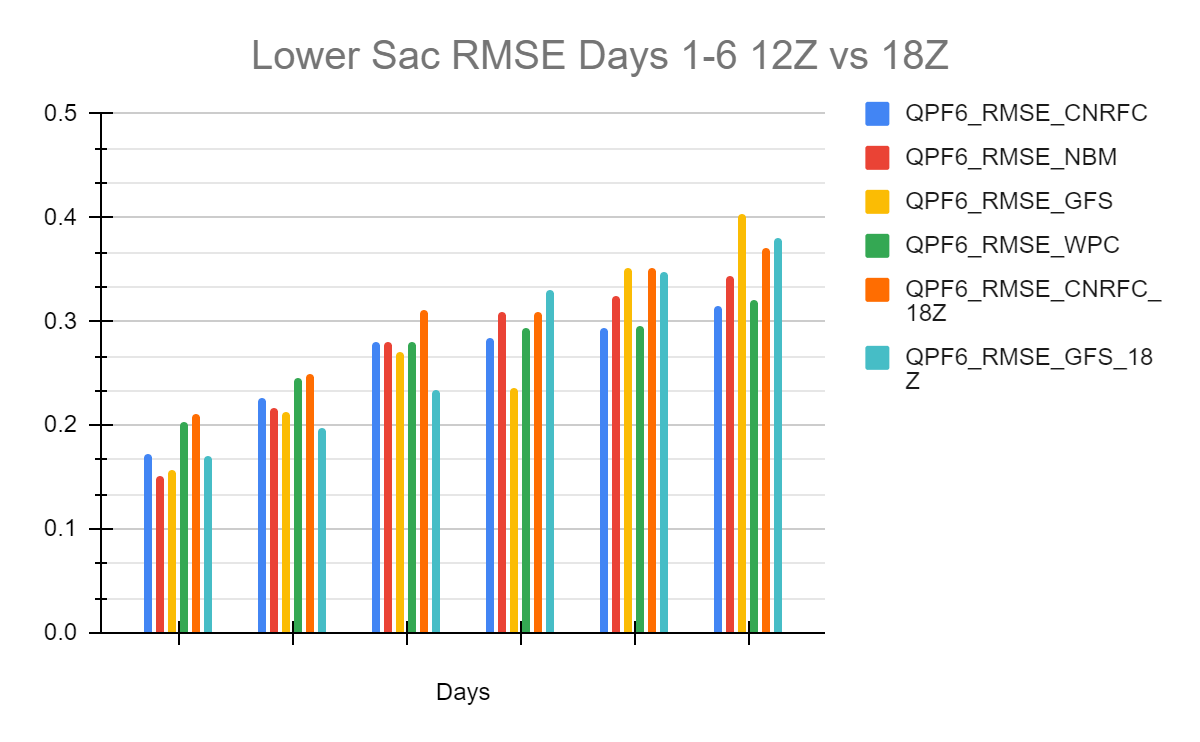 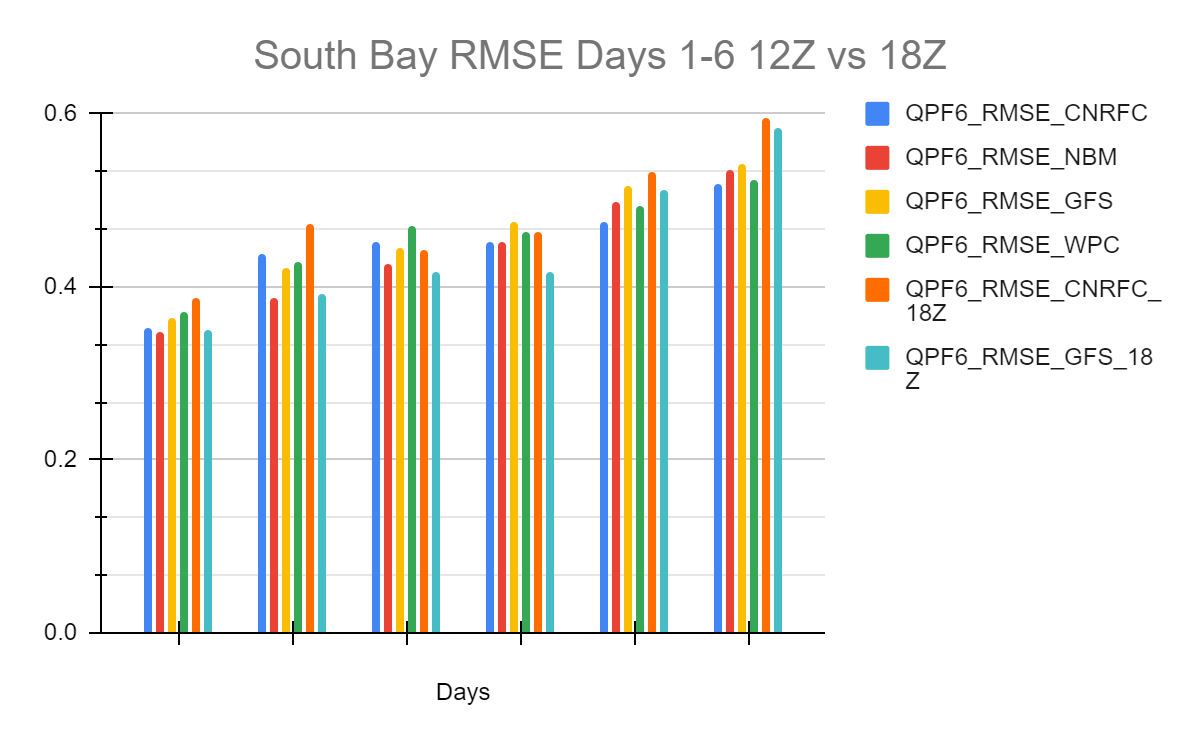  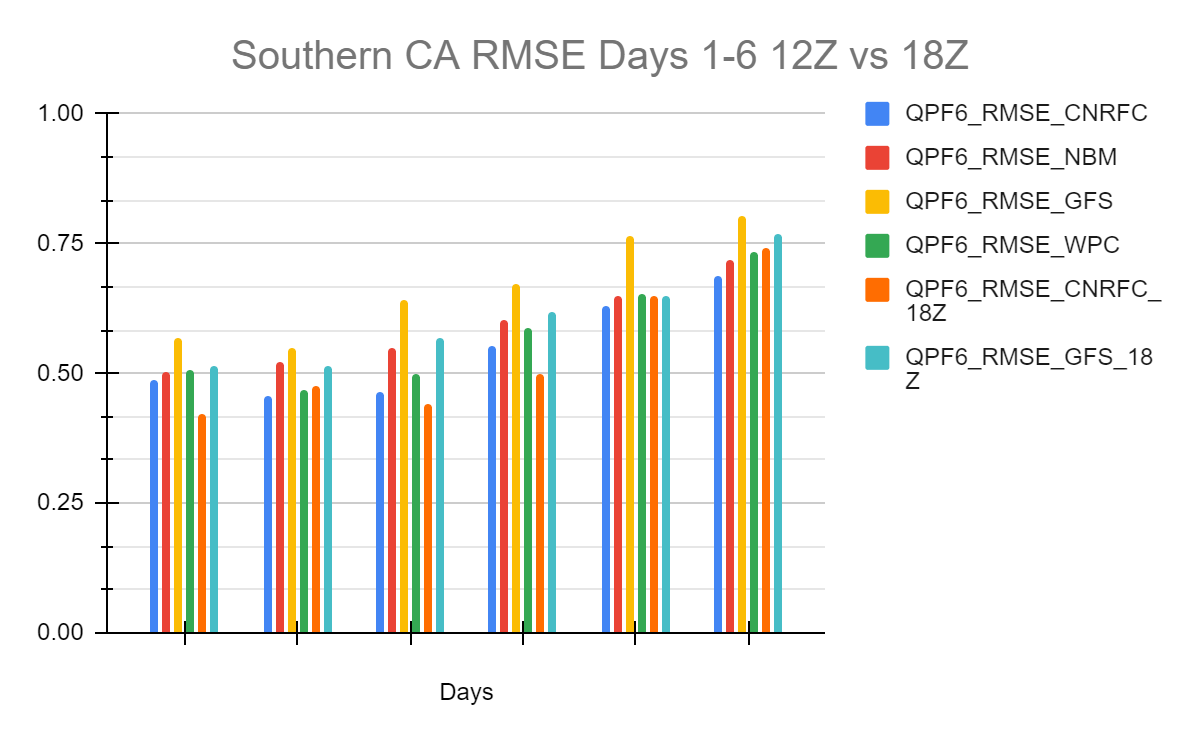 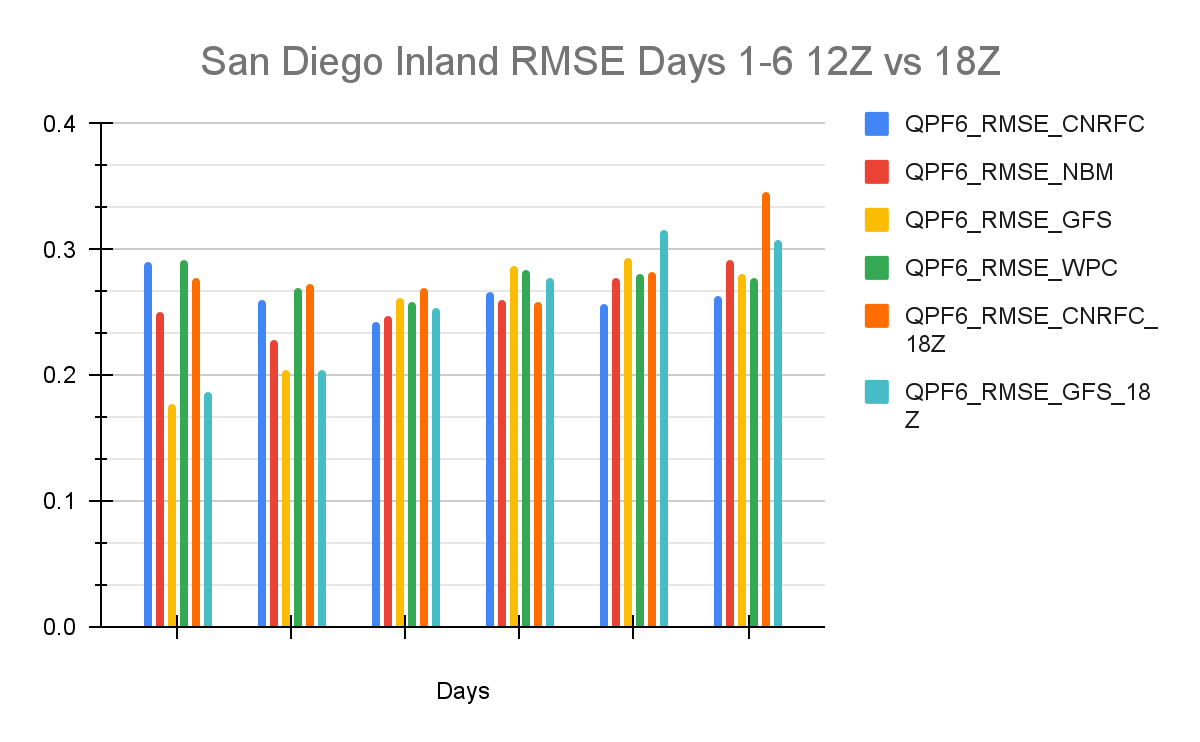 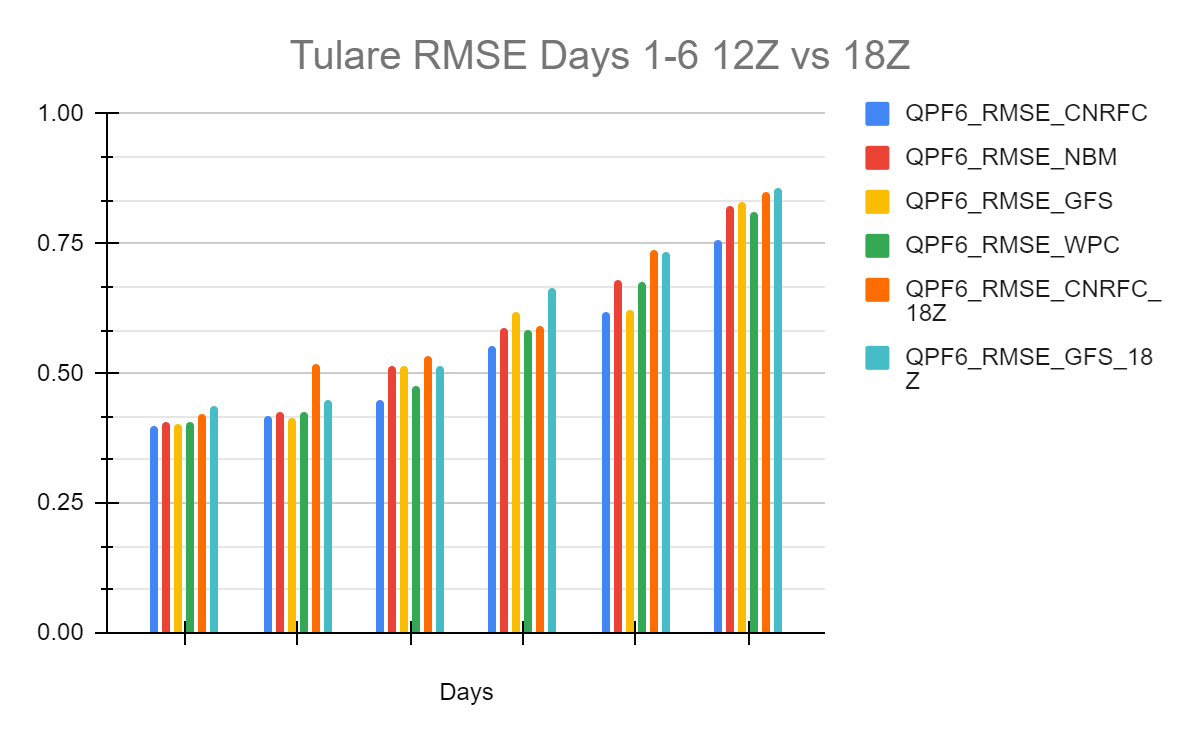 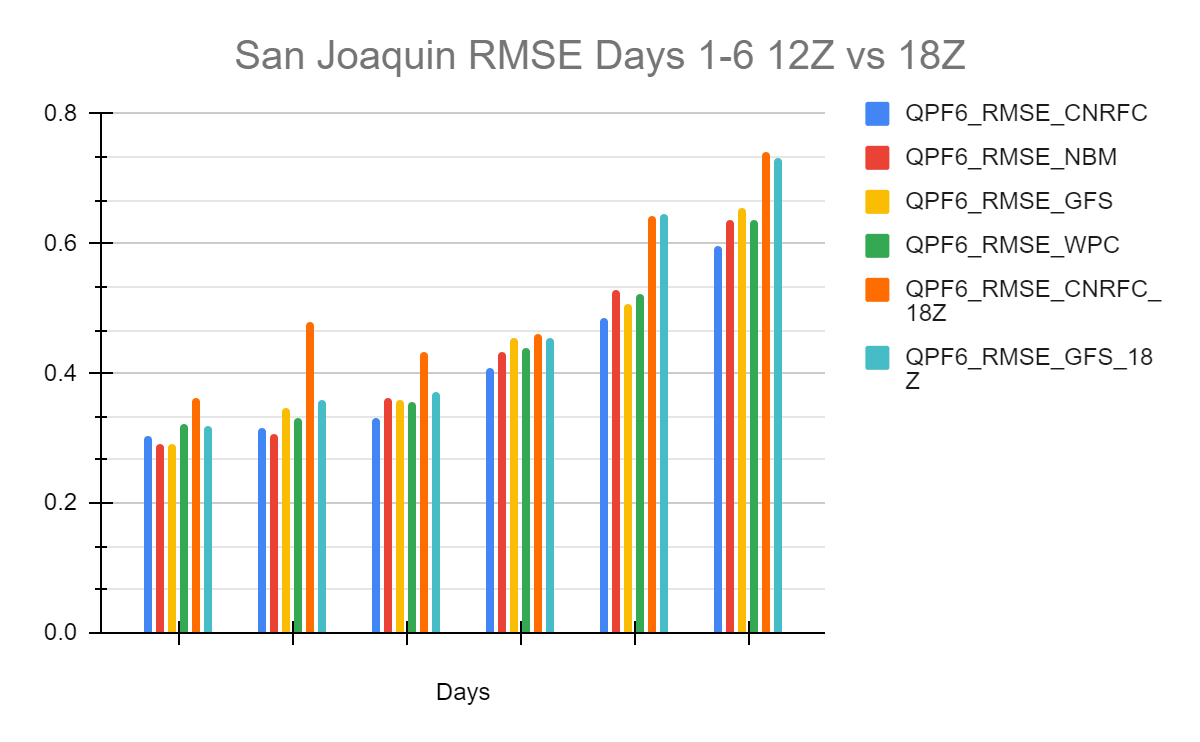 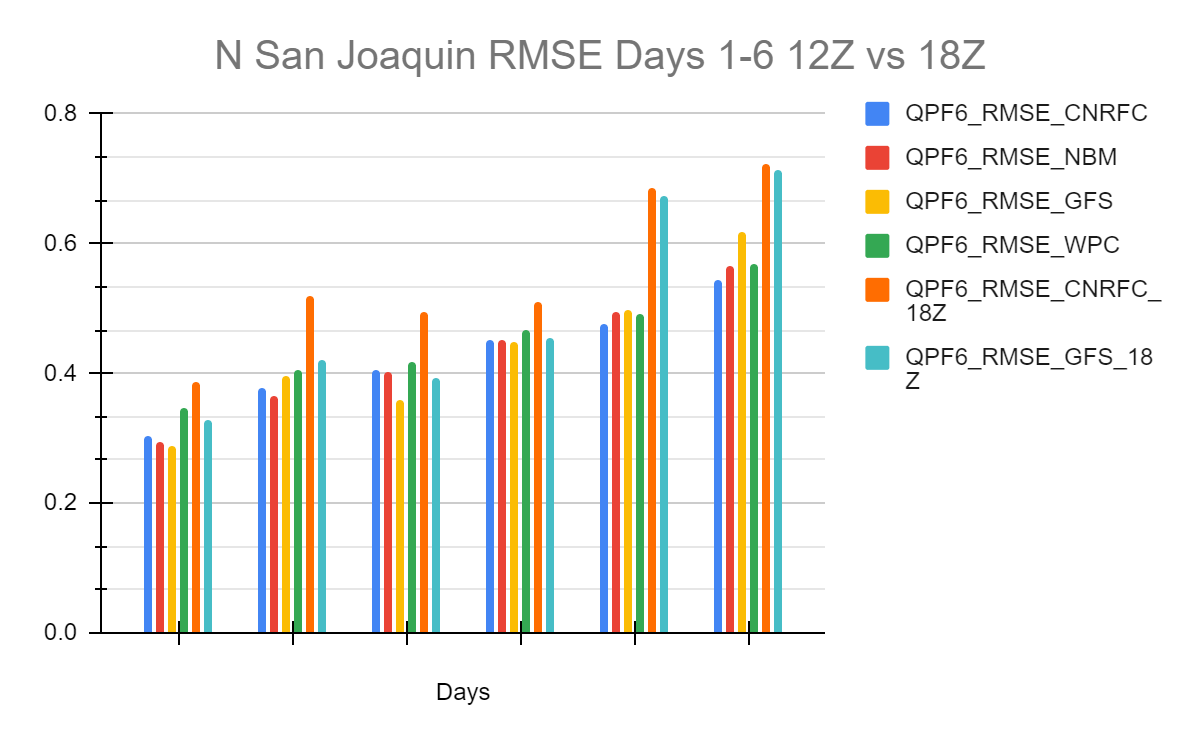 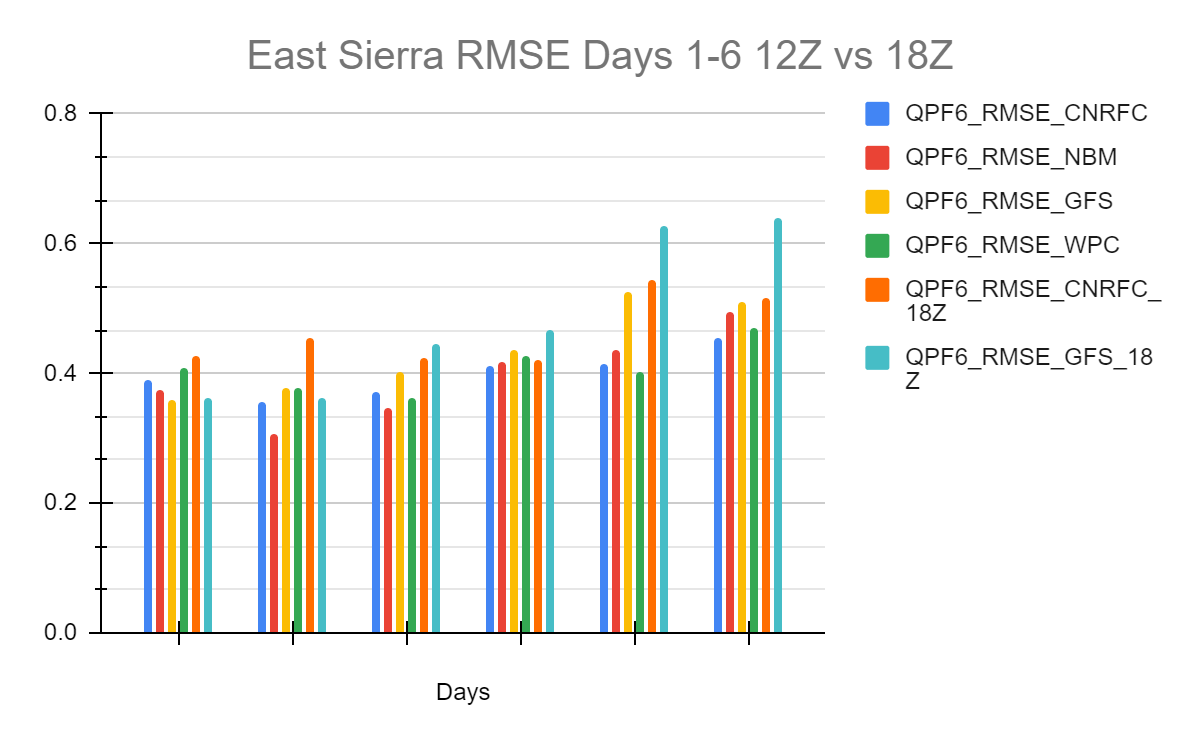 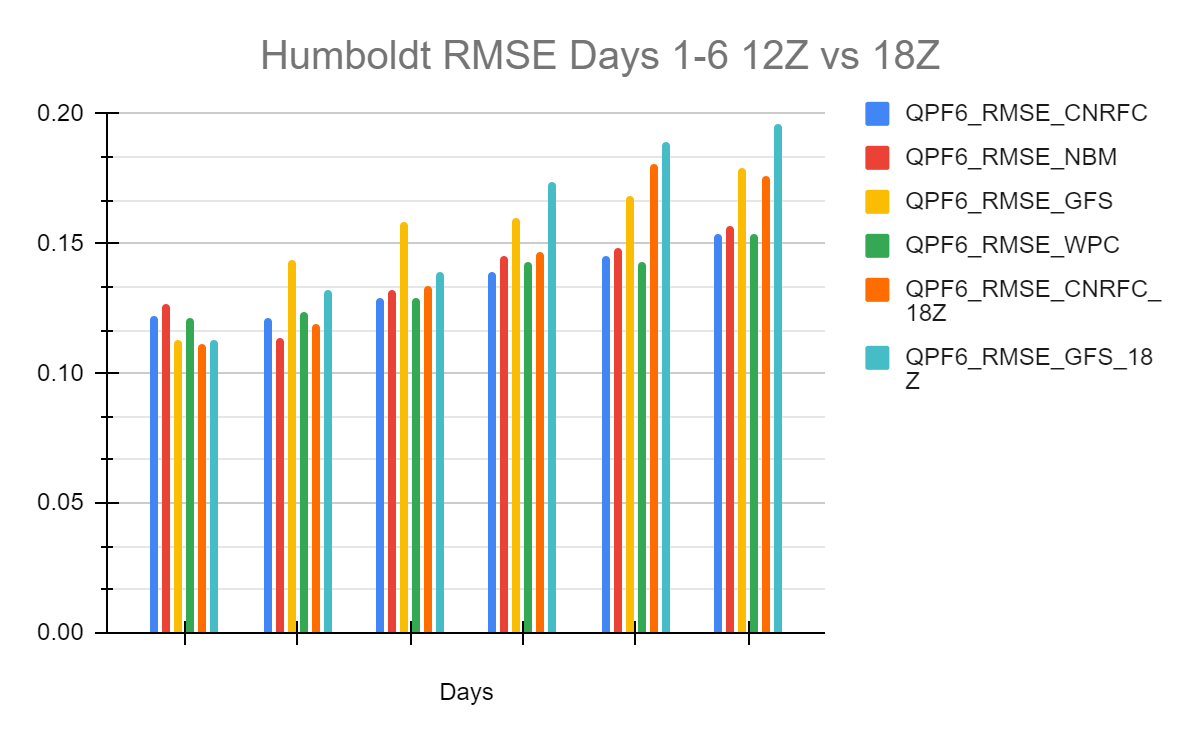 The images below display the individual river forecast group Percent Bias (PBIAS) for Days 1-6 for CNRFC morning forecasts (12Z), 12Z GFS, NBM, WPC, CNRFC afternoon forecasts (18Z), and 18Z GFS. Click on the individual images below to enlarge and open in a new tab. 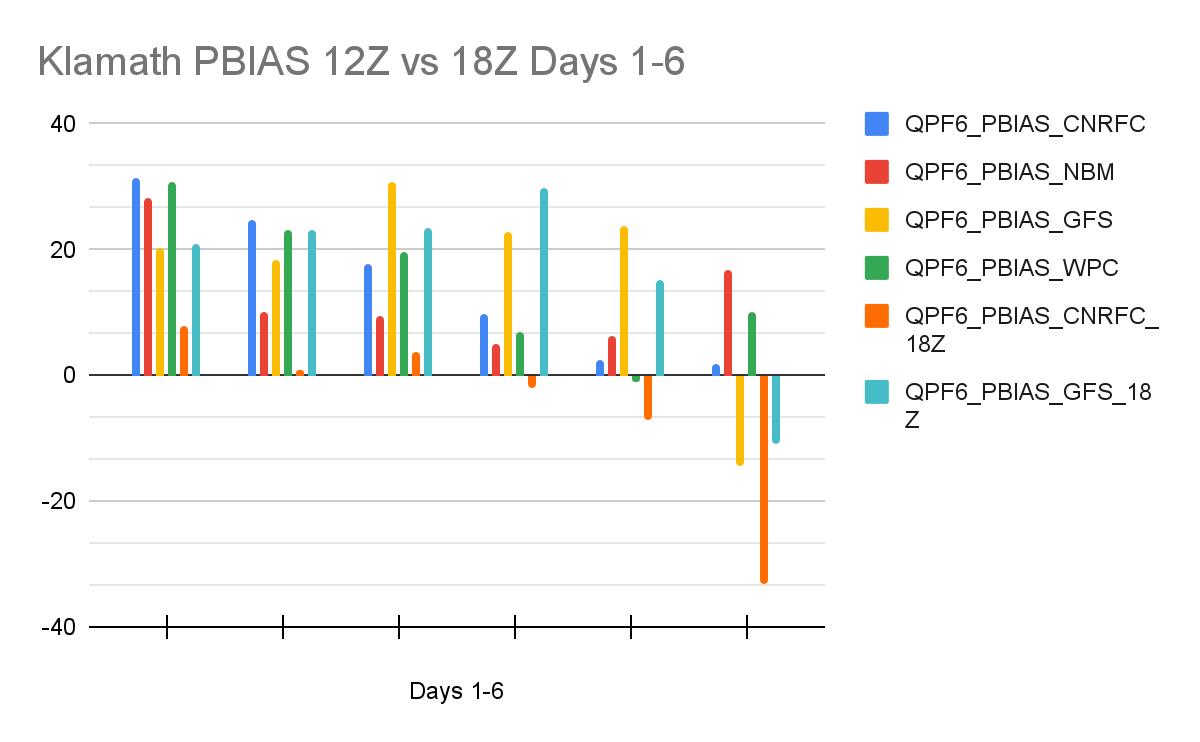 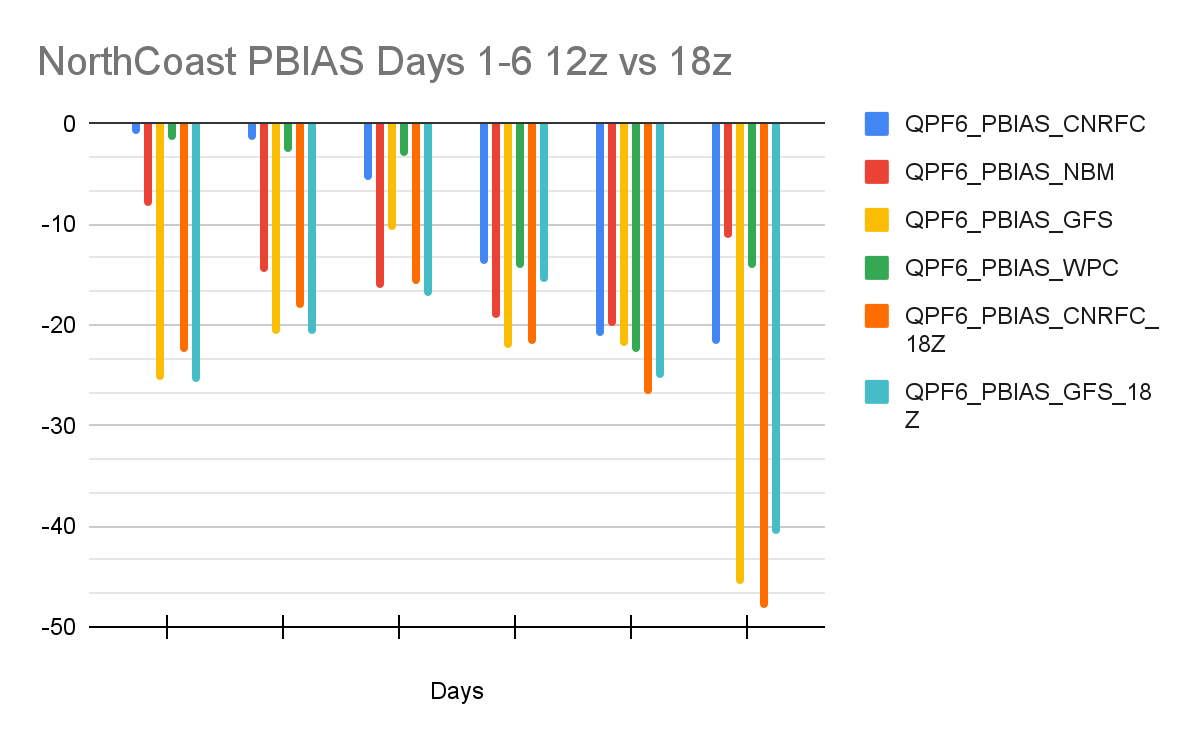 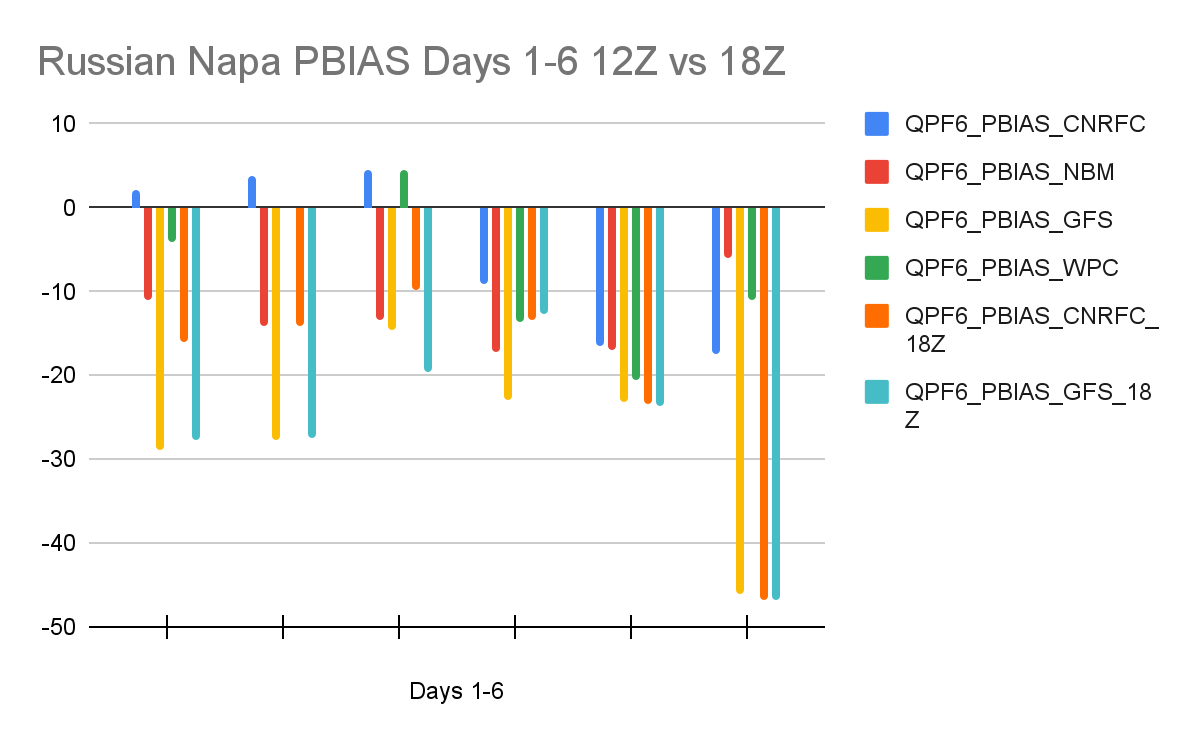 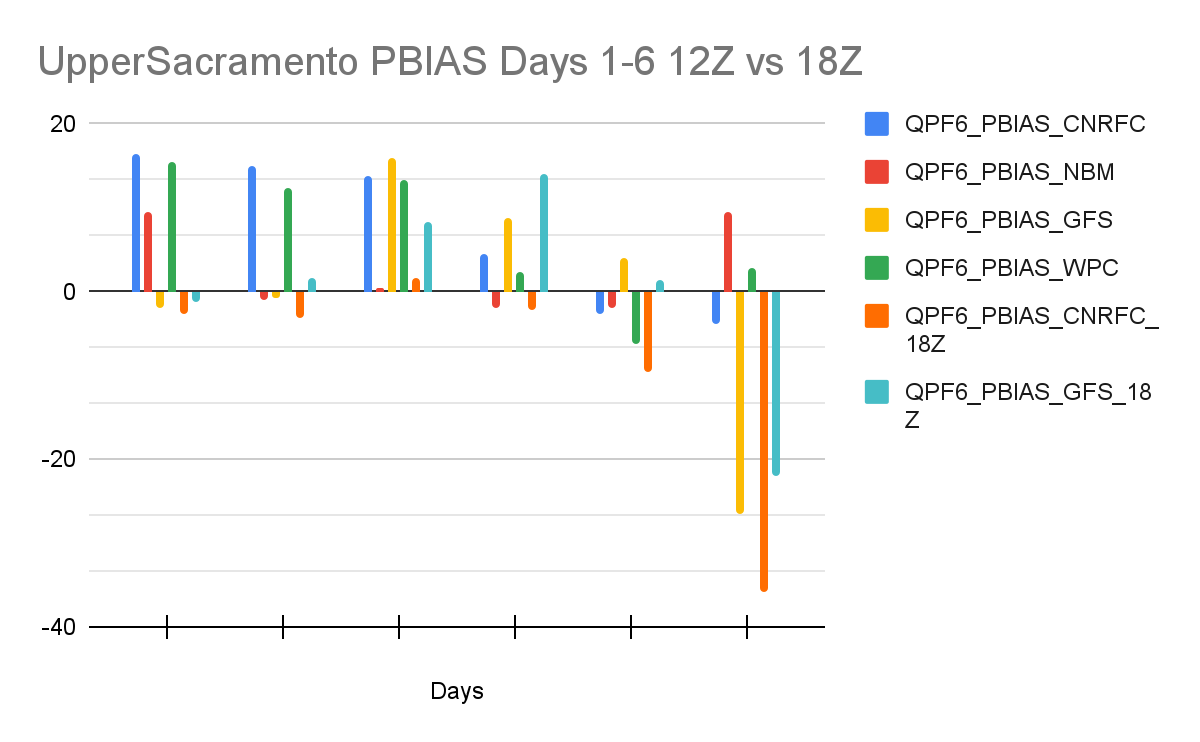 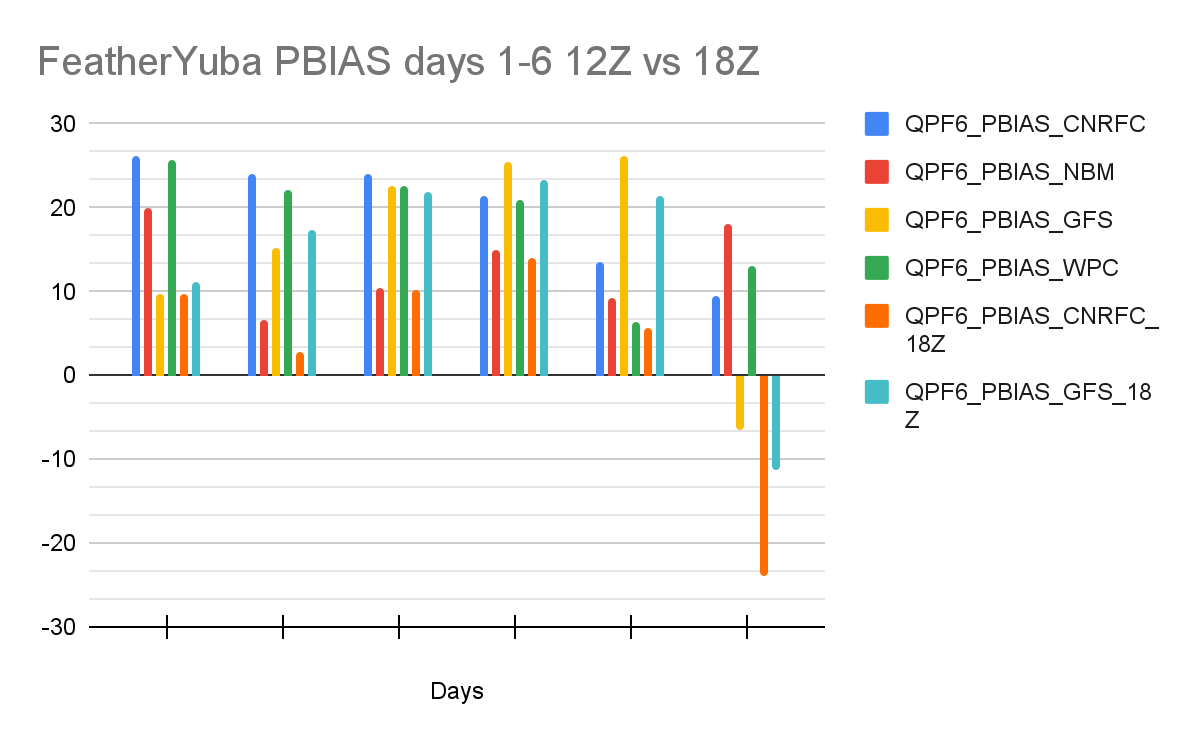 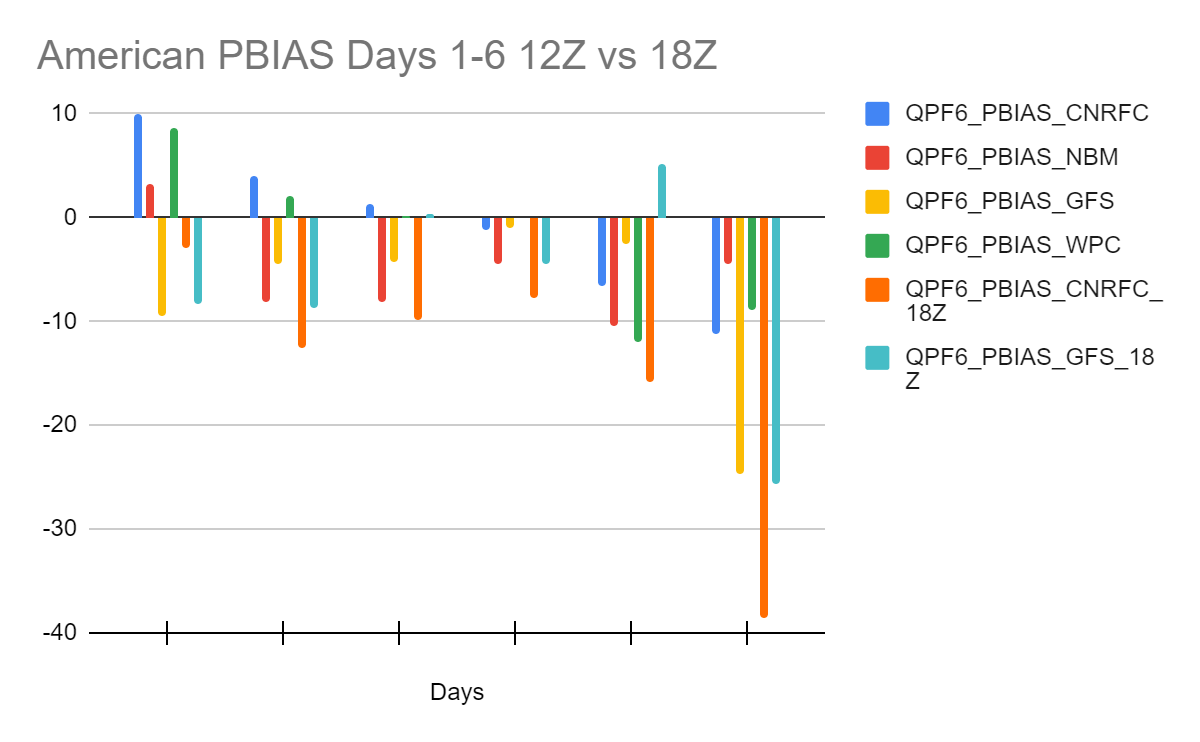 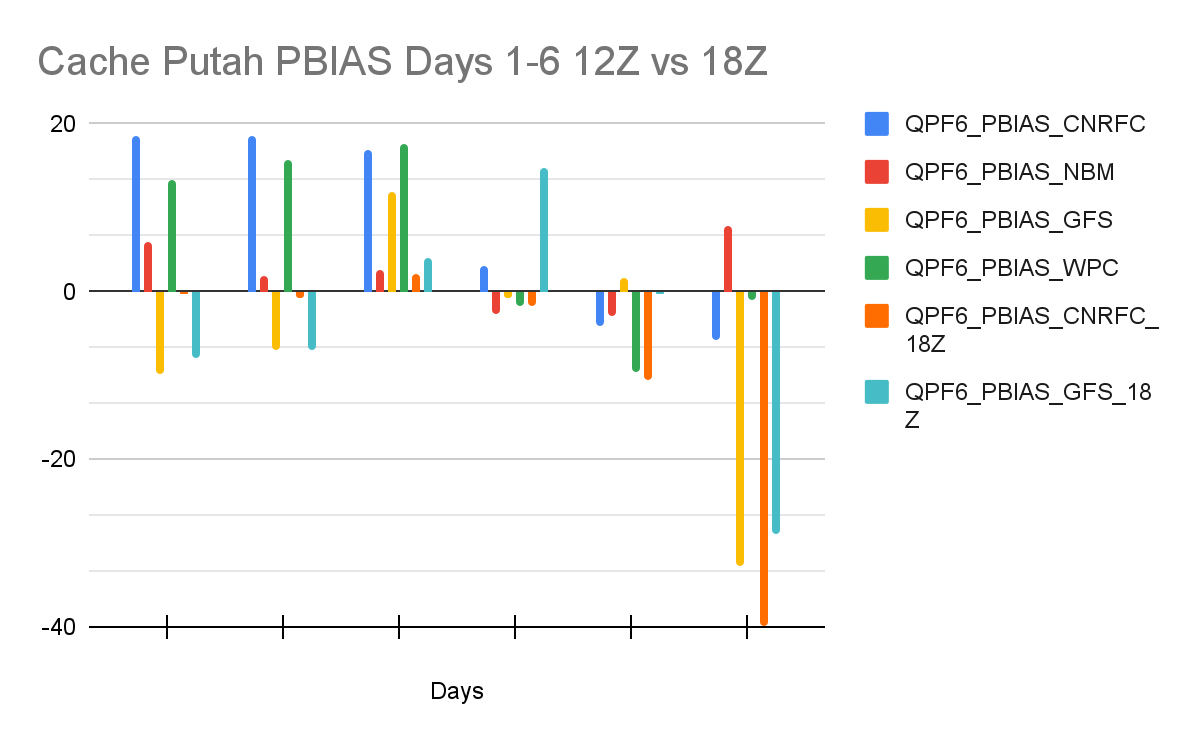 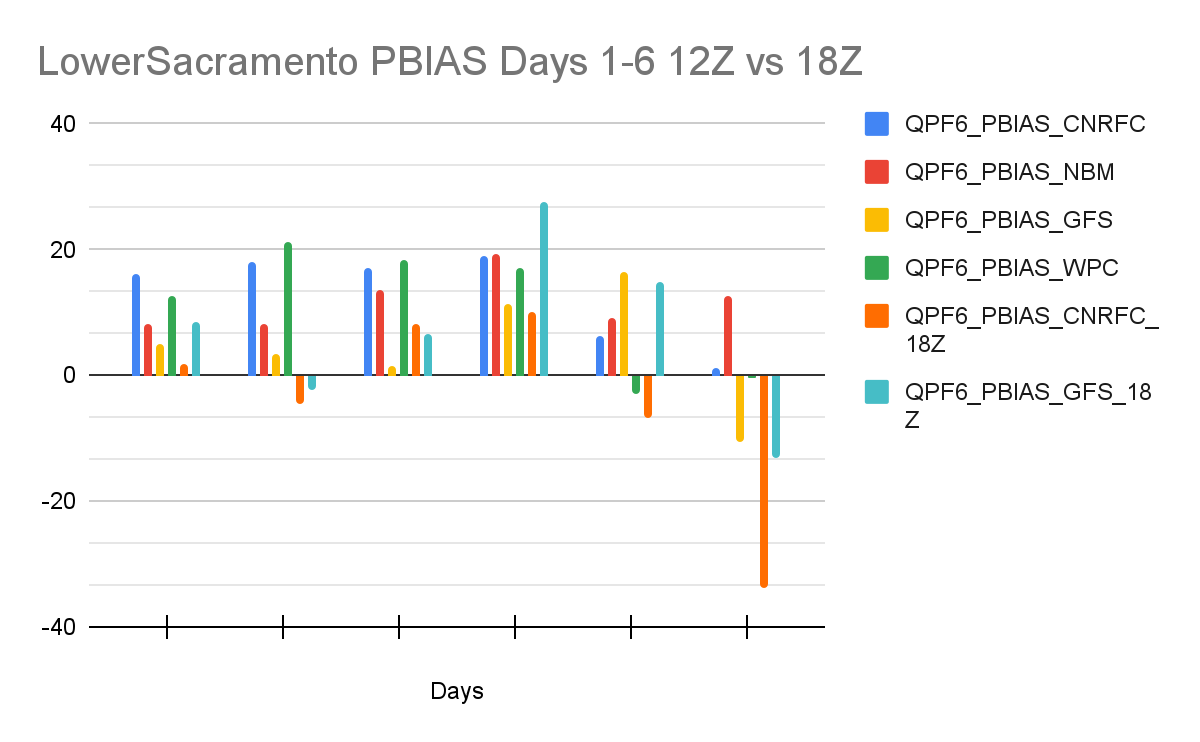 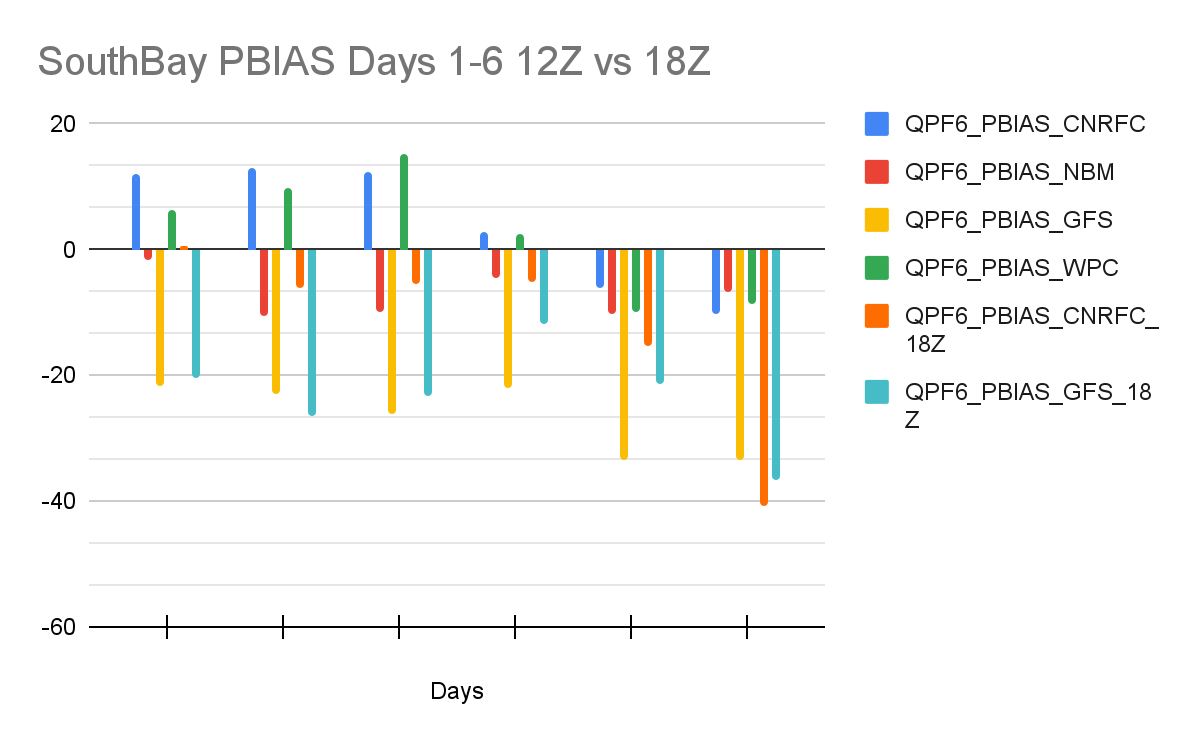 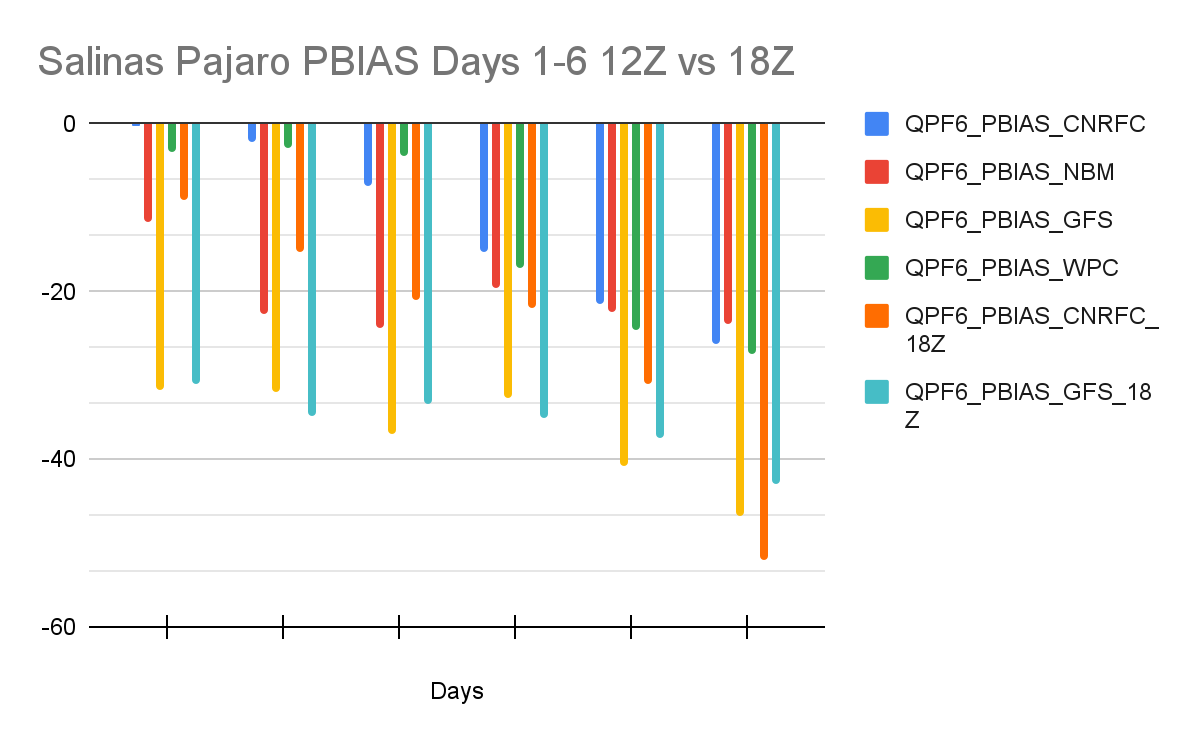 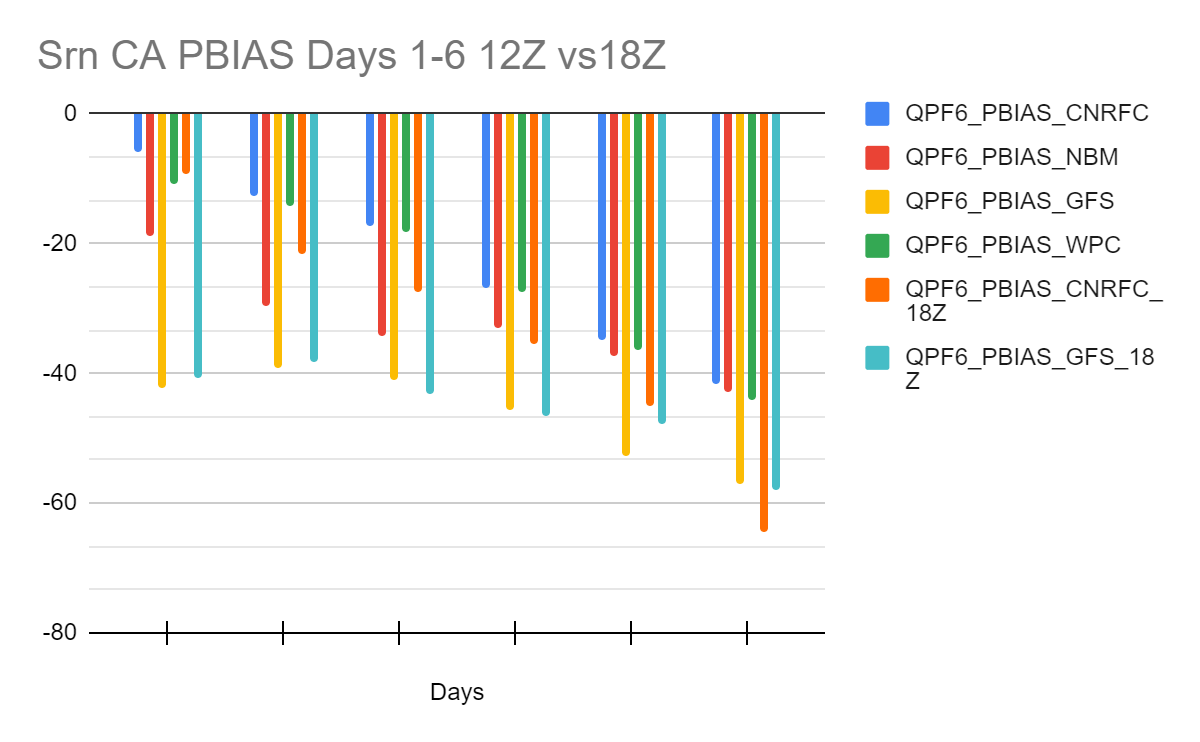 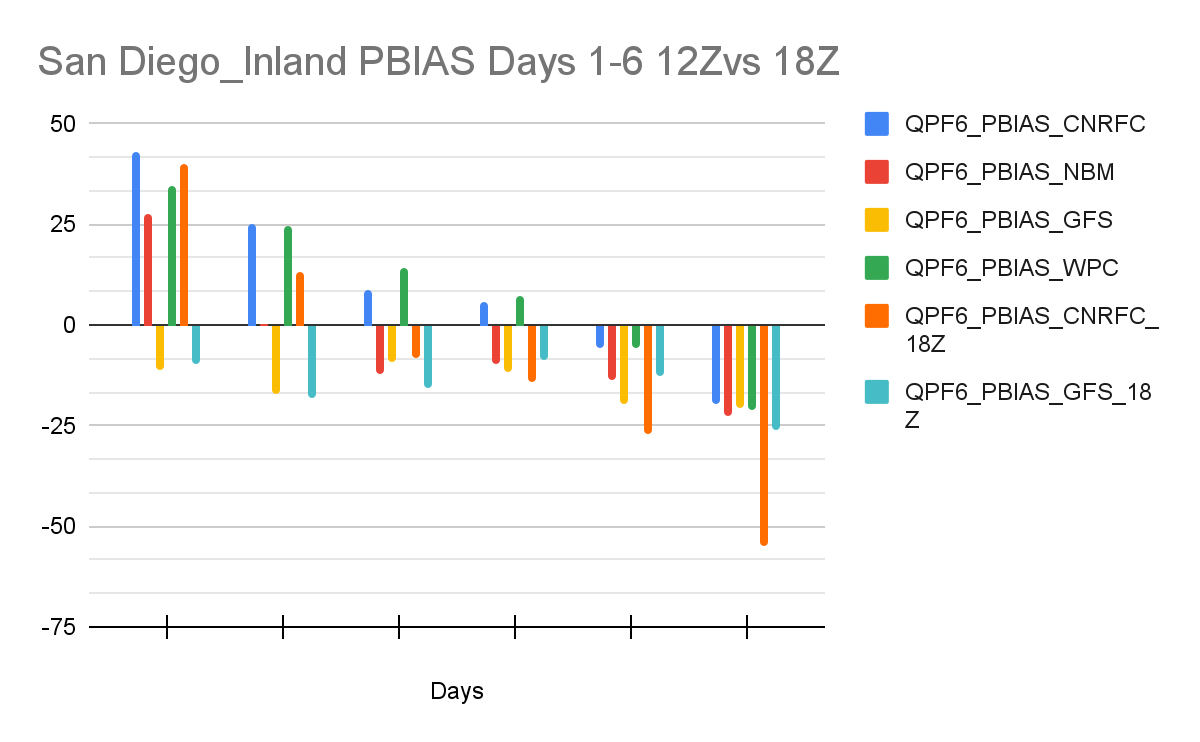 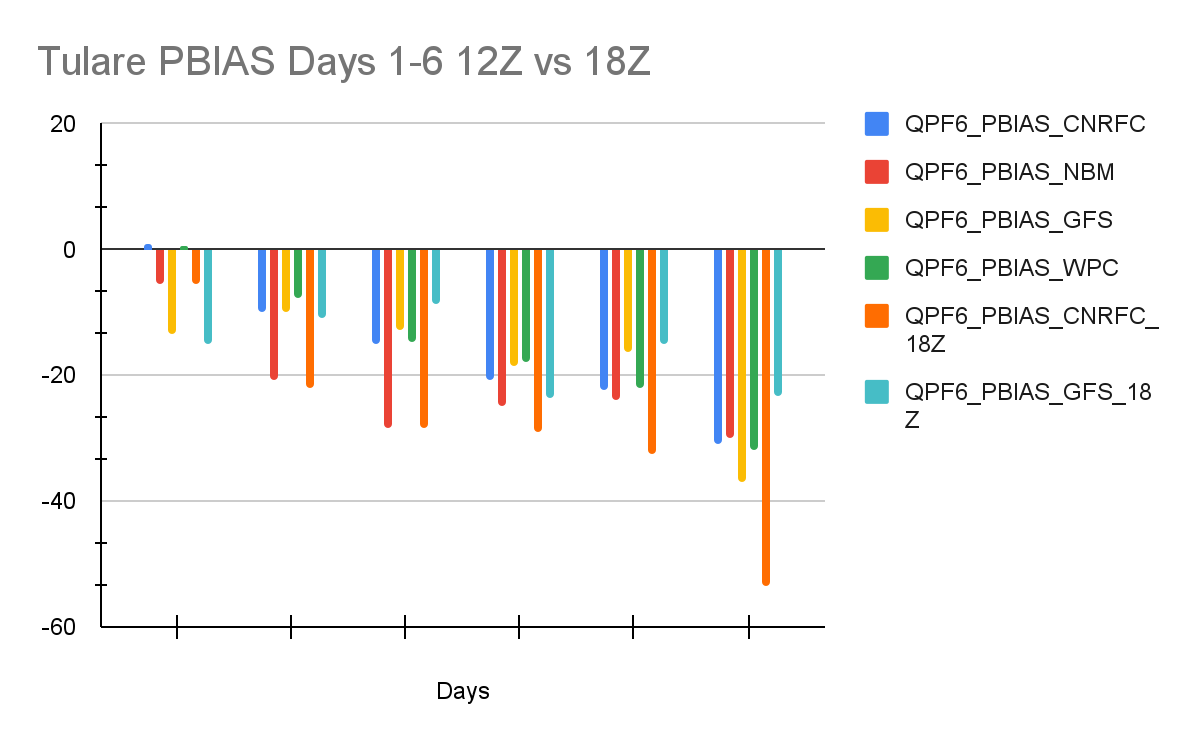 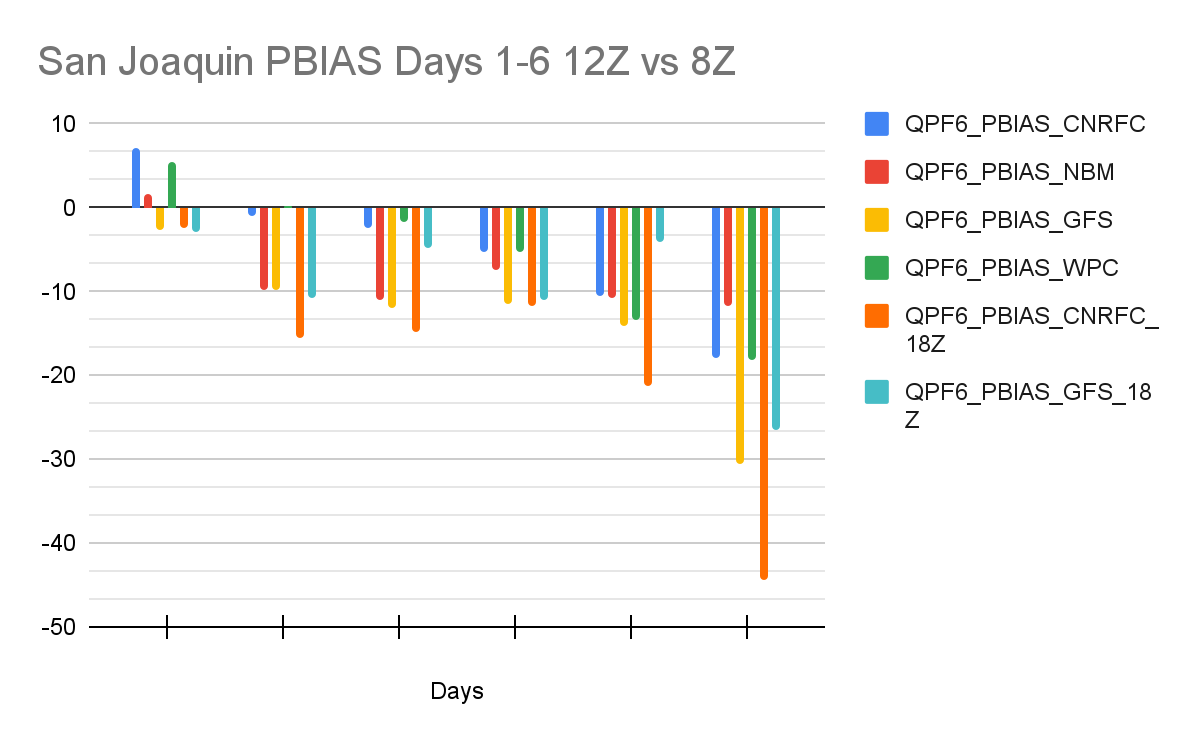 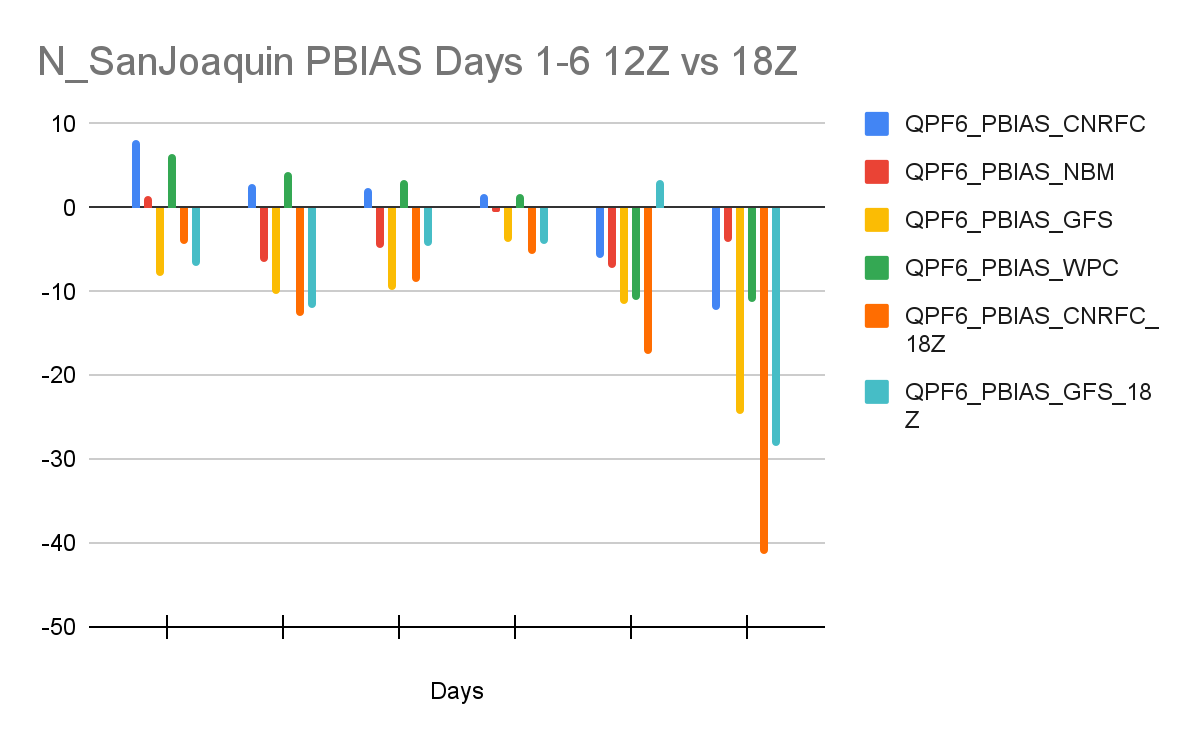 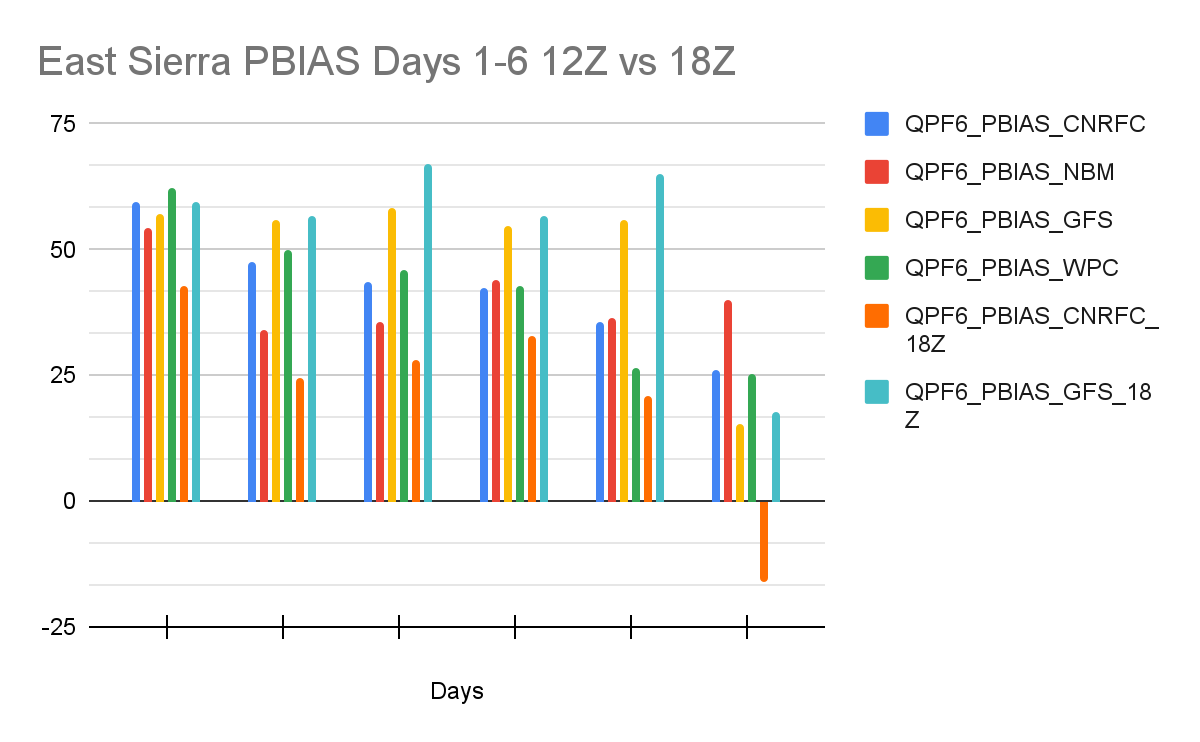 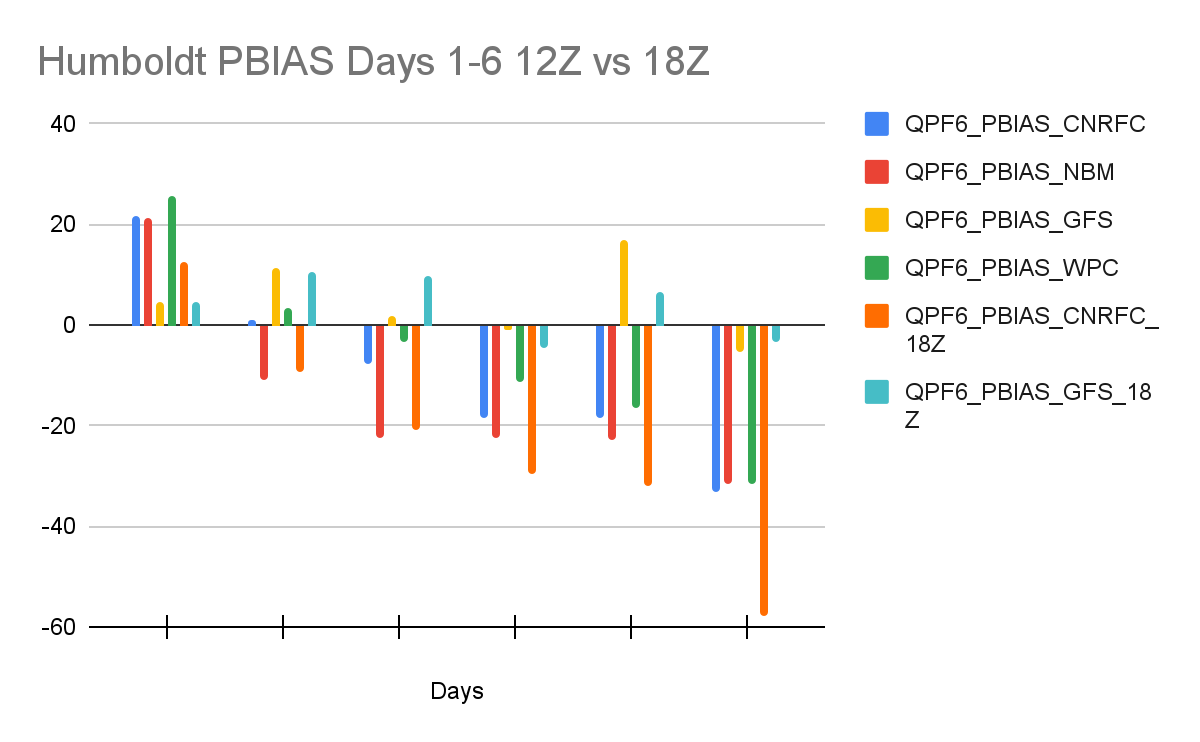 The images below display the individual river forecast group Heidke Skill Score (HSS) for Days 1-6 for CNRFC morning forecasts (12Z), 12Z GFS, NBM, WPC, CNRFC afternoon forecasts (18Z), and 18Z GFS. Click on the individual images below to enlarge and open in a new tab. 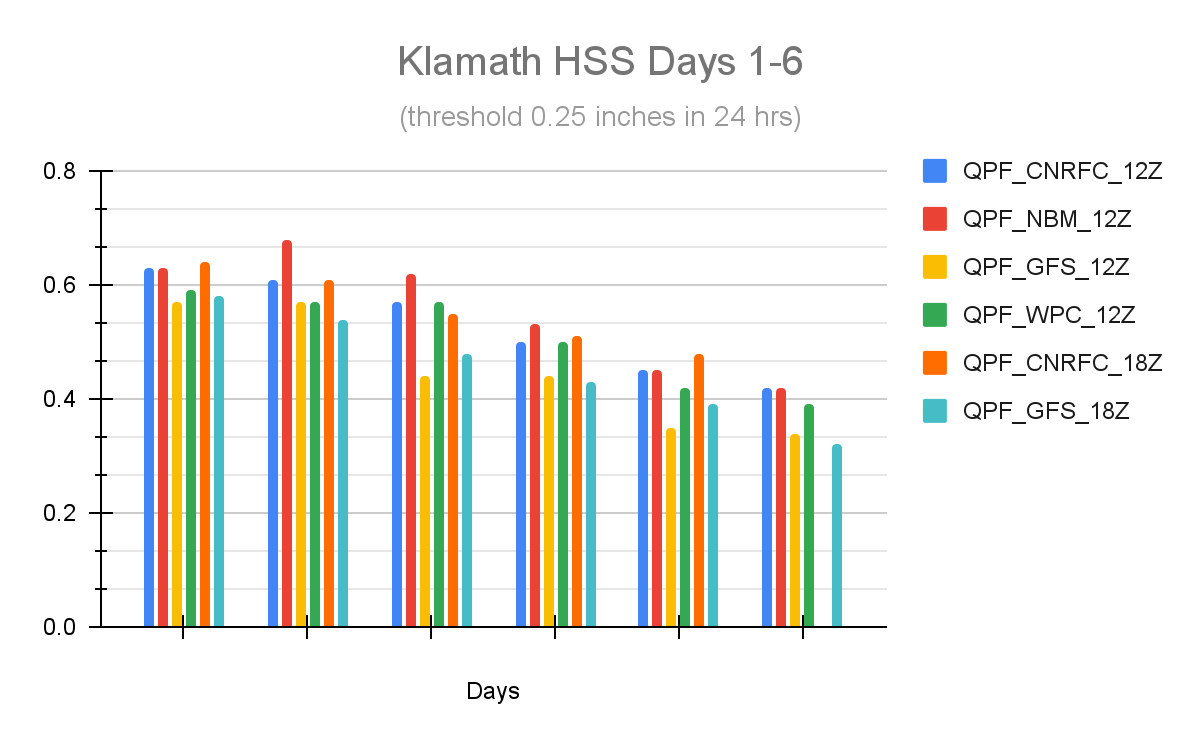 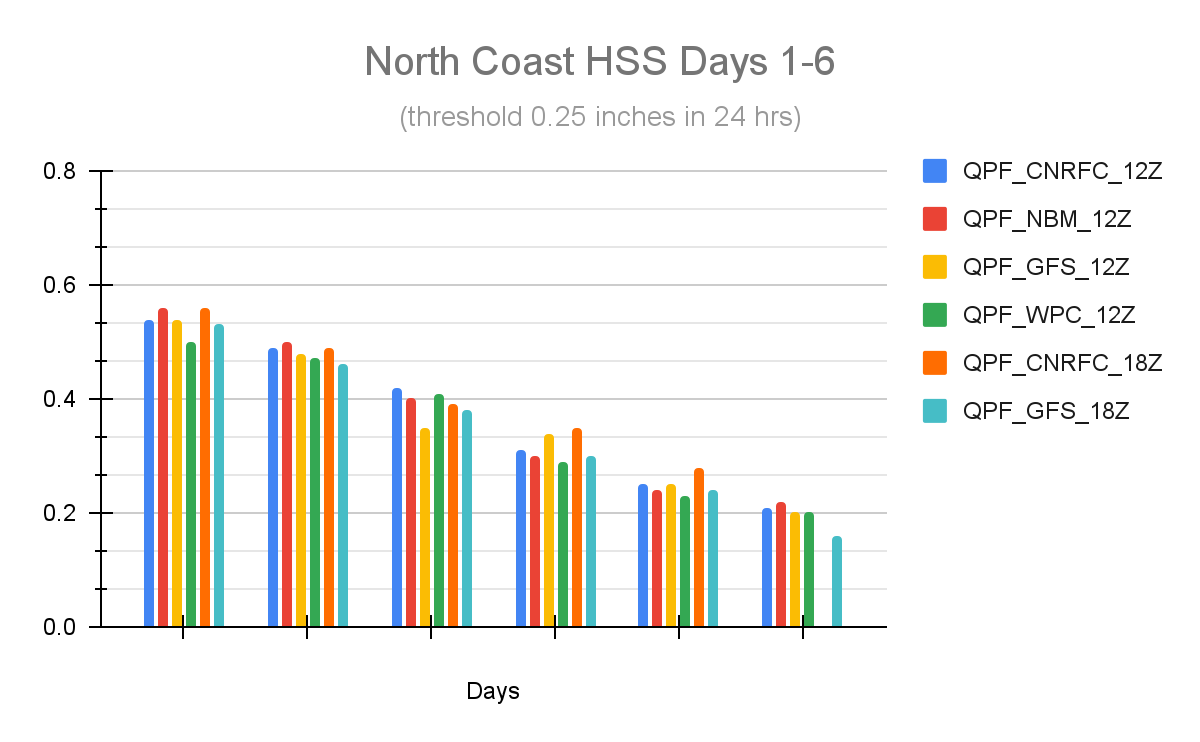 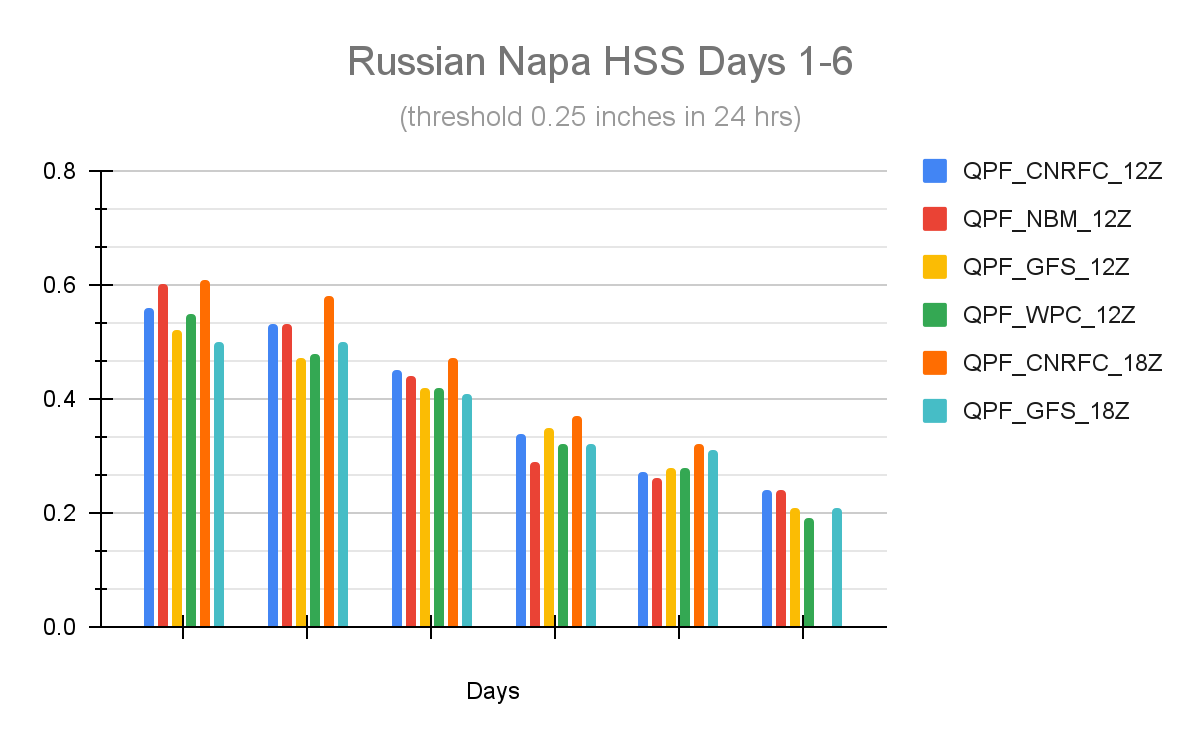 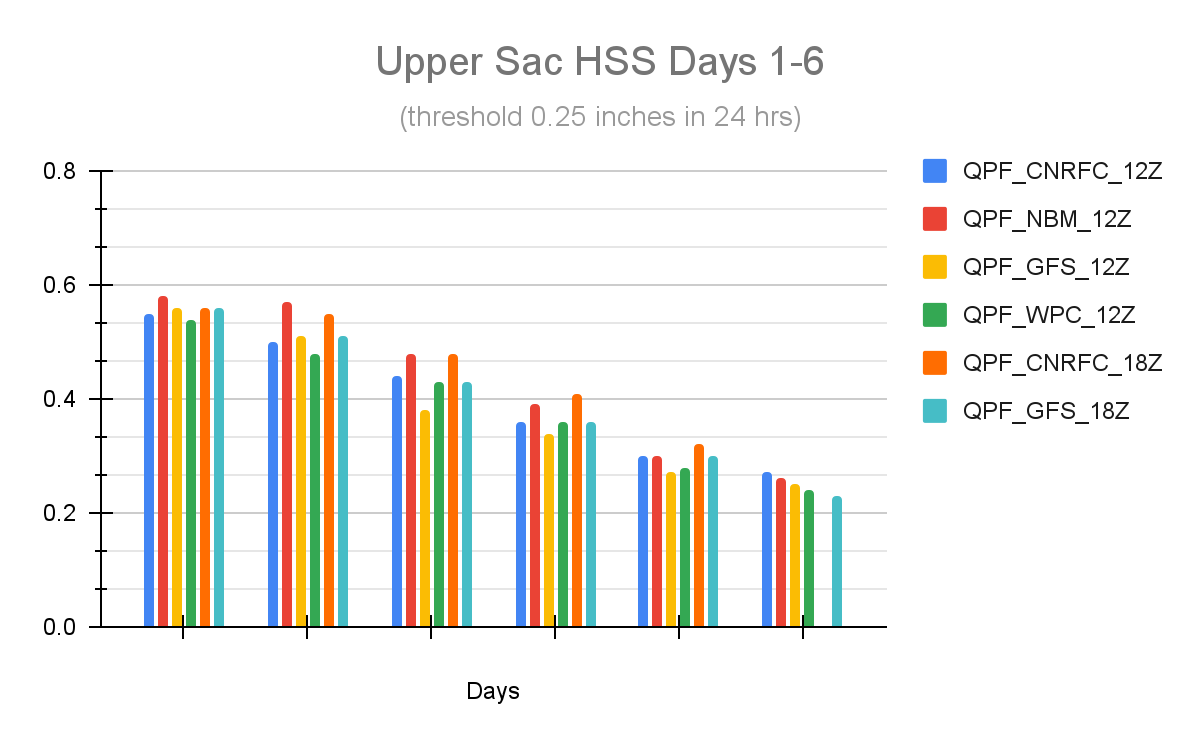 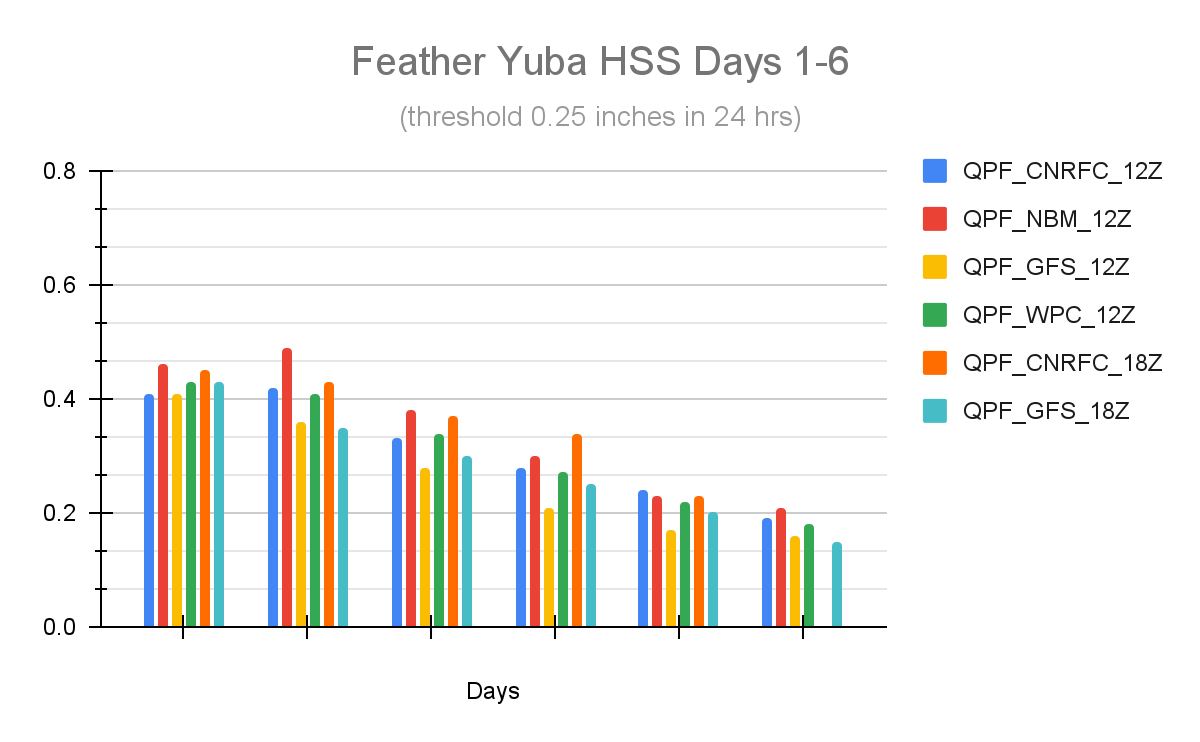 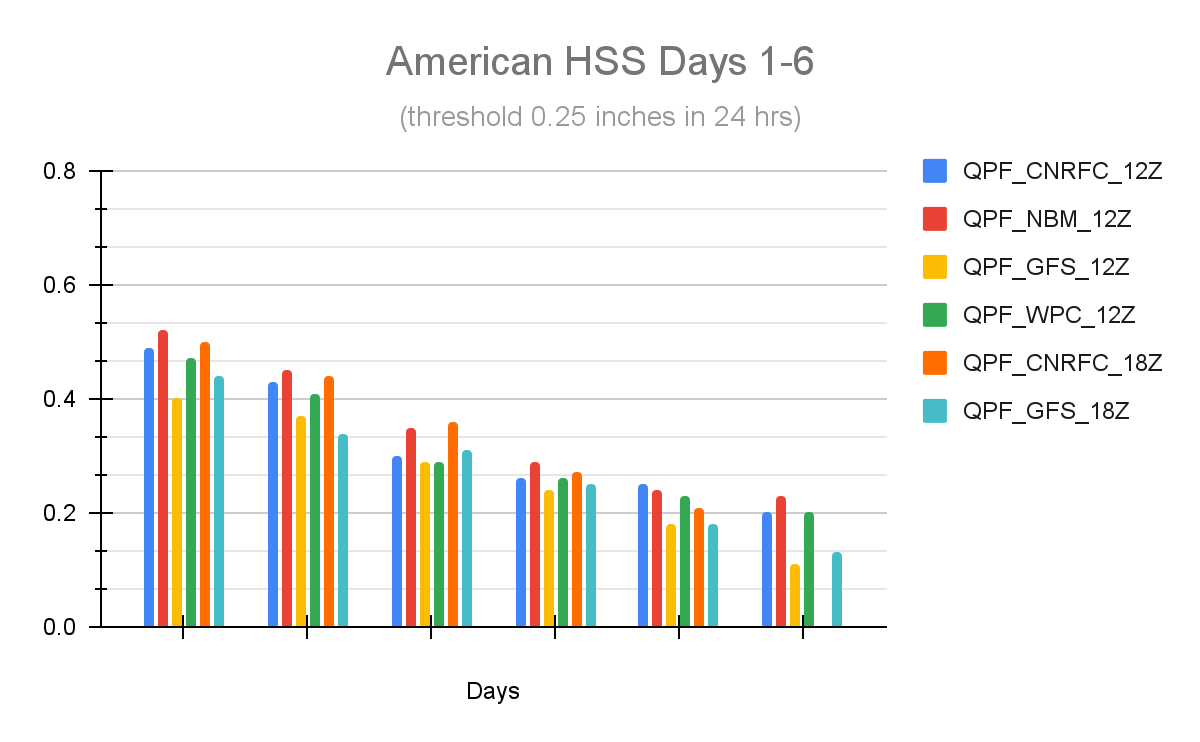 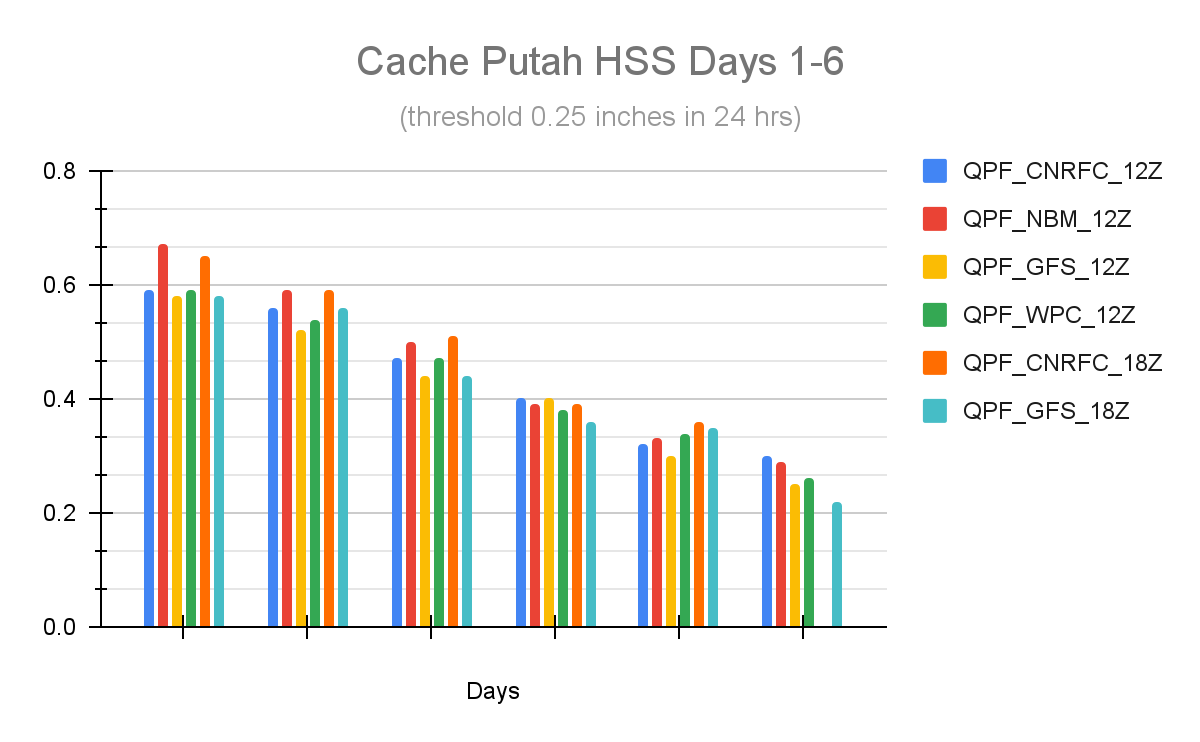 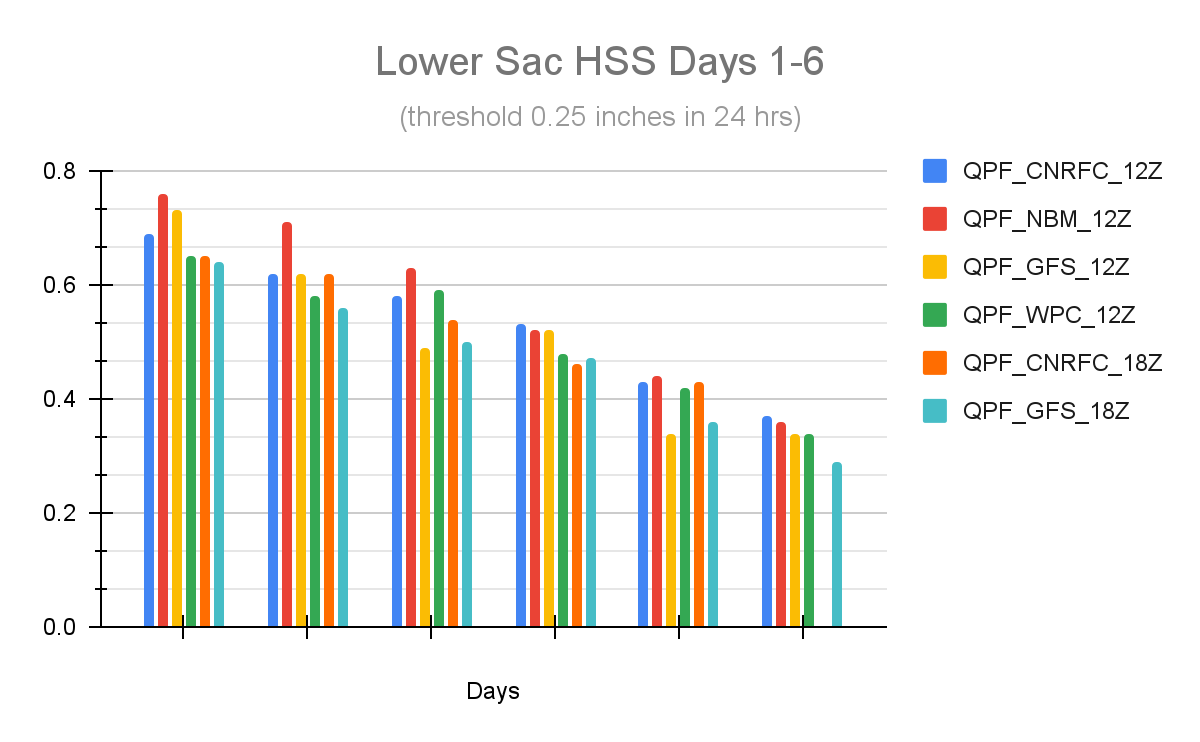 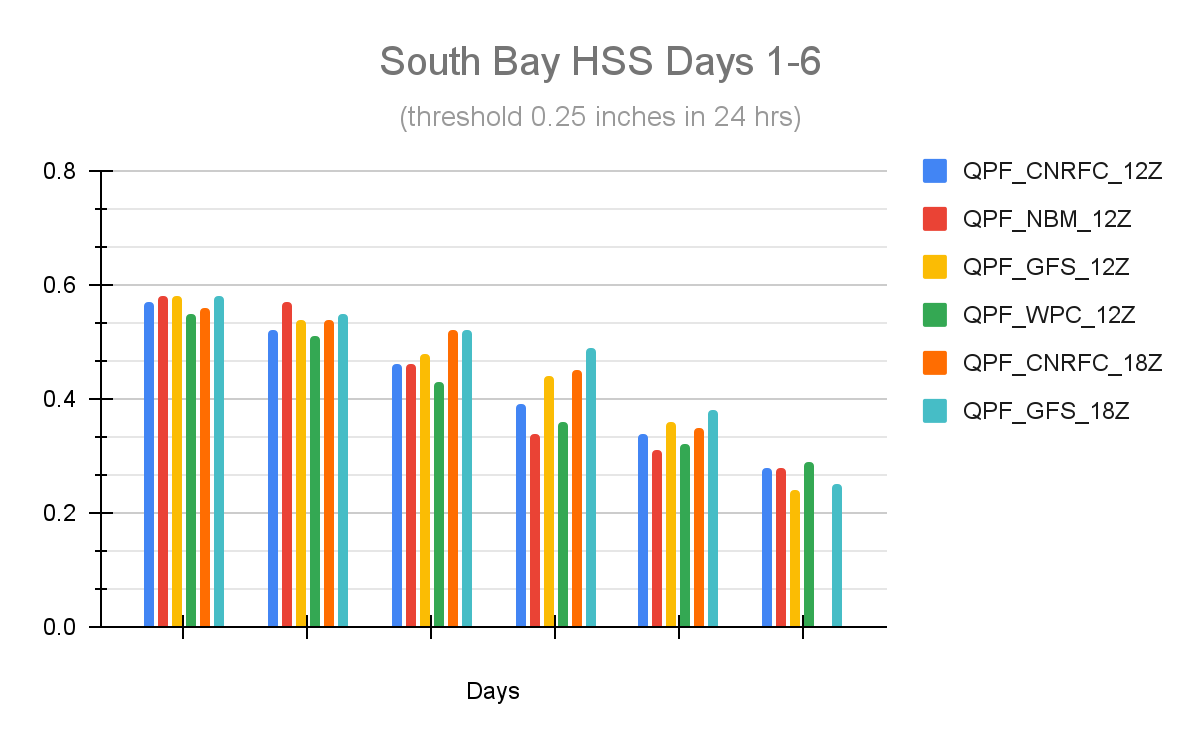 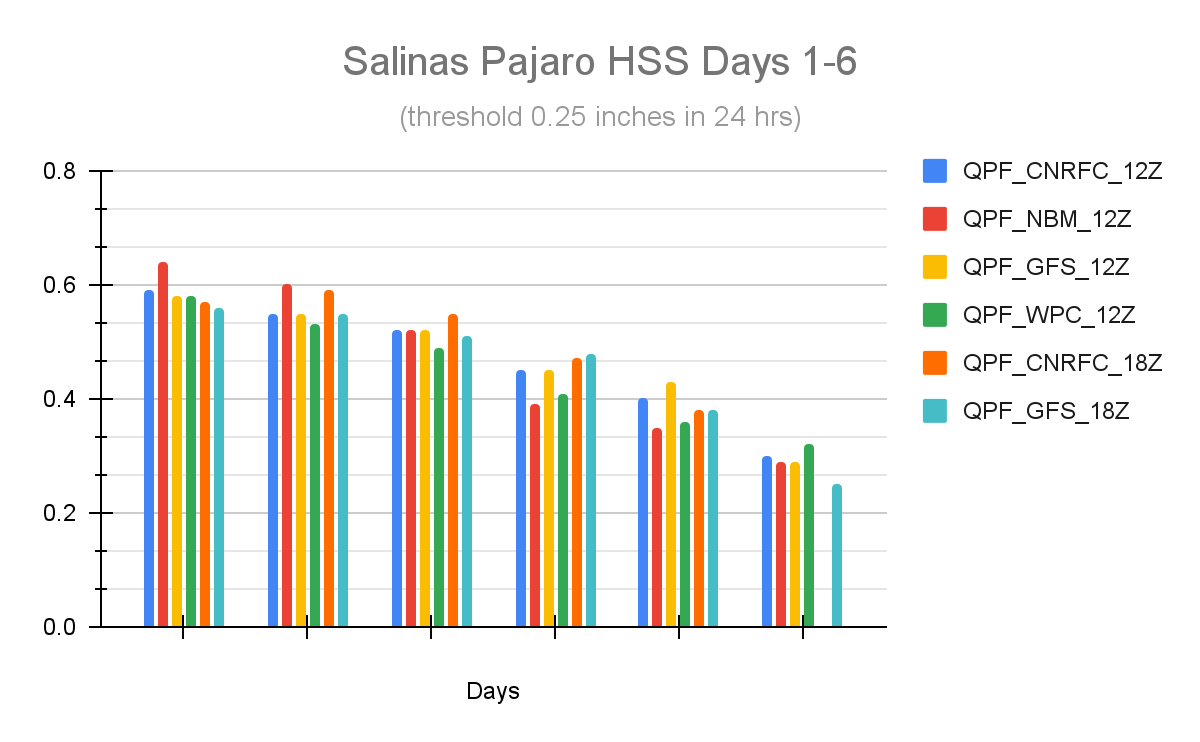 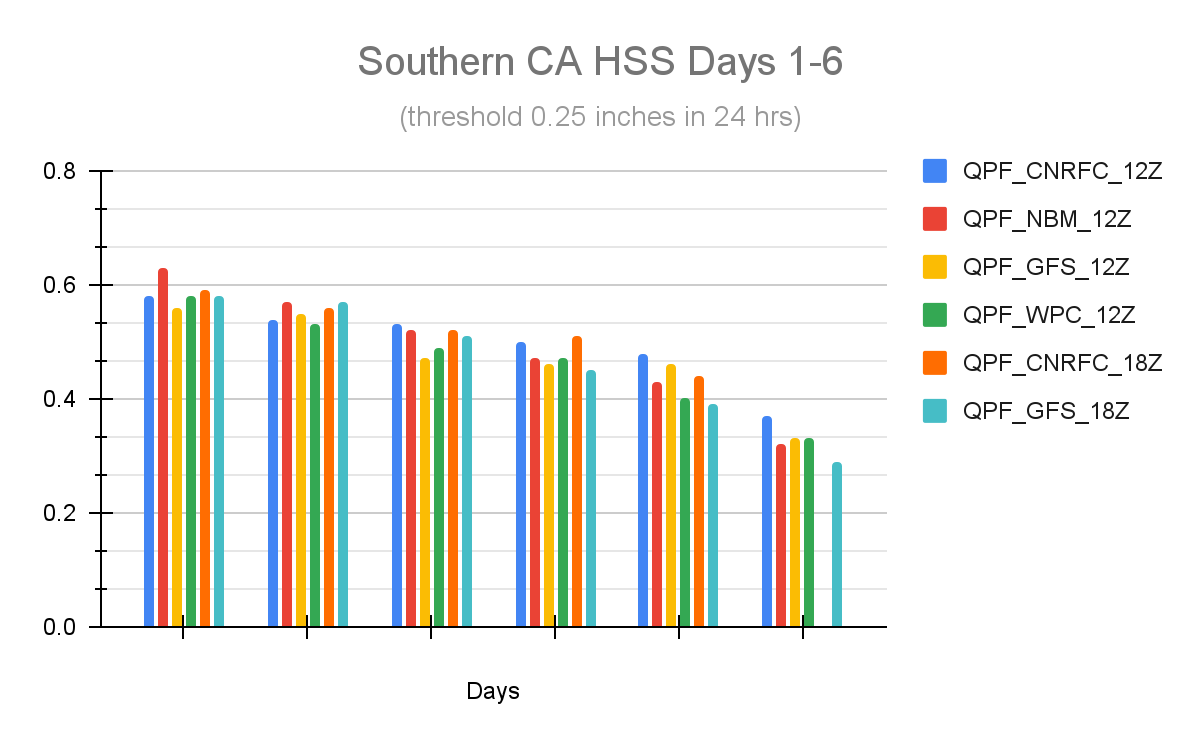 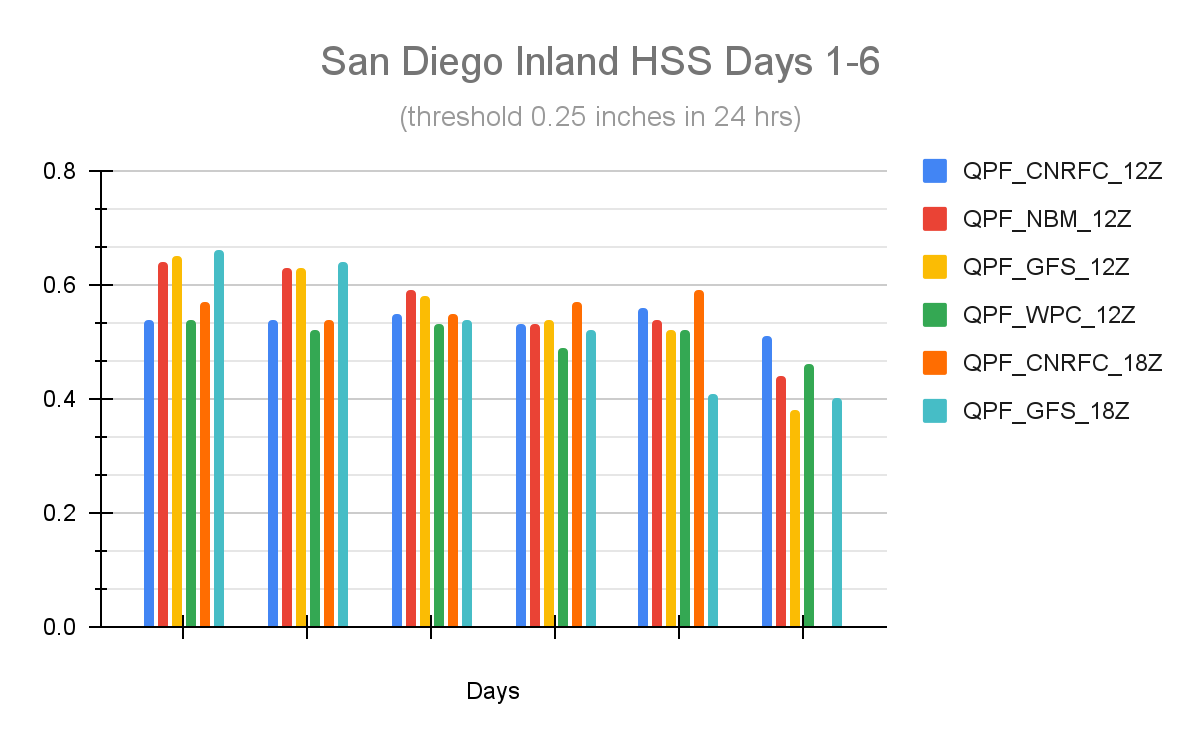 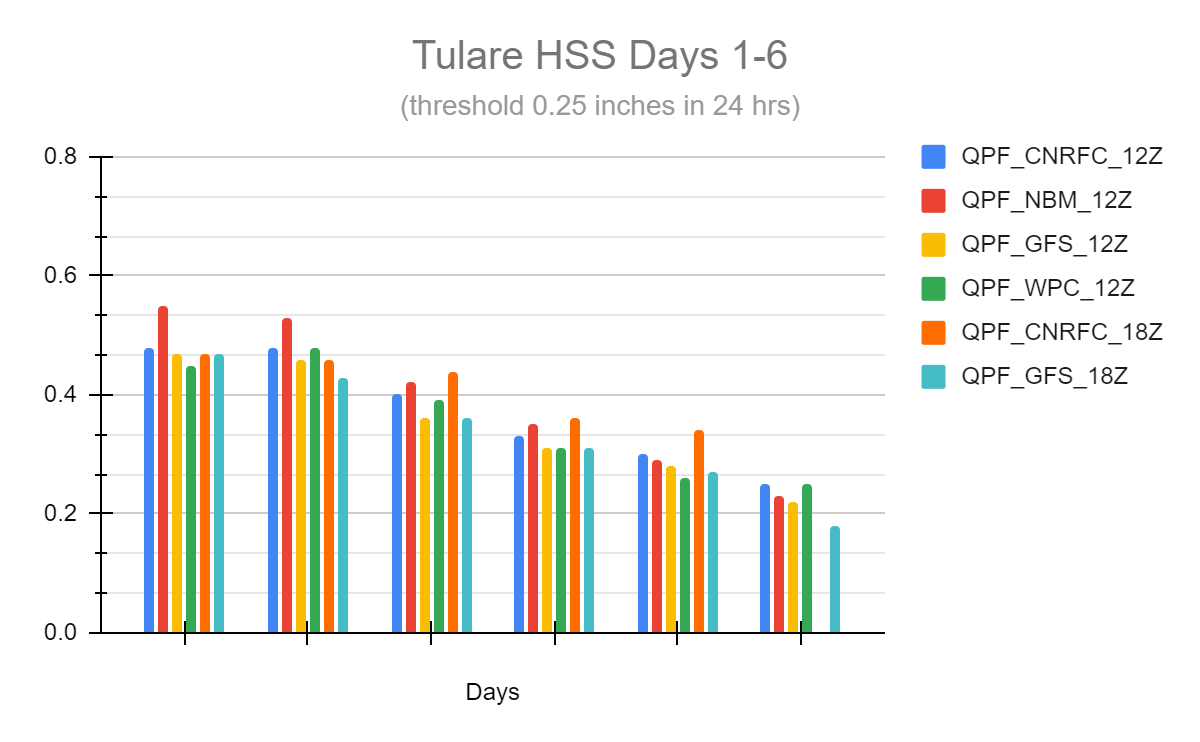  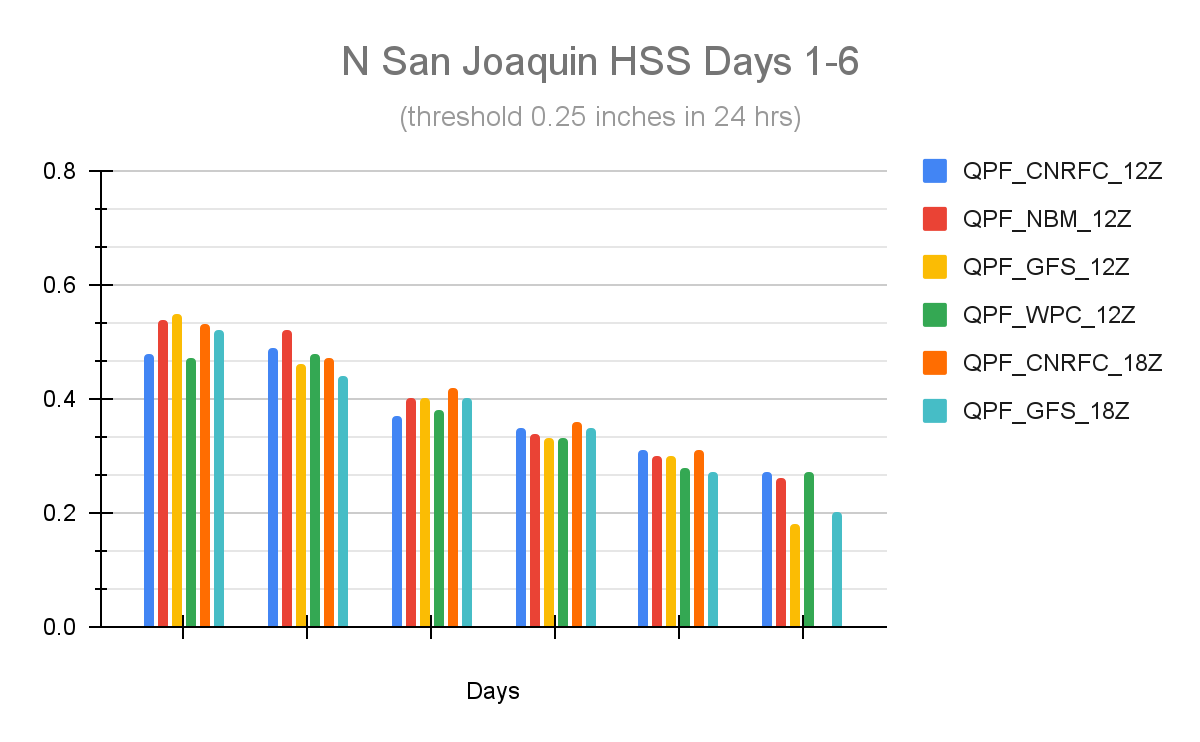 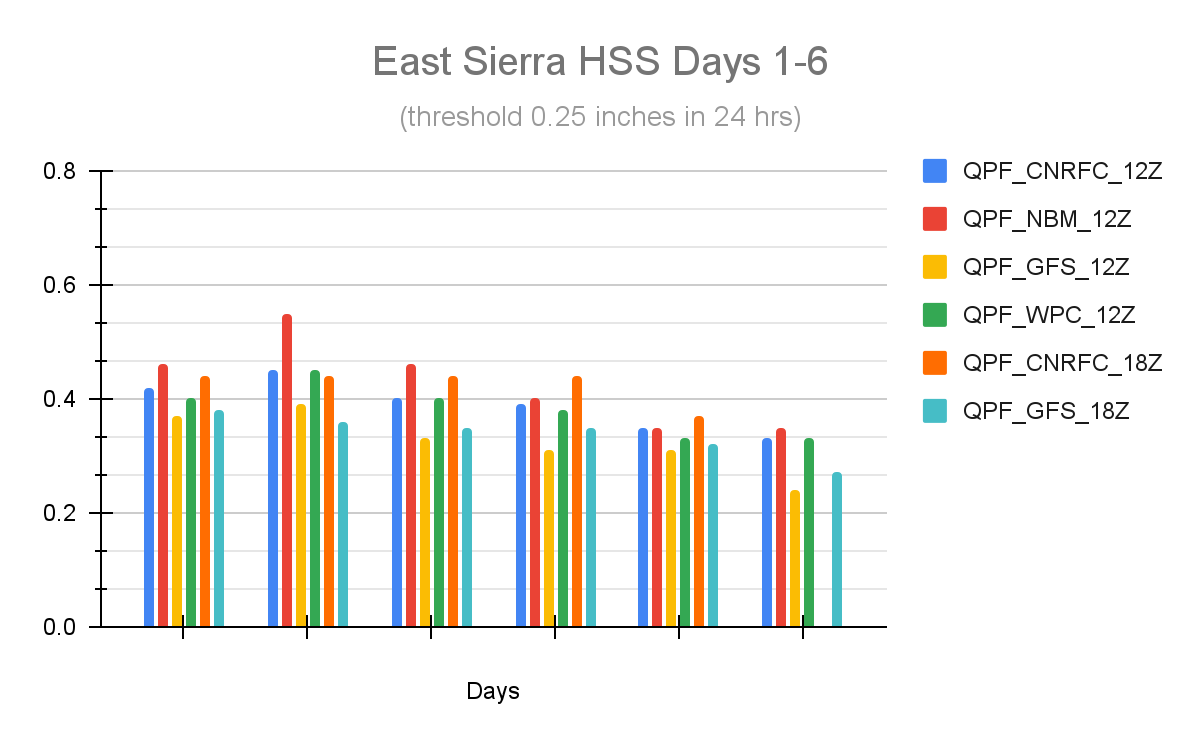 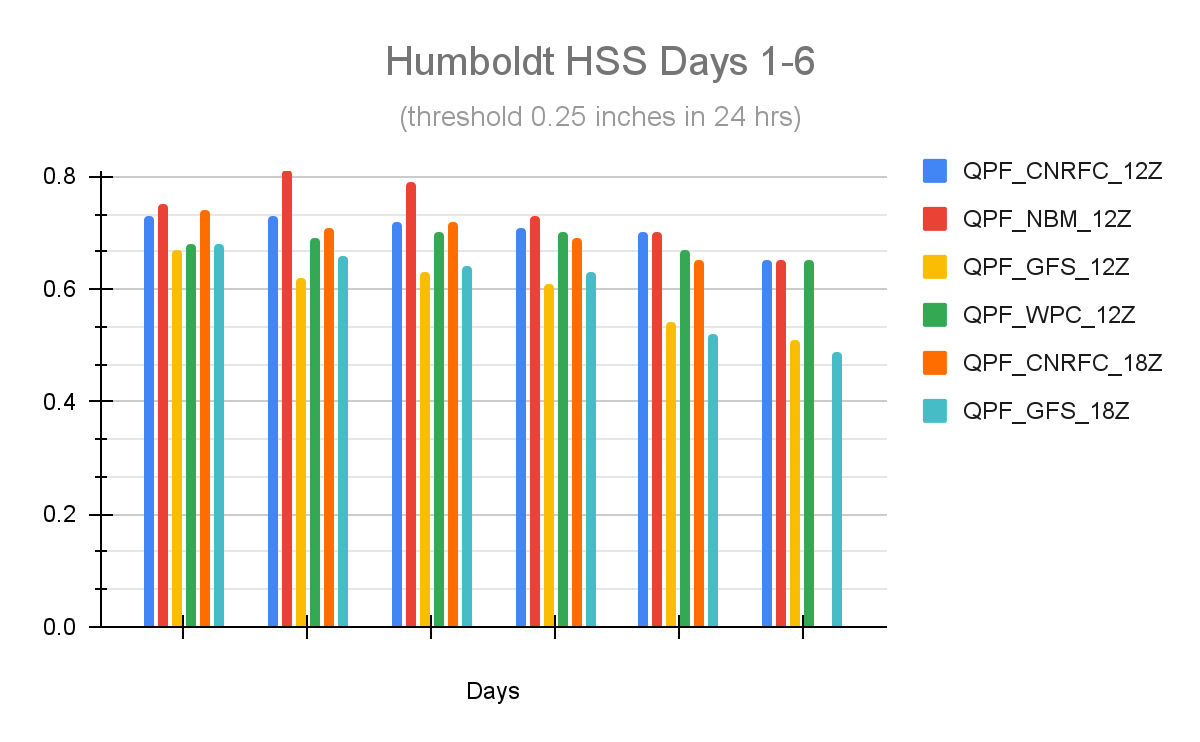 | ||||||||||||||||||||||||||||||||||||||||||||||||||||||||||||||||||||||||||||||||||||||||||||||||||||||||||||||||||||||||||||||||||||||||||||||||||||||||||||||||||||||||||||||||||||||||||||||||||||||||||||||||||||||||||||||||||||||||||||||||||||||||||||||||||||||||||||||||||||||||||||||||||||||||||||||||||||||||||||||||||||||||||||||||||||||||||