
Heavy Precipitation Event Navigation: General introduction | Precipitation | Weather Synopsis | Hydrologic Impacts At the time of the preparation of this report, just over 26 years have passed since a prolonged series of back-to-back Pacific storms whose origins were deeply rooted in the subtropics below Hawaii slammed into the west coast, taking aim at northern California in the middle of February 1986. A destructive combination of heavy precipitation and moderately-high snow levels lasting for nearly 10 days brought catastrophic flooding to much of northern California and also carried across the Sierra Nevada crest into western Nevada. By the time it was over, many precipitation gages over much of California and western Nevada measured storms totals over half of their annual normals. Just to highlight the tremendous amount of precipitation that occurred, the precipitation gage at Bucks Lake at an elevation of 5,750 feet in the northern Sierra Nevada received 55.72 inches of precipitation, mostly in the form of rain, during the 10-day period. Based on damage estimates by Cal-OES and a 1999 assessment of the damages by the U.S. Army Corps of Engineers, dollar losses totaled $720 million statewide, of which $466 million occurred in the central valley. The loss of human life totaled 13 statewide in California with one of those in the central valley. Nearly 14,000 homes and just over 1,100 businesses were damaged or destroyed by flooding statewide, which included just over 7,000 homes and over 600 businesses located in the central valley (source: "FloodSAFE California Overview" PowerPoint presentation by Michael Mierzwa, DWR Division of Flood Management). More than 50,000 Californians were evacuated from their homes. For many, the storms of February 1986 may best be remembered for the flooding of the Yuba River into the towns of Linda and Olivehurst following a major levee break in the area, as well as the flooding that occurred along the Russian and Napa Rivers. In reading through some of the literature, one can find several reports where quick reaction and high-risk repairs taken by flood officials prevented a much larger flood disaster. Across the peaks of the northern Sierra Nevada into western Nevada, it was a similar story with $17 million in flood damages in the Truckee Meadows and Carson City. There were two known fatalities as a result of the flooding. President Reagan declared five counties in western Nevada as federal disaster areas. Even with the higher snow levels, snowpack in the high Sierra rose from 85 percent of normal prior to the storms to over 140 percent of normal when it was over. Runoff filled nearly all reservoirs of western Nevada in less than a week's time. A quick internet search of the February 1986 storms yields several state/federal agency reports and even some private first-hand accounts documenting this benchmark storm/flood period in California and Nevada history. While most of these reports provide detailed descriptions of the flooding impacts, fewer offer more than a narrative account of the weather that took place during this event. The primary goal of this report is to augment those reports with observed weather/hydrology data collected during the storms, hopefully to allow better analogous comparisons to future storms of this magnitude. Readers are encouraged to browse through the online reports to get a sense of the magnitude of this event from a flooding perspective. Based on the existing technology of the time that seems almost crude by today's standards, some data were either limited and/or inaccessible at the time. For example, consider that at the time, there was only one NWS weather radar in California, which was located in Sacramento. Today, there are a total of 15 modern NEXRAD radars scanning the CNRFC area of responsibility. Sources of data collected in this informal report are quoted only when available, as much of the data comes from miscellaneous notebooks, informal post-analysis reports that were prepared during and/or shortly after the event, and data found on the internet. Another reason for preparing this report is to serve as a quick reference for our staff at the CNRFC, combining data from various sources and sharing on our website to anyone interested in learning more about the February 1986 flooding. Three distinct storm systems brought precipitation to the region February 11-20, each one wetter than the previous in the northern portion of California and Nevada, while the second storm was the wettest in southern California. Although the entire region received precipitation from these storms, heaviest totals were in northern California, where subtropical moisture was concentrated for an extended period of time during the peak of the third storm in the series. Storm-total precipitation amounts were quite impressive, with many stations exceeding 50% of their annual average in a 10-day period from February 12-21. According to the DWR publication "Historic Rainstorms in California" (1997), overall 187 stations reported their heaviest rainfall totals for any consecutive 10-day period. Several stations saw totals with a return period of more than 1,000 years. On February 17th, at the height of the storm period, 10 stations scattered across northern California reported 24-hour rainfall totals of more than 10 inches. Some of the impressive totals in northern and central California west of the Sierra Nevada crest include amounts in excess of 50 inches at a couple of gauges in the Feather basin, nearly 40-inch totals in the Russian and Napa basins, and amounts over 30 inches in the American, Stanislaus, and San Joaquin basins. Click the following links for storm total precipitation for selected California city and mountain locations. Strong moisture transport into the Sierra Nevada contributed to efficient lee-side precipitation processes. In an average February, the ratio of precipitation in Blue Canyon, CA, compared to the Reno/Tahoe International Airport (KRNO) is nearly 11:1. During the February 1986 storm event, the more efficient "spillover" processes led to a ratio of about 7:1. For the February 11-21 period, some locations in the Tahoe-Truckee basin exceeded 30 inches, while stations in the Carson-Walker basin reported more than 20 inches. Here is a link to western Nevada precipitation totals, and a link to east-side Sierra Nevada and state of Nevada SNOTEL precipitation totals. The following link contains an interactive map of daily and storm-total precipitation for February 11-20. Data contained on the map has only undergone automated quality control and should be used with caution. The table below shows how February 1986 precipitation compared to a normal February in the northern Sierra Nevada and the San Joaquin basin. It also shows that February 1986 ranked as the wettest February on record for both areas.
The table below shows the top-5-ranked monthly precipitation in February for the 8-station index. The precipitation in February of 1986 shattered the previous record (set in 1938) by 7.66 inches. Since then, the precipitation in February 1998 also surpassed the old 1938 record, but still came in nearly 6 inches below the record set in 1986.
The San Joaquin 5-station index showed a similar story. The table below shows the top-5-ranked monthly precipitation in February for the 5-station index. The precipitation in February of 1986 broke the previous record (set in 1936) by 2.89 inches.
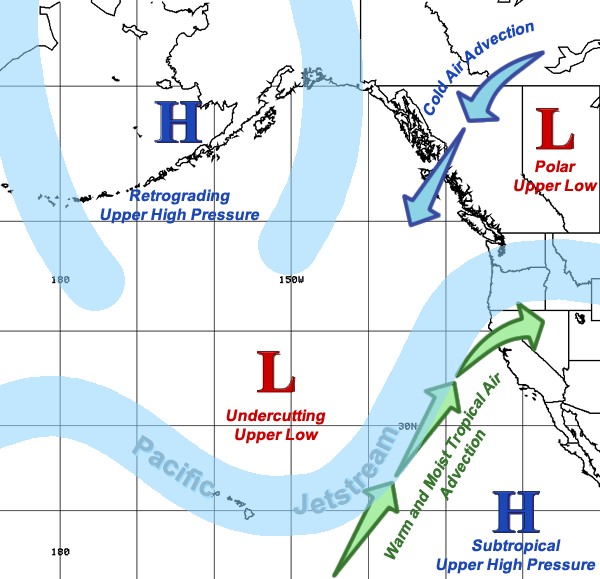
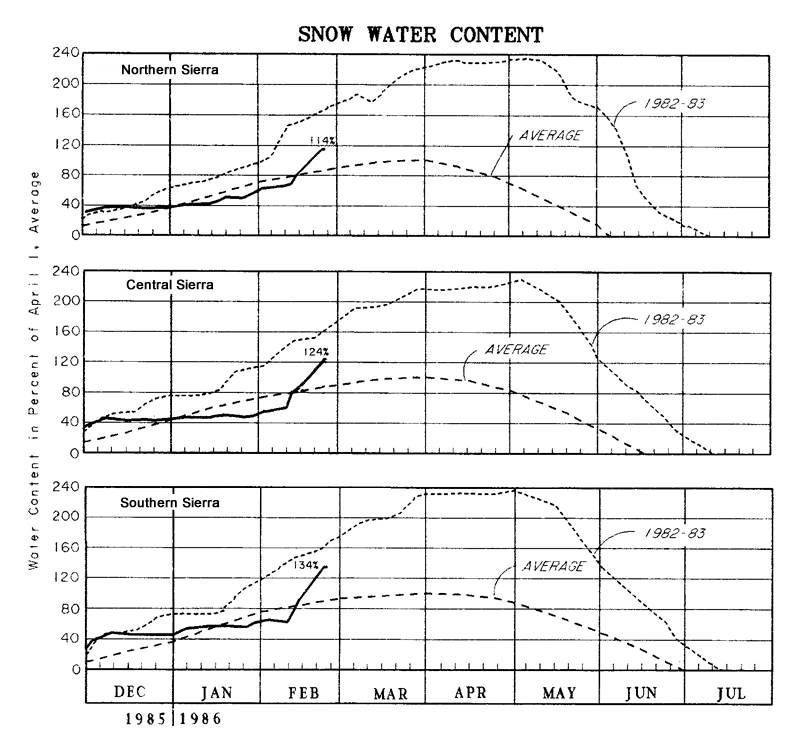
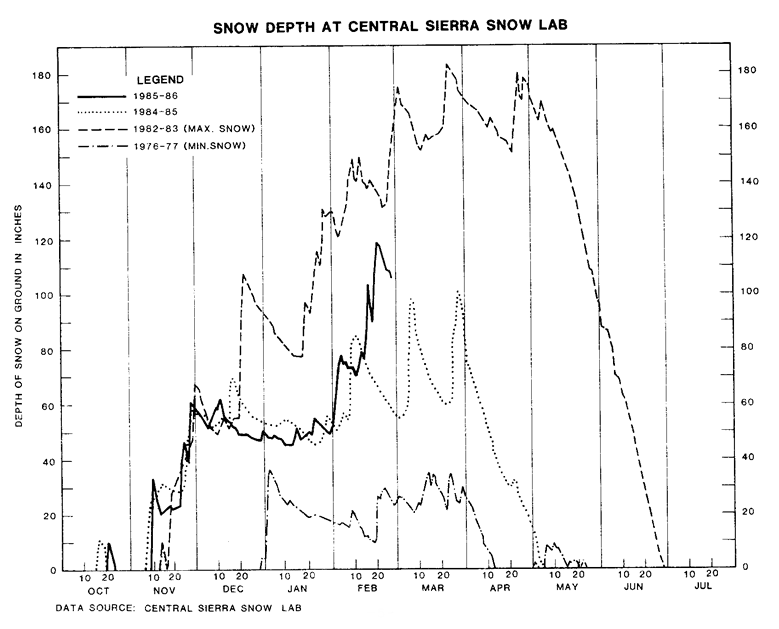
In terms of snow pack conditions, the Sierra Nevada water content in percent of the April 1 average (see plot) rose from an average of around 60% of normal at the beginning of February to near 125% at the end of the 10-day event. The depth of snow on the ground (see plot) at the Central Sierra Snow Lab near Soda Springs went from 70 inches at the start of the event to 120 inches by the end. As is often the case with many record-breaking precipitation events across the west coast, a strong and long-lasting “pineapple express” pattern developed over the eastern Pacific during the middle half of February 1986, which ended up producing anywhere from 50 to over 100% of total annual precipitation for many locations in California and Nevada. As is typical with this type of set-up, snow levels remained above 7,000 feet through the heaviest portions of the event, which not only provided more liquid precipitation to the mix, but actually started melting the snowpack already in place across low and mid elevations of the Sierra Nevada. This southwesterly flow pattern persisted for nearly ten consecutive days. The schematic below (Figure 1) depicts the setup of the key ingredients across the northeastern Pacific Ocean as the significant precipitation event took shape and affected California inland toward northern Nevada in mid-February of 1986.
Figure 1. General weather pattern across the northeast Pacific Ocean and west coast for mid-February 1986. The table below contains links to loops of a limited set of satellite imagery. The first loop shows 3-hourly infrared (IR) satellite images for February 11-14th, while the second loop contains only once-a-day lower-resolution scanned infrared images taken mostly at 4 AM PST, but covers nearly the entire storm period.
While precipitation began across northern California during the day on February 11th, it wasn't until the 12th and 13th that the potent stream of warm and moist tropical air was advected into the state. The sounding from KOAK (seen in the table below) consistently showed over 0.8” precipitable water at the site from the morning of Feb 12th through the evening of the 19th. Precipitable water values peaked three times, first near 1.2" on the afternoon of the 12th, 1.3” on the morning of Feb 14th, and near 1.4” on the afternoon of the 17th. These values are near or above the 99th percentile for the month of February. During the first peak, the sounding shows a nearly saturated environment from the surface vertically through 700 millibars (mb), which allowed for efficient warm rain processes to occur across northern and central California. During the second event, a deeper saturated environment existed from the surface vertically to near 500 mb, providing evidence of a very deep moisture transport across the entire state and across the Sierra Nevada crest.
By the 19th, the warm rain transitioned to heavy snow in the Sierra Nevada as the subtropical air mass was shunted south and replaced by colder air, with snow levels falling to around 5,000 feet by the 20th. Despite the warm nature of the storm series, the Sierra Nevada measured 5 to 17 feet of storm-total snowfall for the 10-day period, partially due to the arrival of this colder air in the later stages of the event.
A look at the first loop in the table of NCEP Model Reanalysis Loops below shows the 500 mb height pattern through the ten-day period. Leading into the event, upper-level ridging over the Gulf of Alaska retrograded westward and settled over western Alaska by the 13th. This allowed a series of undercutting mid-latitude low-pressure systems to develop over the Pacific and eventually stream eastward into the west coast. The beginning of the wet pattern developed under weak ridging aloft over California as the arrival of moist Pacific air combined with warm air advection to produce light to moderate precipitation. The first upper low moved toward the west coast and kicked the ridge eastward late on the 14th. This marked the beginning of the heavier precipitation across the region that continued nearly unabated through the 20th. Beginning on the 15th, the blocking high over Alaska forced very cold continental air to spread southwestward from western Canada over the eastern Pacific while warm ridging amplified near the California coast. Over the span of the next three days, this clash between opposing air masses enhanced a quasi-stationary baroclinic zone that extended offshore from northern California. Heavy precipitation continued along this boundary through the 18th, with the heaviest precipitation noted on the 17th. A second upper trough managed to erode the ridge and move into northern California late on the 18th, which brought a cooler air mass into play across the northern portion of the region, lowering snow levels, and continuing moderate to heavy precipitation through the 19th. Stronger ridging finally developed by the 21st, which directed the upper jet northward back into British Columbia and brought a reprieve to the thoroughly soaked region. As seen in the 850 mb wind loop, low-level winds were persistently from the southwest throughout the duration of the event. Three distinct periods of stronger winds focused on northern and central California, with 30 to 35 knots on the 12th, 50 to 60 knots late on the 13th into the 14th, and 40 to 50 knots on the 16th through the 17th. The southwesterly direction of the strong winds was ideal for orographic precipitation on the west-facing slopes of the northern and central California coastal mountains and contributed to flooding across the Russian and Napa basins, Sonoma area, as well as the Santa Cruz mountains during the 17th and 18th. The 700 mb wind loop shows strong southwest flow extended inland to the northern and central Sierra Nevada as well, with strongest enhancement across the Feather and American basins. This is evidenced by the nearly 56 inches of precipitation reported at Bucks Lake in the Feather basin, at elevation 5,750 feet. Blue Canyon along Interstate 80 in the American River basin (elevation 5,280 feet) reported 33.81” precipitation during this period. West central Nevada was not immune to the heavy precipitation from the 18th onward, breaking precipitation records and causing flooding along the Truckee and Carson Rivers, amongst others. Low-level winds diminished to 20 knots or less by the 19th and remained relatively weak through the remainder of the period. The following table provides links to 6-hourly NCEP/NCAR Reanalysis data composites for the period of February 11, 1986 at 12 UTC (4 AM PST) through February 21, 1986 at 12 UTC (4 AM PST).
The table below features reprints of hydrographs of rivers and reservoir inflows in California courtesy of a DWR report entitled "The Floods of February 1986". The hydrographs of western Nevada and the east side of the Sierra Nevada were constructed manually from hourly data recorded by the NWS Forecast Office in Reno during the event.
The table here, also excerpted from the DWR reports "The Floods of February 1986" and Bulletin 69-86, released in May 1988, lists several of the river gages throughout northern and central California with their peak stage/flow information during the February 11-21 period, along with comparisons to current historical record peak stage/flow data. As shown in the bold text referenced in the table linked above, the sequence of February 1986 storms certainly left its mark in the record books with record-breaking streamflows that still stand today, focusing on the Russian and Napa River basins as well as the lower portions of the Sacramento and American River watersheds. The table below lists a sample of reservoir data compiled from preliminary data in a report from the California Dept. of Water Resources for the February 1986 storm events.
Listed below are several brief highlights of the flooding, most excerpted from a DWR preliminary data report of the February 1986 storm.
One of the more unique and notable flood impacts occurred on the American River with the collapse of an earthen cofferdam built in 1974 to hold back water during the construction of Auburn dam. The temporary dam was overtopped on the 18th of February, eventually resulting in a total breach of the dam later that same day. An estimated peak flow of 250,000 cfs surged into Folsom Reservoir, requiring all gates to be opened and releases of 130,000 cfs to be passed through downstream Nimbus Dam (15,000 cfs higher than the downstream levee capacity through Sacramento). Fortunately, the levees along the American River withstood the stress of these high-risk flows. Originally designed to hold 1.01 million acre-feet of water, Folsom Lake's capacity was reduced to 977,000 acre-feet as a result of the sedimentation from the Auburn cofferdam. A series of photos shows the original cofferdam before and after the February 1986 event (slides 1 and 5) and 3 images taken during the cofferdam failure on the 18th of February (slides 2 through 4). All of the images in the slideshow appeared in a presentation entitled "Dams and Disasters: A brief overview of dam building triumphs and tragedies in California's past", authored by J. David Rogers and Karl Hasselmann, University of Missouri-Rolla. Images 2, 3, and 4 were taken by Robert Christopherson. A 1987 follow-up report by the U.S. Army Corps of Engineers determined the February 1986 flood was about a 70-year event on the American River and that Folsom Reservoir was capable of controlling a 63-year flood event to the downstream levee capacity of 115,000 cfs. According to California State Parks, Folsom Dam alone prevented an estimated $4.7 billion dollars in flood damages. |
||||||||||||||||||||||||||||||||||||||||||||||||||||||||||||||||||||||||||||||||||||||||||||||||||||||||||||||||||||||||||||||||||||||||||||||||||||||||||||||||||||||||||||||||||||||||||||||||||||||||||||||||||||||||||||||||||||||||||||||||||||||||||||||||||||||