|
Heavy Precipitation Event Navigation: General Summary | Precipitation | Weather Synopsis | Hydrologic Impacts | Forecast Verification After two dry Water Years (2021 WY: CA 11.13" (3rd driest - NCEI), NV 6.66" (4th driest - NCEI) and 2020 WY: CA 15.64" (14th driest - NCEI), NV 7.05" (9th driest - NCEI)), which ranked among California and Nevada’s top 20 driest for statewide precipitation (data back to 1895), the 2022 Water Year (Oct 1, 2021 through Sep 30, 2022) got off to a wet start when California and Nevada received historical amounts of precipitation in October 2021. After dry Octobers the last two years, Oct 2021 was the third wettest October since 1895 for California and Nevada. California statewide precipitation was 4.32 inches (about 350% of avg) and Nevada statewide precipitation was 2.02 inches (about 257% of average) for October 2021. The Northern Sierra (8 stn Index) had 12.71 inches which is the second-wettest October in 102 years and the San Joaquin (5 station index) received 6.61 inches ranking 5th wettest in 118-year history. At the end of October 2021, the Snow Water Equivalent for California was 133% of normal for the date for the state and for the Northern Sierra was 200% of normal for the date and the Central Sierra 125% and Southern Sierra was 133%. Several moist and strong systems brought precipitation to California and Nevada in October 2021, especially later in the month (Oct 17-26) for above-normal precipitation for most of Northern and Central CA and most of Northern and Western Nevada. Freezing levels were generally above 5000 ft with the storms and above 8000 ft at times for snow mainly over higher elevations. The last two systems intensified rapidly with a record low pressure of 942.5 mb recorded for the Pacific Northwest on October 24 with the last system. Oakland, Vandenberg, Reno and Elko, and Vegas all had at least one sounding with Precipitable Water Values in the top 30 (since 1948) between Oct 24 and 27. Record daily precipitation amounts and some all-time daily precipitation records fell with the storm October 24-25 and rapid rises were seen on creeks, streams, and rivers, and soil moisture substantially improved. As a result of heavy precipitation and winds, some localized flooding, mud/debris flows, and power outages occurred. Several all-time daily precipitation records in Northern California were broken on October 24. The percentage of California in D4 Exceptional Drought improved from 45.66 percent on October 12, 2021 to 38.74 percent on October 26, 2021 with most of the improvement seen over Northern California. The percent area of Extreme Drought D3 improved from 67.6 percent on October 19, 2021 to 58.03 percent on October 26, 2021 with the improvement mainly seen in Western Nevada (around Lake Tahoe and north). This paper will focus on the storms of late October 2021 (Oct 17-26) with the most emphasis given to the historic precipitation event on Oct 23-26 over Northern and Central CA and most of Northern and Western Nevada. The 2022 Water Year (Oct 1, 2021 through Sep 30, 2022) got off to a phenomenal start in terms of precipitation when a series of storm systems moved across the west coast, culminating with a historic moisture plume intersecting the coast just north of San Francisco on October 24. Heaviest precipitation amounts were focused on an area near and north of Interstate 80 as the moisture plume was slow to move south across the region on October 24. This resulted in several October and All-Time daily precipitation records broken. Unfortunately, this record-breaking start to the 2022 Water Year was met with an exceptionally dry stretch to start the 2022 Calendar Year, pushing much of the region below normal for the 2022 Water Year and exacerbating drought conditions across California and Nevada. The link in the table below redirects to an interactive map displaying quality-controlled preciptation in both point and gridded formats at several different time intervals. These include: daily precipitation amounts ending at 5 AM PDT, three distinct periods of multi-day precipitation totals, and the entire stretch of time from October 17, 2021 at 5 AM PDT through October 26, 2021 at 5 AM PDT.
The first table below contains links to daily precipitation amounts ending at 5 AM PDT in both gridded static imagery and point XML format. Also, multi-day precipitation totals are available in XML format using the links in the second table below. This data is quality-controlled by CNRFC hydrologists, and used as input into hydrologic models as MAPs (Mean Areal Precipitations).
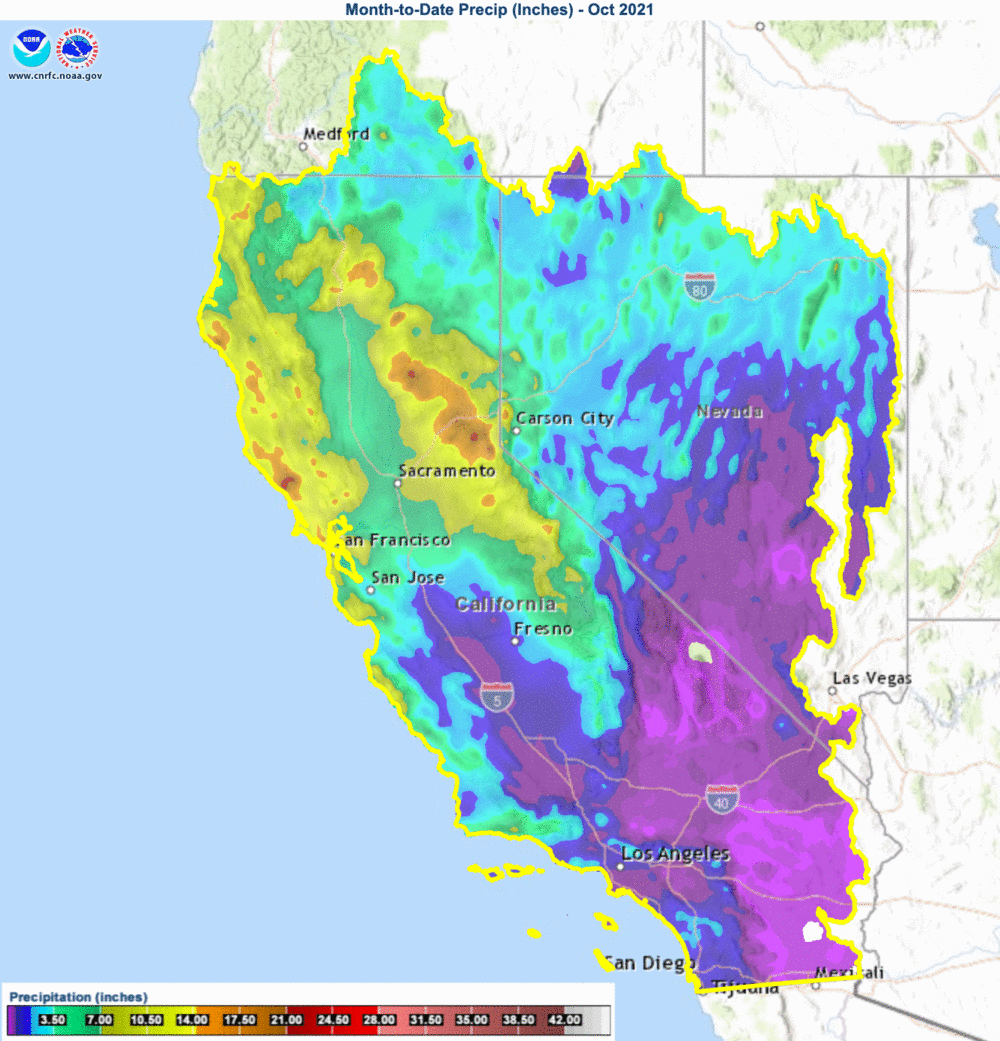
The series of maps below display precipitation data for the month of October 2021, including the aggregate of daily quality-controlled totals by the CNRFC staff, average precipitation, departure from average, and finally the percent of average. The focus of the heaviest precipitation during October 2021 was most of northern CA and portions of northern NV, with the majority of the precipitation recorded with the tropical moisture plume intersecting the coast from October 23 through October 25, 2021. With October at the beginning of the Water Year, this provided a substantial surplus of precipitation as compared to average. By the end of the month, the 2022 Water Year (Oct 1 through Sep 30) started with a +3" to +6" surplus at lower elevations (greatest near Sacramento), while for coastal river basins between the Eel River and Big Sur coast, and Cascade/Sierra river basins from the Shasta Lake drainage to the Merced River, anomalies were +5" to +10" above average with some locations approaching or just exceeding +15" over the Russian River basin and inland over the Feather, Yuba, and American River basins. This created a wide swath of well above-average precipitation (300 to as much as 700 percent of average) across northern CA and northern NV with the focus along and just north of the Interstate 80 corridor from the San Francisco Bay Area northeast to the Lake Tahoe and Reno areas. To navigate between the four types of maps available depicting October preciptation, click on the desired buttons below. Also, for an interactive version of these graphics, click on the links below each of the buttons.
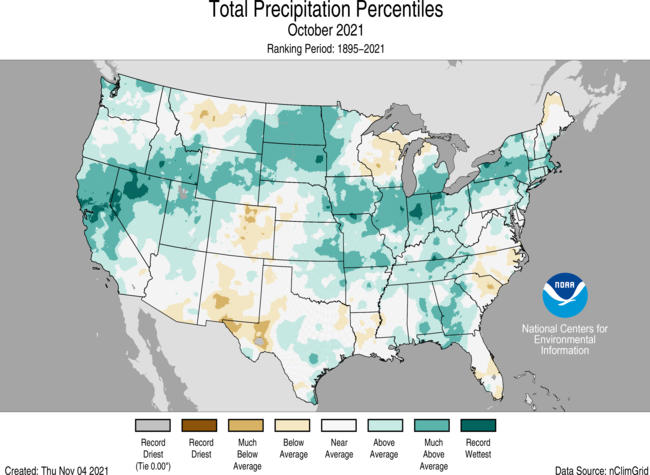
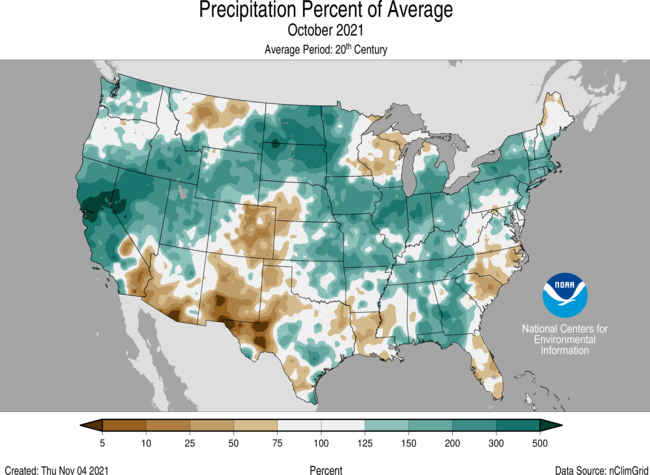
Below is another depiction of October 2021 precipitation, provided by the National Centers for Environmental Information (NCEI). This also shows the extent of the positive anomalies across northern CA and northern NV, focused on and around the Interstate 80 corridor (500% and greater percent of average), where some locations recorded their wettest October on record.
The California Department of Water Resources tracks precipitation at three distinct indices over the higher terrain from the Shasta Lake drainage down the length of the Sierra. The long historical record back to the early part of the 20th century provides critical information on the status of the state's water supply compared to previous years. The 8-Station Index (Northern Sierra) covers watersheds from Shasta Lake through the American River. The 5-Station Index stretches across the entire San Joaquin River basin. Finally, the 6-Station Index coverage includes the Tulare Basin. The data below shows daily precipitation amounts from October 17 - 26, 2021, for the three California Department of Water Resources indices, culminating with the heaviest amounts falling on October 24 into October 25 (ending at 5 AM PDT) over the 8-Station and 5-Station Indices before shifting south over the 6-Station Index on October 25 into October 26 (ending at 5 AM PDT). Also, this data makes it apparent where the focus of the heaviest precipitation fell, as the tropical moisture plume initially intersected the coast across northern CA and stalled, before narrowing and eroding as the feature eventually dropped southward across the region.
The table below puts the historic nature of the precipitation event and overall October precipitation into persepctive, showing where October 2021 precipitation totals ranked in comparison to the period of record for each of the three California Department of Water Resources indices. This was a particulary historic month for the 8-Station Index (Northern Sierra), as the October 2021 total (12.71") ranked second wettest with only October 1962 recording more precipitation (17.12"). The 5-Station Index (San Joaquin) was also notable for October 2021 amounts, being 5th wettest on record, while the 6-Station Index (Tulare) was less impressive, but still ranked 14th wettest.
The historic nature of this early-season precipitation event was noteworthy with the numerous October daily precipitation records set, and in some cases shattering the previous record. With the deep tropical moisture plume initially intersecting the west coast near the Interstate 80 corridor on October 24 and making little progress southward throughout the day, the majority of the October daily precipitation records were located in the Russian/Napa River basins down across the San Francisco Bay Area and then inland over the southern Sacramento Valley, adjacent Sierra Nevada, and across the Reno/Tahoe area. The table below is a collective of October daily precip records that were set during the heavy precipitation event, also noting the previous record that was broken.
To point even further to the historic nature of this heavy precipitation event, several locations also tallied their greatest all-time daily precipitation total for the station's period of record. Below is a table listing each of these records along with the previous record date and precipitation total.
The table below provides a link to a loop of modeled snow water equivalent (SWE) imagery showing the evolution of the snowpack through the periods of precipitation from October 17 - 26, 2021. Given the tropical nature of the precipitation event, snow levels were relatively high across the area, rising to around 10,000 to 12,000 feet during the height of the precipitation on October 24, 2021. This was above most Cascade and Sierra peaks with minimal snow accumulation occurring. Finally, as the colder airmass settled in across the region with frontal passage on October 25, 2021, snow levels dropped to approximately 5,000 to 6,000 feet, allowing several feet of snow to accumulate with SWE values from 3" to 6" common over the highest terrain of the Cascades and Sierra. The data in the SWE imagery is provided by the NOAA / NWS / National Operational Hydrologic Remote Sensing Center (NOHRSC), and is described as a multi-layer, physically-based snow model operated at 1-km spatial resolution with a wide variety of data inputs used to create the final product. These inputs include: air flights, satellites, automated sensors, and observer reports.
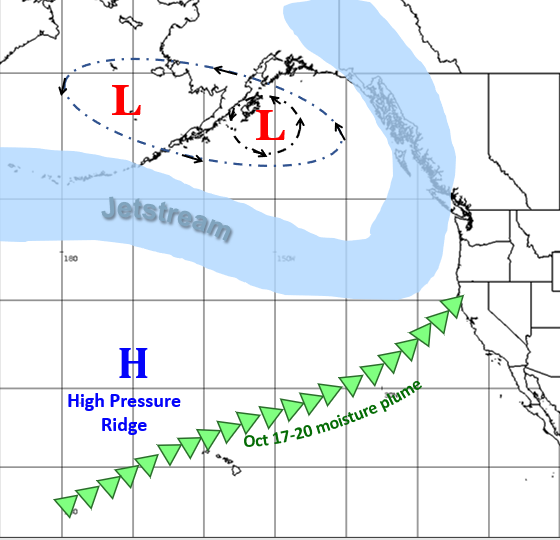
Overview A series of progressively-stronger storms affected the region in mid to late October, culminating in the strongest atmospheric river (AR) to make landfall in the Bay Area in 40 years. Three low pressure systems developed over the northeast Pacific, impacting the west coast one after another. These systems made landfall on October 19th, 21st, and 23rd. The last two storms underwent bomb cyclogenesis, strengthening by 40 mb in 24 hours. The third and final storm was also the beneficiary of a robust subtropical moisture tap, resulting in a powerful AR that broke several rainfall records, caused localized flooding, debris flows, power outages, and heavy mountain snow. October 17-20 (Sun-Wed), 2021 The first system approached in the form of a long cold front extending out from a surface low/upper trough west of the PacNW. A stream of moisture also fed into northwest CA around the front. Precipitable water (PW) values were initially around 1.25-1.50” before interaction with a drier downstream air mass eroded these values down to around 0.75-1.00”. A coastal barrier jet ahead of the front produced breezy south to southeast winds across northwest CA in addition to occasionally heavy precipitation. The front made landfall overnight on the 19th before weakening as it moved inland across northern CA late Wednesday morning. The plume of moisture then shifted to the south, focused over the Central Coast and remained nearly stationary for most of the day. This allowed precipitation to continue across northern/central CA the rest of Wednesday. The majority of the precipitation from this first system occurred north of I-80 and west of I-5. Highest totals from Tuesday morning to Wednesday morning were along the northwest CA coast at around 0.75-1.50”, with peak values around Cape Mendocino of just over 2”. Precipitation quickly dropped off to the south and east with little to no rainfall recorded south of the Bay Area for the first 24 hours. The Central Coast mountains saw the heaviest precipitation on Wednesday as the system shifted southward, with around 1.00-1.50” over the Santa Cruz Mountains the next 24 hours. October 21-22 (Thu-Fri), 2021 A deep trough remained off the west coast while the next low pressure system sat between 130W and 140W with another cold front extending out over the Pacific. This second low pressure system underwent bomb cyclogensis, deepening by more than 40 mb in a 24 hour period from 12z on the 20th to 12z the 21st, reaching a minimum pressure of 951 mb. Moisture remained over the region from the previous system and combined with an additional moisture plume advecting into the area. This brought PW values up to nearly 1.50” later in the day as well as increased the likelihood of widespread precipitation. The trough moved inland across northern California later Thursday and into Friday, spreading precipitation across the area. The majority of the precipitation once again fell north of I-80 and west of I-5 from Thursday into early Friday morning with the highest totals along the northern California coast at around 2-4”. By early Friday, the cold front was moving across the northern Sierra with a trailing shortwave over northern California. This produced widespread precipitation across the northern half of the Sierra and into the South Bay/Central Coast. Precipitation began to weaken later Friday as the front and upper forcing separated while moving further into central California and northern Nevada. The bulk of the precipitation from Friday into Saturday morning this time fell east of I-5 and around the central Sierra northward at about 0.75-2.00”. October 23-26 (Sat-Tue), 2021 The front/trough continued to weaken and produce light precipitation over northern CA/NV early Saturday as a powerful AR and strengthening low pressure system approached. Forecast models had been suggesting the potential for an AR for several days with the ECMWF showing at least a 70% chance of one reaching northern/central CA as soon as 6 days out. Early on the 23rd, the OPC 12z surface analysis over the eastern Pacific showed a rapidly-intensifying low-pressure system with a front extending out from the low to the southwest along with a robust tropical moisture plume. The analysis also expected hurricane-force winds to develop out over the ocean as the system approached. The leading edge of the storm arrived Saturday night with PW values 1.50-1.70” along the coast and 850 mb winds of 50-60 kt. The heaviest precipitation was forecast for Sunday and Monday as the main moisture plume and front progressed across the area. Similar to the storm on the 21st, this low-pressure system underwent bomb cyclogenesis, strengthening by over 40 mb between 12z on the 23rd and 12z on the 24th. The central pressure of the low dropped to 942.5 mb offshore of the PacNW which was the all-time lowest ever recorded in that area second only to post tropical cyclone Harriet in 1977. As one can imagine with such rapid intensification, this storm produced strong winds across the region resulting in power outages and numerous downed trees. Reanalysis of 250 mb winds also showed an upper level jet moving across CA for much of Sunday. This upper-level support in combination with strong onshore flow, moisture flux, and isentropic lift provided the ingredients for moderate to heavy precipitation. Heavy rainfall began early Sunday along the coast near the Eel basin through the Russian/Napa River basins as well as into the Santa Cruz Mountains and northern Sierra. These mountainous areas benefited from favorable orographics, resulting in decent snow falling across elevations above 7,000 feet. Peak IVT values for this system of over 1200 kg/m/s were observed around midday across Marin and Sonoma Counties with a maximum value of 1221 kg/m/s near Point Reyes. In fact, this station recorded IVT values of over 250 kg/m/s for 63 consecutive hours. During times of strong moisture transport, the profiler at Oroville reported the development of a Sierra barrier jet with southerly winds of nearly 70 kt. The combination of these factors resulted in heavy rain rates across northern and central CA on the 24th. Multiple rainfall records were broken on this day. All-time daily records were set at: Sacramento City, Santa Rosa, Sacramento Executive Airport, Blue Canyon, Ukiah, and South Lake Tahoe. Daily records for the month of October were set at: Kentfield, Napa, San Francisco (both downtown and the airport), Oakland, Oroville, Sacramento International Airport, Reno Airport, and Tahoe City. KOAK broke daily PW records for both the 12z (24th) and 00z (25th) soundings Sunday at 1.65”/1.62” respectively. The 12z PW value was also a record for the month of October. The moisture plume impacting northern/central CA and providing the means for these broken records continued to shift southward the rest of Sunday and through Monday with rain rates forecast at a quarter to a half an inch per hour. Precipitation totals over the 24-hour period ending at 5 am Monday morning reported the highest amounts over the northern Sierra and Central Coast mountains at 5-12”. This ended up as the wettest day during this series of storm systems. A cold front continued to progress across northwest CA early Monday while an area of convective showers developed behind the front. Isolated thunderstorms were observed along the northwest coast and into the Klamath basin. An upper trough was also trailing the surface front off the CA coast as a moisture plume took aim into the central Sierra and southward to Point Conception. This shifted the focus of the heaviest precipitation to the southern CA coast, western Transverse Ranges, and central Sierra. At the end of the day, another daily rainfall record was broken for the month of October at Tahoe City. This was also the second-wettest day in the historical record for that location. Precipitation continued to progress southeastward Monday evening and overnight as rain rates finally began to diminish over CA. The passing upper trough provided for some light lingering showers over northern CA on Tuesday. The system finally began to wrap up on Wednesday as another weaker front brought some light precipitation to the north coast. When all was said and done, this powerful AR was the strongest to make landfall in the Bay Area in 40 years, dumping 9-15” of precipitation over the northern Sierra and 6-13” across the Central Coast Mountains. Between the 23rd and the 26th, the state of CA recorded 7.32% of its water year average precipitation. Most of the snow impacts were observed above 7,000 feet as over 12” of snow fell across the Sierra, with some locations along the Sierra Crest receiving over three feet during the lifetime of the storm. Lower Lassen Peak at 8,250 feet reported a 3-day SWE increase of 9.6”. There were several reports of localized roadway flooding and small stream flooding across the state. A debris flow occurred in Monterey County along with multiple rockslides/landslides across the region causing local area highway closures. Weather Graphics
The table below provides links to atmospheric soundings across the region during each storm event from October 17-26. Tropical moisture that entrained into the strengthening low pressure systems resulted in well above normal precipitable water values. Multiple radiosonde locations saw precipitable water values in the top 40 for October with KOAK breaking a daily record twice. Freezing levels began well above 10,000 ft on the 17th before the first cold front lowered levels across the region.Tropical moisture allowed freezing levels to rise above 10,000 ft between the first and second storm systems. Levels then generally lowered throughout the final atmospheric river event. Additionally, strong south/southeast winds at lower levels that veered more west/southwest aloft allowed for favorable conditions to provide orographic enhancement of precipitation across the Sierra and coastal mountains.
Snow levels were initially 4,000-6,000 feet before tropical moisture increased levels to about 10,000-12,000 feet. Most areas started out receiving a greater amount of rain compared to snow through the duration of the second storm on the 22nd. Snow levels gradually decreased as the final and strongest surface low made landfall on the 23rd down to 6,000-8,000 feet. Levels then generally remained around 5,500-10,000 feet across CA throughout the duration of the final atmospheric river with minimum values of 3,500-6,500 feet at Colfax on the 26th. The heaviest snow occurred at elevations above 7,000 feet where over a foot of snow fell in a span of a few days. The table below contains links to snow level plots from vertically pointed radars, used to determine the bright band location where precipitation transitions from frozen to liquid. This table provides imagery during each storm period from October 17-26.
The links below lead to loops of National Weather Service (NWS) radar data covering the California Nevada River Forecast Center (CNRFC) service area during multiple storm systems that impacted the region between October 17-26. Each image contains a radar mosaic made from individual radars across the region at the top of the hour. Please note, due to the hourly time resolution of these loops, they may take a moment to load.
The table below links to infrared and precipitable water imagery at 1-hour intervals during three storm systems between October 17-26. The infrared satellite imagery shows the colder cloud tops during the waves of precipitation that moved across the region. The precipitable water imagery shows the origins of the tropical moisture plumes that were entrained into each low pressure system and the evolution of this moisture as it moved towards the west coast. Please note, due to the size of these loops, they may take a moment to load.
The table below provides links to 6 hourly NCEP/NCAR Reanalysis data composites at different levels of the atmosphere from October 17-26 during three storm systems that impacted the region. Many parameters also include departure from normal imagery.
Soil Moisture Conditions With the region in the midst of a significant multi-year drought, soil moistures leading up to the storm period were below normal across nearly all of CA/NV, even compared to the already typically-dry conditions at the end of the summer months. The most anomalously dry conditions were across inland portions of the region, especially higher terrain and desert areas, where SMAP soil anomalies were -40% to less than -70%. Following the storm event, soil moistures improved dramatically across much of the northern 3/4 of CA and NW NV, with little to no improvement across the far southern CA coast, SE CA, and SE NV. Across the northern 2/3 of CA and into NW NV, SMAP soil moisture anomalies were +40% to greater than +70%. NRCS soil moisture data for the eastern Sierra showed soil moisture reached just above the maximum recorded value for the date (18-year period of record) immediately following the storm, and remained near or above the record value into late November. See the table below for a link to a soil moisture comparison for before and after the October 2021 event. The region saw a large and much colder storm in December, followed by very dry conditions most of January through early March. By mid March, SMAP data showed soil moisture was below normal for most of CA except for the east side of the Sierra crest and some small areas of Siskiyou County. NRCS data indicated soil moisture in the eastern portion of the Sierra was still high at around 70-90th percentile, with the Tahoe basin near the 50-70th percentile range. By the end of the storm, soil moisture in the wetter areas was near values typically seen December, deeper into the typical wet season.
With the timing of the storm occurring at the beginning of the wet season, soil moisture was increased before the snowpack began to build later in winter (especially December 2021). This led to improved spring runoff efficiency compared to spring 2021, when the snowpack resided on top of very dry soils, and much of the snowmelt contributed to moistening the soil rather than running off into rivers and downstream reservoirs. In addition, baseflow following the Oct 2021 storm remained above average into winter 2021-2022 despite only one large storm in December, but melting snow during warm and dry periods following the December cold storms is another contributing factor to this enhanced baseflow. River Conditions With the ongoing drought conditions, combined with the fact that the storms were the first of note after the climatologically-dry summer months, it is not surprising that streamflow conditions were well-below-average for the date leading up to the October 2021 storm. The table below shows a comparison of USGS streamflow percentile for before and after the storm.
Despite the very dry antecedent conditions, the volume and intensity of precipitation led to rapid and impressive rises on some of the mainstem rivers across the northern half of CA. The following table gives examples of some locations that experienced impressive rises from baseflow or near baseflow to their peaks in a relatively short period of time.
Heavy precipitation north of the San Francisco Bay Area (9 to 17 inches storm total) resulted in rapid rises along the Navarro, Russian, and Napa Rivers. The Russian River at Hopland remained above flood stage for about 8 hours in the late afternoon of October 24 into early morning on the 25th. Other forecast points on the Russian River showed rises, but remained well below monitor stage. On the Napa River, the river crested above monitor stage on the 24th and spent only about 3 hours above its monitor stage at Saint Helena. Downstream in the city of Napa, the river crested just over half a foot below monitor stage. A bit further north, the Navarro River at Navarro crested about 1.6 feet below flood stage in the evening of the 24th. In the central valley, a pulse of higher flows worked its way south through the main stem Sacramento River. While most points remained below monitor stage, the one exception was at Tisdale Weir, where minor overflow occurred for about 28 hours, peaking around 1.5 feet of overflow (nearly 4,400 CFS). Further south, the Consumnes River at Michigan Bar rose above its monitor stage very early in the morning on the 25th and peaked nearly 2 feet below flood stage a few hours later before finally falling below monitor stage late on the 25th. On the Sacramento River at Rio Vista, the combination of low pressure and strong onshore winds helped push the stage above monitor stage a couple of times during the event, most notably during the afternoon/evening of the 24th. On the east side of the central Sierra, heavy rain with snow levels starting around roughly 9000-9500 ft (as estimated from the New Exchequer snow level profiler and Reno RAOB data) led to rises on the rivers on the east side of the Sierra crest. The Truckee River crested right at monitor stage on October 24th in the late evening, with all other forecast points along the Truckee River remaining below monitor stage. Further south where temperatures were a bit higher, the West Fork of the Carson River at Woodfords and the West Walker River at Highway 395 Below Little Walker both crested slightly above flood stage. Storm-total precipitation amounts were around 6-10 inches near the Truckee River at Truckee basin as well as the West Fork of the Carson, with around 3-7 inches further south near the West Walker River. The following table shows peak stage and flow (where applicable) values for each of the CNRFC forecast points that reached a critical threshold (either monitor or flood stage) during the October 2021 event.
Reservoir Conditions Most reservoirs across the region showed only minor changes in storage with a short-lived increase in inflow. Shown below is a summary of the changes at 3 major northern CA reservoirs - Shasta, Oroville, and Folsom. Peak inflow was most impressive at Oroville at over 71,000 CFS, and the largest overall storage gain also occurred at Oroville with over 161,000 ac-ft of increased storage. Relative to normal, the smaller Folsom Lake recorded the biggest storage increase with respect to normal, with an increase from 45.9% of normal before the storm to 65.5% of normal after.
* For storage gain and before/after storm statistics, storm period is defined as 10/24/2021 00 UTC through 10/28/2021 00 UTC (10/23/2021 4 PM PST through 10/27/2021 4 PM PST).
Other Hydrologic Impacts Reports from local Weather Forecast Offices (WFOs) indicated many instances of roadway flooding across the region due to the intensity and amount of precipitation that fell. Numerous reports of rock slides and/or rocks impacting roadways were reported across the northern Sierra on both sides of the crest. This included a closure of Highway 50 due to a rock fall, as well as boulders and debris covering the road on US-395 near CA-270. In addition, a rockslide closed the southbound lanes of Highway 1 along the Big Sur coast. Several reports of mud and rock slides were noted across portions of southern CA as well, including in association with the El Dorado burn scar. Long-Term Drought Relief Prior to the storms, CA/NV had been in an intense multi-year drought. As of October 19, 2021, the U.S. Drought Monitor showed the entire region in at least moderate drought (D1), and a large area of exceptional drought (D4), including southern OR, down the entire CA central valley, and parts of the northern CA coast, southern CA, and southern NV. D4 conditions were reported across nearly 40% of the CNRFC forecast area, with about 81.5% of the area in at least the extreme drought (D3) category. Despite the intense nature of the precipitation and impressive overall totals, long-term drought across CA/NV as reported by the U.S. Drought Monitor showed no improvements for most areas and only marginal improvements in others. In general, the improvements from October 19 to October 26 were in portions of northern CA and northwest NV, where drought conditions improved by up to 1 category. By October 26, D4 conditions were reported across approximately 35% of the CNRFC forecast area, with around 75% at least D3.
Precipitation Overall, deterministic and ensemble model data for late October provided a long lead time with the heavy precipitation that fell across CA and NV, especially with the historic record breaking precipitation amounts that fell across northern CA from late on Saturday, October 23, 2021 through early Monday, October 25, 2021. Meteorologists began referencing the arrival of a deep moisture plume along the northern CA coast for the weekend of Oct 23-24, 2021 as soon as one week prior to the onset of heavy precipitation.
CNRFC Hydrometeorological Discussion Snippet from Monday, October 18, 2021. However, deterministic models along with corresponding ensemble data did show some slight differences in the timing and placement of the deep moisture plume due to the depth of the shortwave trough off the Pacific Northwest and northern California coast. However, confidence was increasing with the potential for a heavy precipitation event for the upcoming weekend of Oct 23-24, 2021. This allowed for general precipitation amounts to be mentioned by CNRFC meteorologists in their Wednesday, October 20, 2021 Hydrometeorological Discussion. These projected precipitation totals were reasonably close given the lead time of 3 to 5 days ahead of the heaviest precipitation over the coastal mountains from the upper Eel River basin down across the Russian and Napa River basins and inland across the west slope of the Sierra from the Feather River basin through the American River basin where widespread precipitation totals of 6" to 12" were observed with localized amounts between 12" and 16".
CNRFC Hydrometeorological Discussion Snippet from Wednesday, October 20, 2021. The table below provides daily verfication imagery for the precipitation forecasts provided by the CNRFC meteorologists. Links include comparison graphics between 24 hour QPF and QPE (ending 5 AM PDT) along with difference graphics that show over and under forecast areas. Also, there are links to interactive versions of these static graphics.
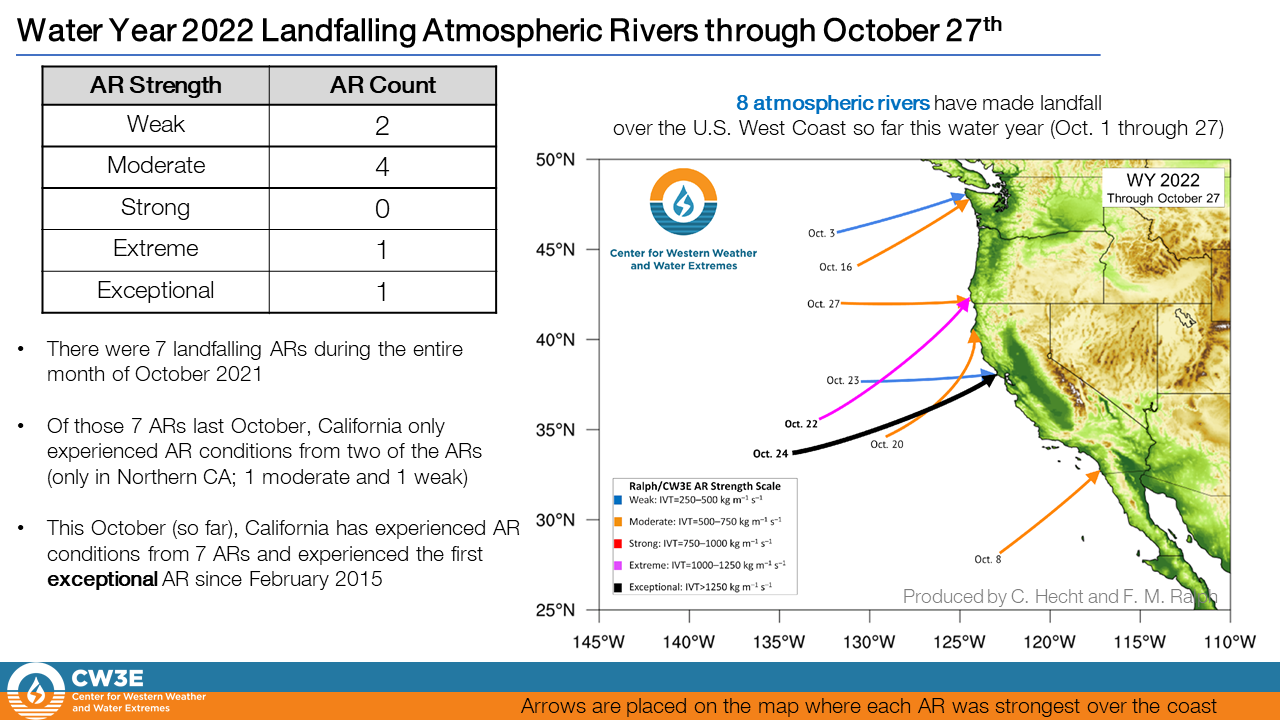
The Center for Western Weather and Water Extremes (CW3E) provided verification data for landfalling atmospheric rivers (ARs) during the month of October 2021, including the peak location and magnitude of integrated water vapor transport (IVT) intersecting the coast for each event. The historic event that brought heavy precipitation to northern CA from late Saturday, October 23, 2021 through early Monday, October 25, 2021 was associated with an atmospheric river that made landfall on October 24, 2021 over the San Francisco Bay Area just north of the Golden Gate. This AR was ranked as "Exceptional" with an IVT greater than 1,250 kg/m/s, the first of its kind across California since February 2015.
Center for Western Weather and Water Extremes (CW3E) Location of Atmospheric River Landfall for October 2021. River Flow / Reservoir Inflow Rivers rose quickly in northern CA on October 24-25 2021 with the above average observed precipitation and a few locations reached monitor and even flood stage. The precipitation accumulation and intensity allowed soil moisture to increase and runoff to occur sooner in some basins. The Russian River at Hopland rose rapidly during the day on October 24, surpassing flood stage (15 ft) in the evening. The river rose higher than the deterministic forecast (12.69 ft) with a peak of 16.65 ft around 10 pm. The HEFS had a 17% chance of reaching flood stage on the October 23 forecast and 20% with the October 24 5 am forecast. Observed precipitation amounts were around 1-2 inches higher than forecast for the area, which helped increase the river flow. The Napa River at St. Helena was underforecast when it peaked above the monitor stage (16ft) at 16.82 ft. It also peaked sooner than forecast. The forecast increased dramatically on October 24 with the deterministic forecast increasing by 5 ft and HEFS increasing from 0% to 51% chance of reaching monitor stage. The Napa River at Napa also peaked sooner and higher than forecast on October 23 and 24 but remained below monitor stage. The Napa River basin received around 2-3 inches more precipitation than predicted on October 23-24. The Eel River at Fernbridge rose quickly in the afternoon of October 24 into the morning of October 25 and was forecast to reach above monitor stage in the deterministic forecasts from October 23 and 24 and 15% chance of reaching monitor stage in the October 23 HEFS forecast and 24% chance in the October 24 HEFS forecast. The river stage topped out just below the monitor stage (14 ft) at 13.21 ft at 8 am on October 25. Forecast precipitation was generally a bit lower than observed in the upper portions of the Eel basin and slightly higher than observed in the lower portions of the basin. The Navarro River at Navarro rose rapidly in the afternoon and evening of October 24 and surpassed the deterministic forecast peak (13.98 10/23 5 am forecast and 15.33 ft 10/24 5 am forecast) and approached flood stage (23 ft) with a peak of 21.36 feet. The HEFS forecast a 5-7% chance of reaching flood stage. The deterministic forecast could have been lower than observed because observed precipitation was around 1 to 2 inches higher than forecast from 5 am Oct 24 to 5am Monday Oct. 25. The forecasts for the Sacramento River verified fairly well, especially at Tehama Bridge and Tidale Weir which got close to the monitor stage or exceeded the monitor stage, respectively. The Sacramento River at Tehama Bridge rose rapidly on October 24 and peaked just below monitor stage (206.5 ft) at 205.9 ft in the early morning of October 25, which was really close to the deterministic forecast on 10/23 5am of 205.9 ft. The HEFS forecast on 10/23 had a 5% chance of reaching monitor stage then rose to 15% on the 10/24 11 am forecast. The forecasts were good as it was close to the monitor stage but didn’t quite reach it. The Sacramento River at Tisdale Weir went above monitor stage (44.1 ft) in the early morning hours of October 26 and peaked at 45.63 ft in the early afternoon, which was a little lower and a little later than the deterministic forecasts. The HEFS forecast showed a 29% chance of reaching monitor stage on the 10/23 5 am forecast and increased to 39% on 10/24 5 am forecast and greater than 97.5% starting with the 10/24 11 am forecast. The Cosumnes River at Michigan Bar was forecast to reach above monitor stage (7 ft) and did so with a peak of 10.11 ft. at 7 am 10/25. The deterministic forecast increased from a peak of 7.25 ft on the 10/23 5am forecast to 9.86 ft on the 10/24 5 am forecast. The observed peak was close to the forecast but occurred a few hours earlier than the deterministic forecast. The 10/23 5 am HEFS forecast had a 15% chance of reaching monitor stage and that increased to 66% on the 10/24 5 am forecast. The Truckee River at Truckee just reached monitor stage (4.5 ft) on 10/24 around 10 pm and peaked at 9.23 ft at Reno on 10/25 around 4 am, which was a little below monitor stage (10ft). The Truckee River rose higher and a little quicker than the deterministic forecasts. The HEFS for the Truckee River at Truckee had a 15% chance of reaching monitor stage and 10% flood stage in the 5am 10/23 forecast and increased to 22% chance for both monitor and flood stage in the 5am 10/24 forecast. The Truckee River at Reno had a 7% chance of reaching monitor stage in the 10/23 5am forecast and increased to a 17% chance in the 10/24 5 am forecast. The West Fork of the Carson River near Woodfords rose rapidly the afternoon of October 24, reaching monitor stage (12.5 ft) around 10 pm and continued rising into the morning hours of October 25, peaking just above flood stage (13.5 ft) at 13.51 ft. The deterministic forecast peaked around 11.2 ft on the forecasts 10/23 and 10/24, and increased to 11.65 ft on the 10/25 forecast, which was still below monitor stage and below the observed, but the timing of the peak matched closely to the observed. The HEFS Forecast had a 5% chance of reaching monitor stage and a 2% chance of flood stage in the 10/23 5 am forecast and increased to 20% for monitor stage and 10% for flood stage in the 10/24 5 am forecast and 29%/24% respectively for the 11 am 10/24 forecast. The rainfall accumulation and intensity helped to produce quicker runoff and higher rises along the Cason River. The East Fork of the Carson River near Gardnerville rose rapidly the evening of 10/24 into the morning of 10/25 and peaked just below monitor stage (13 ft) at 12.82 ft around 5am 10/25. The forecast was to stay below the monitor stage, but the observed stage came closer to the monitor stage and sooner compared to the deterministic forecast peak of around 11 ft at 10/25 3 pm. The HEFS forecast on 10/24 at 5 am gave a 2% chance of reaching monitor stage and flood stage and increased to 24% monitor stage and 22% chance of flood stage in the 10/24 11 am forecast. Burn scar runoff from the Tamarack fire may have also contributed to the faster runoff. The West Walker River at Hwy 395 below Little Walker went higher than forecast and peaked at 6.03 ft just over flood stage (6 ft) around 8 am 10/25. The forecast increased on 10/24 but was still below monitor stage (5.5 ft) by a couple feet, although the forecast peak timing was close to observed. The observed precip was around 1-2 inches higher than the forecast for 5am Oct. 24 to 5 am Oct. 25 and around an inch higher for 5am Oct. 25 to 5am Oct. 26. The Susan River at Susanville peaked sooner and higher than forecast but remained just below monitor stage (10.5 ft) with a peak of 10.3 ft around 2 am 10/25. The 5 am forecast on 10/24 showed a 2% chance of reaching monitor stage on the HEFS and a deterministic forecast peak of about 9 ft.
|
|||||||||||||||||||||||||||||||||||||||||||||||||||||||||||||||||||||||||||||||||||||||||||||||||||||||||||||||||||||||||||||||||||||||||||||||||||||||||||||||||||||||||||||||||||||||||||||||||||||||||||||||||||||||||||||||||||||||||||||||||||||||||||||||||||||||||||||||||||||||||||||||||||||||||||||||||||||||||||||||||||||||||||||||||||||||||||||||||||||||||||||||||||||||||||||||||||||||||||||||||||||||||||||||||||||||||||||||||||||||||||||||||||||||||||||||||||||||||||||||||||||||||||||||||||||||||||||||||||||||||||||||||||||||||||||||||||||||||||||||||||||||||||||||||||||||||||||||||||||||||||||||||||||||||||||||||||||||||||||||||||||||||||||||||||||||||||||||||||||||||||||||||||||||||||||||||||||||||||||||||||||||||||||||||||||||||||||||||||||||||||||||||||||||||||||||||||||||||||||||||||||||||||||||||||||||||||||||||||||||||||||||||||||||||||||||||||||||||||||||||||||||||||||||||||||||||||||||||||||||||||||||||||||||||||||||||||||||||||||||||||||||||||||||||||||||||||||||||||||||