!!! IMPORTANT !!! Flood Threshold Terminology Changes - On October 29, the CNRFC updated flood threshold terminology and corresponding colors to align with the National Weather Service (NWS) standards across the country. The new terminology and colors were implemented on all CNRFC webpages, including the front map interface and individual river forecast points. More information can be found here.
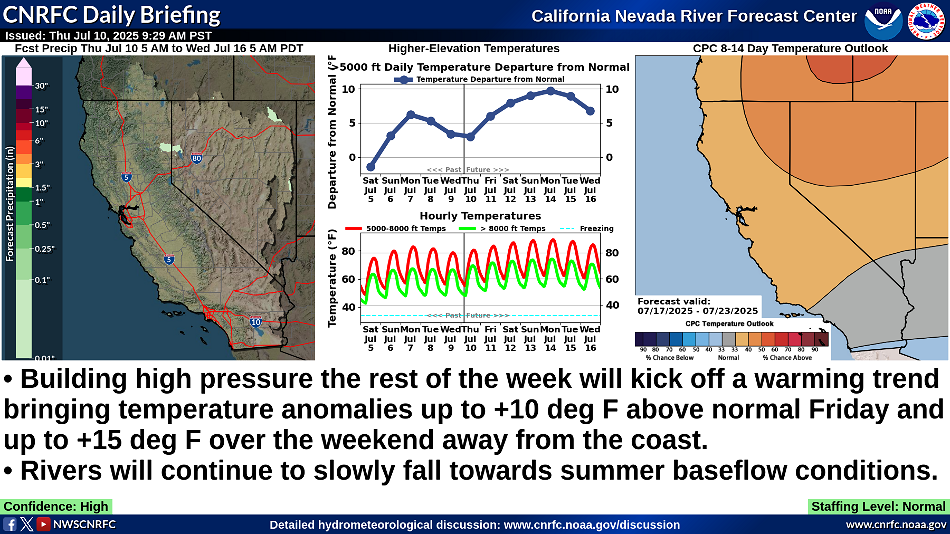
CNRFC Daily Briefing - View a graphical summary of current & forecast weather & hydrologic conditions. Updated by 10 AM PT.
|


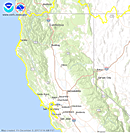
Forecast (large dots): The number inside each circle above represents the number of gages with observed conditions inside that category. The number inside each circle above represents the number of gages with forecast conditions inside that category. The number inside each circle above/below represents the number of gages with conditions inside that category. Observed (small dots): The number inside each circle above represents the number of gages with observed conditions inside that category. The number inside each circle above represents the number of gages with forecast conditions inside that category. The number inside each circle above/below represents the number of gages with conditions inside that category.
|
Rivers/ReservoirsWater ResourcesSnow DataObserved Precipitation (QPE)Forecast Precipitation (QPF)Observed TemperaturesForecast TemperaturesFreezing LevelsFlash Flood Guidance/Debris FlowWater TemperaturesClimate/DroughtQPF VerificationWatches/Warnings/Advisories
|
This image is currently not available. Please try again later.
The selected data is currently not available. Please check again later.
The "Download PNG" feature is not available in this browser. Please try a different browser.
Load a point data set to view data.
| River Guidance Points Forecast Above Specified Stage Definitions (Select NWS ID for Specified Graphical RVF) | |||||||||||
| NWS ID | River / Creek | Gage / Station | Action/ Monitor | Minor Flood | Moderate Flood | Major Flood | Latest Observed Stage / Flow | Latest Observed Date / Time | Max Forecast Stage / Flow | ||
*** NO River Guidance (Flood Forecast) Points Currently Forecast At Or Above Critical Stage Definitions *** | |||||||||||
** NOTE ** Stage is presented in "Feet" while Flow (Storage at CLKC1) is presented in "cfs" ("Acre-Feet"). | |||||||||||
| River Guidance Forecast Group Issuance and Next Update Times (Select Forecast Group for Specified Text RVF) | |||||
| FG ID | Forecast Bulletin Group | Issuance Time | Next Update Time | ||
| SE | North Coast | [ Alternate Link ] |  | Jul 07 2025 at 6:45 AM PDT | Jul 08 2025 at 9:00 AM PDT |
| RN | Russian Napa | [ Alternate Link ] | | Jul 07 2025 at 6:46 AM PDT | Jul 08 2025 at 9:00 AM PDT |
| USA | Upper Sacramento | [ Alternate Link ] | | Jul 07 2025 at 6:57 AM PDT | Jul 08 2025 at 9:00 AM PDT |
| LSC | Lower Sacramento | [ Alternate Link ] | | Jul 07 2025 at 7:07 AM PDT | Jul 08 2025 at 9:00 AM PDT |
| SJ | San Joaquin | [ Alternate Link ] | | Jul 07 2025 at 7:14 AM PDT | Jul 08 2025 at 9:00 AM PDT |
| CC | Central Coast | [ Alternate Link ] | | Jul 07 2025 at 6:48 AM PDT | Jul 08 2025 at 9:00 AM PDT |
| SCA | Southern California | [ Alternate Link ] | | Jul 07 2025 at 6:50 AM PDT | Jul 08 2025 at 9:00 AM PDT |
| ES | Eastern Sierra | [ Alternate Link ] | | Jul 07 2025 at 6:53 AM PDT | Jul 08 2025 at 9:00 AM PDT |
| HBT | Humboldt | [ Alternate Link ] | | Jul 07 2025 at 6:51 AM PDT | Jul 08 2025 at 9:00 AM PDT |
| SAC | Sacramento Delta (Tides) | [ Alternate Link ] | Jul 07 2025 at 6:04 AM PDT | Jul 08 2025 at 9:00 AM PDT | |
| ** NOTE 1 ** The Klamath and North Coast Forecast Group river guidance points are included in the North Coast Bulletin Group. | |||||
| ** NOTE 2 ** The Feather Yuba, American, and Cache Putah Forecast Group river guidance points are included in the Lower Sacramento River Bulletin Group. | |||||
| ** NOTE 3 ** The Delta Region, Upper and Lower San Joaquin, and Tulare Forecast Group river guidance points are combined in the San Joaquin River Bulletin Group. | |||||
| ** NOTE 4 ** The Salinas Pajaro and South Bay Forecast Group river guidance points are included in the Central Coast Bulletin Group. | |||||
| ** NOTE 5 ** The Southern California and San Diego/Inland Forecast Group river guidance points are included in the Southern California Bulletin Group. | |||||
| CNRFC Daily Briefing | ||
|---|---|---|
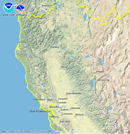
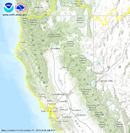
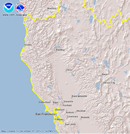
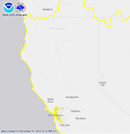
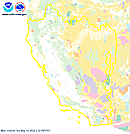
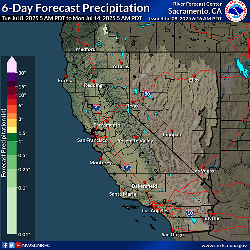
| Observed Precipitation | Graphical Discussion | Forecast Precipitation |
 |
 |
 |
| ** Note ** Click on Indvidual Images to Expand. | ||